
|
|||||
|
 | |
| |
| |
| |
| |
| |
|
Gene: MCTP2 |
Gene summary for MCTP2 |
| Gene information | Species | Human | Gene symbol | MCTP2 | Gene ID | 55784 |
| Gene name | multiple C2 and transmembrane domain containing 2 | |
| Gene Alias | MCTP2 | |
| Cytomap | 15q26.2 | |
| Gene Type | protein-coding | GO ID | GO:0001505 | UniProtAcc | Q6DN12 |
Top |
Malignant transformation analysis |
| Identification of the aberrant gene expression in precancerous and cancerous lesions by comparing the gene expression of stem-like cells in diseased tissues with normal stem cells |
| Entrez ID | Symbol | Replicates | Species | Organ | Tissue | Adj P-value | Log2FC | Malignancy |
| 55784 | MCTP2 | P56T-E | Human | Esophagus | ESCC | 6.32e-04 | 5.28e-01 | 0.1613 |
| 55784 | MCTP2 | P57T-E | Human | Esophagus | ESCC | 3.81e-08 | 2.14e-01 | 0.0926 |
| 55784 | MCTP2 | P61T-E | Human | Esophagus | ESCC | 6.16e-11 | 2.26e-01 | 0.099 |
| 55784 | MCTP2 | P62T-E | Human | Esophagus | ESCC | 9.07e-12 | 2.24e-01 | 0.1302 |
| 55784 | MCTP2 | P65T-E | Human | Esophagus | ESCC | 2.90e-10 | 2.91e-01 | 0.0978 |
| 55784 | MCTP2 | P74T-E | Human | Esophagus | ESCC | 1.25e-05 | 1.70e-01 | 0.1479 |
| 55784 | MCTP2 | P75T-E | Human | Esophagus | ESCC | 4.74e-13 | 2.43e-01 | 0.1125 |
| 55784 | MCTP2 | P76T-E | Human | Esophagus | ESCC | 3.95e-08 | 1.70e-01 | 0.1207 |
| 55784 | MCTP2 | P80T-E | Human | Esophagus | ESCC | 1.14e-02 | 2.01e-01 | 0.155 |
| 55784 | MCTP2 | P82T-E | Human | Esophagus | ESCC | 2.07e-02 | 2.05e-01 | 0.1072 |
| 55784 | MCTP2 | P83T-E | Human | Esophagus | ESCC | 6.60e-25 | 6.76e-01 | 0.1738 |
| 55784 | MCTP2 | P84T-E | Human | Esophagus | ESCC | 1.11e-03 | 3.56e-01 | 0.0933 |
| 55784 | MCTP2 | P89T-E | Human | Esophagus | ESCC | 1.59e-08 | 3.53e-01 | 0.1752 |
| 55784 | MCTP2 | P91T-E | Human | Esophagus | ESCC | 2.61e-06 | 3.63e-01 | 0.1828 |
| 55784 | MCTP2 | P107T-E | Human | Esophagus | ESCC | 1.28e-21 | 4.68e-01 | 0.171 |
| 55784 | MCTP2 | P127T-E | Human | Esophagus | ESCC | 1.70e-11 | 1.80e-01 | 0.0826 |
| 55784 | MCTP2 | P128T-E | Human | Esophagus | ESCC | 2.43e-38 | 1.18e+00 | 0.1241 |
| 55784 | MCTP2 | P130T-E | Human | Esophagus | ESCC | 8.73e-32 | 6.27e-01 | 0.1676 |
| 55784 | MCTP2 | RNA-P10T2-P10T2-2 | Human | Lung | AAH | 1.00e-05 | 9.88e-01 | -0.1406 |
| 55784 | MCTP2 | RNA-P10T2-P10T2-3 | Human | Lung | AAH | 1.51e-07 | 1.09e+00 | -0.1408 |
| Page: 1 2 3 4 5 6 7 8 9 |
| Tissue | Expression Dynamics | Abbreviation |
| Cervix |  | CC: Cervix cancer |
| HSIL_HPV: HPV-infected high-grade squamous intraepithelial lesions | ||
| N_HPV: HPV-infected normal cervix | ||
| Colorectum (GSE201348) |  | FAP: Familial adenomatous polyposis |
| CRC: Colorectal cancer | ||
| Colorectum (HTA11) |  | AD: Adenomas |
| SER: Sessile serrated lesions | ||
| MSI-H: Microsatellite-high colorectal cancer | ||
| MSS: Microsatellite stable colorectal cancer | ||
| Esophagus | 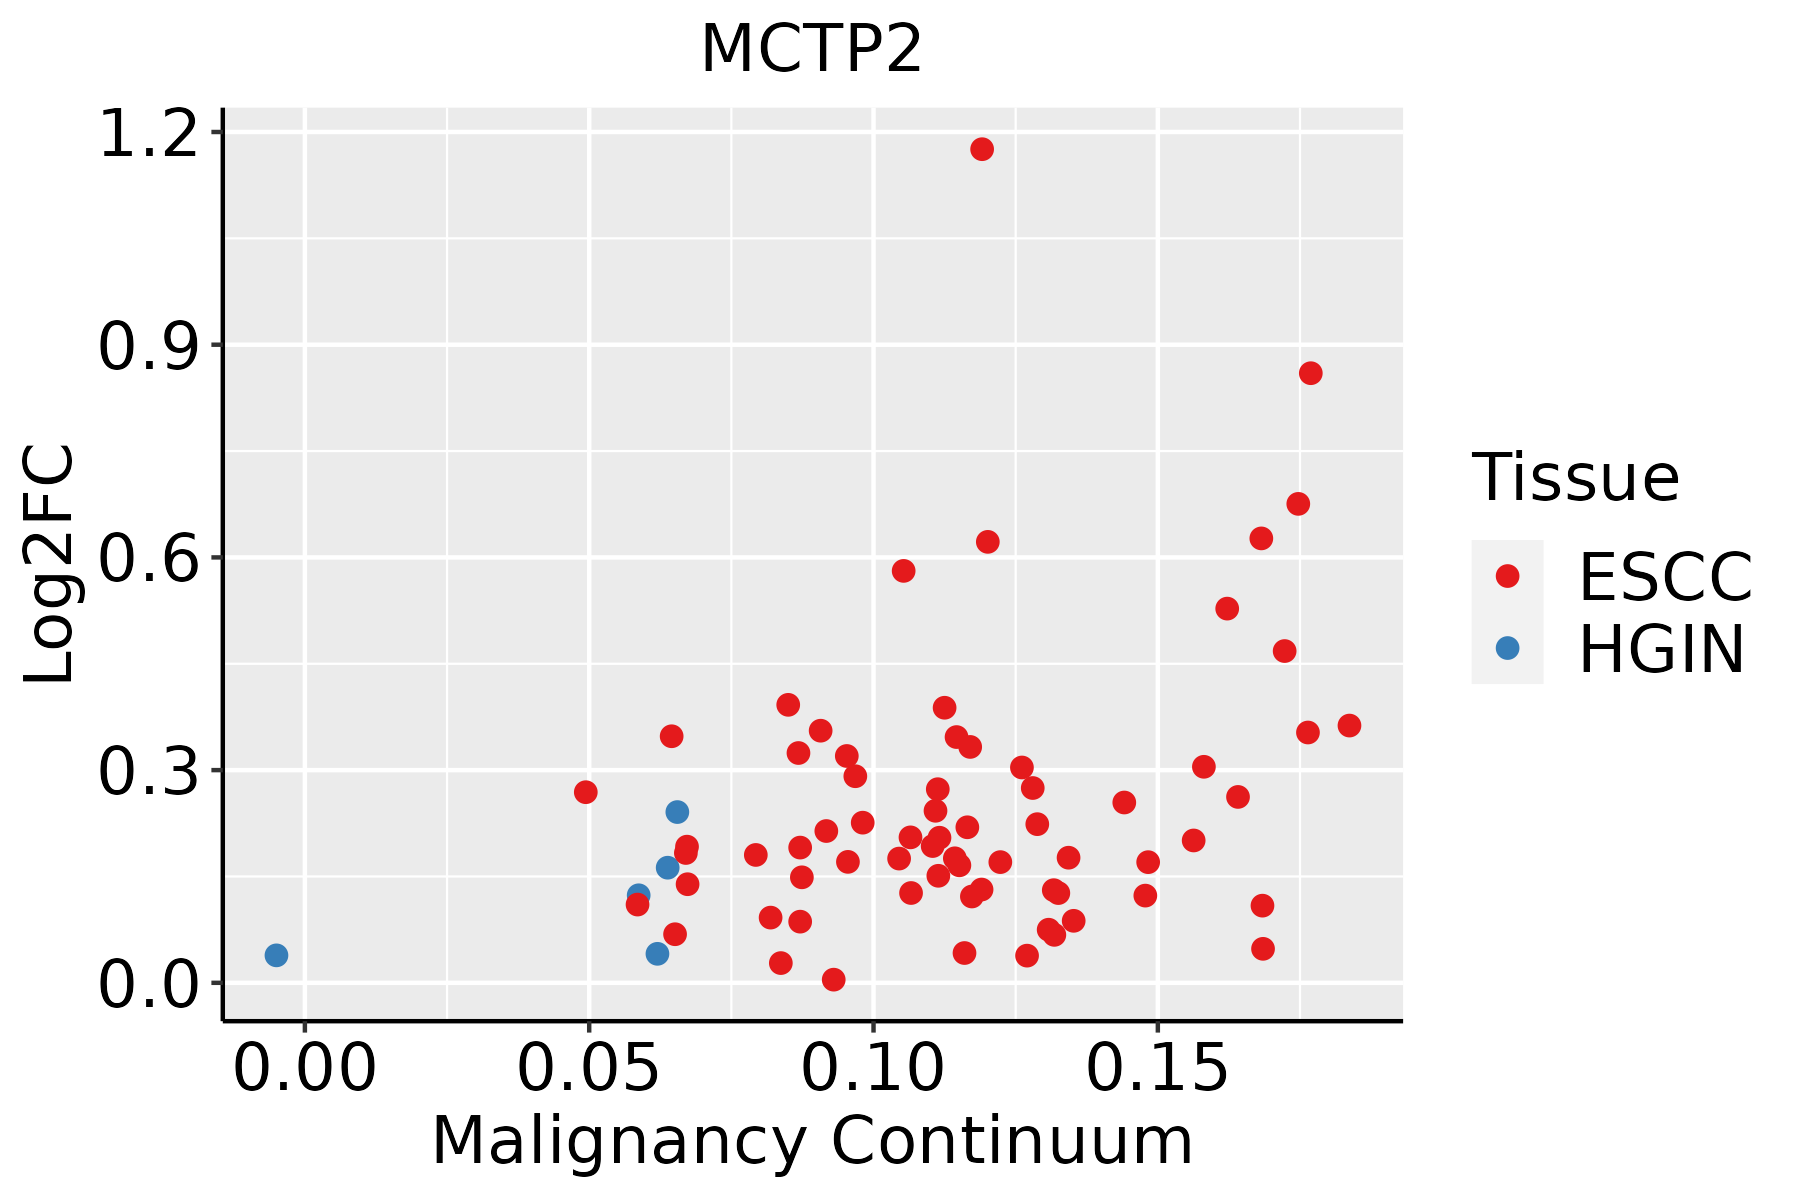 | ESCC: Esophageal squamous cell carcinoma |
| HGIN: High-grade intraepithelial neoplasias | ||
| LGIN: Low-grade intraepithelial neoplasias | ||
| Lung |  | AAH: Atypical adenomatous hyperplasia |
| AIS: Adenocarcinoma in situ | ||
| IAC: Invasive lung adenocarcinoma | ||
| MIA: Minimally invasive adenocarcinoma | ||
| Oral Cavity |  | EOLP: Erosive Oral lichen planus |
| LP: leukoplakia | ||
| NEOLP: Non-erosive oral lichen planus | ||
| OSCC: Oral squamous cell carcinoma | ||
| Prostate | 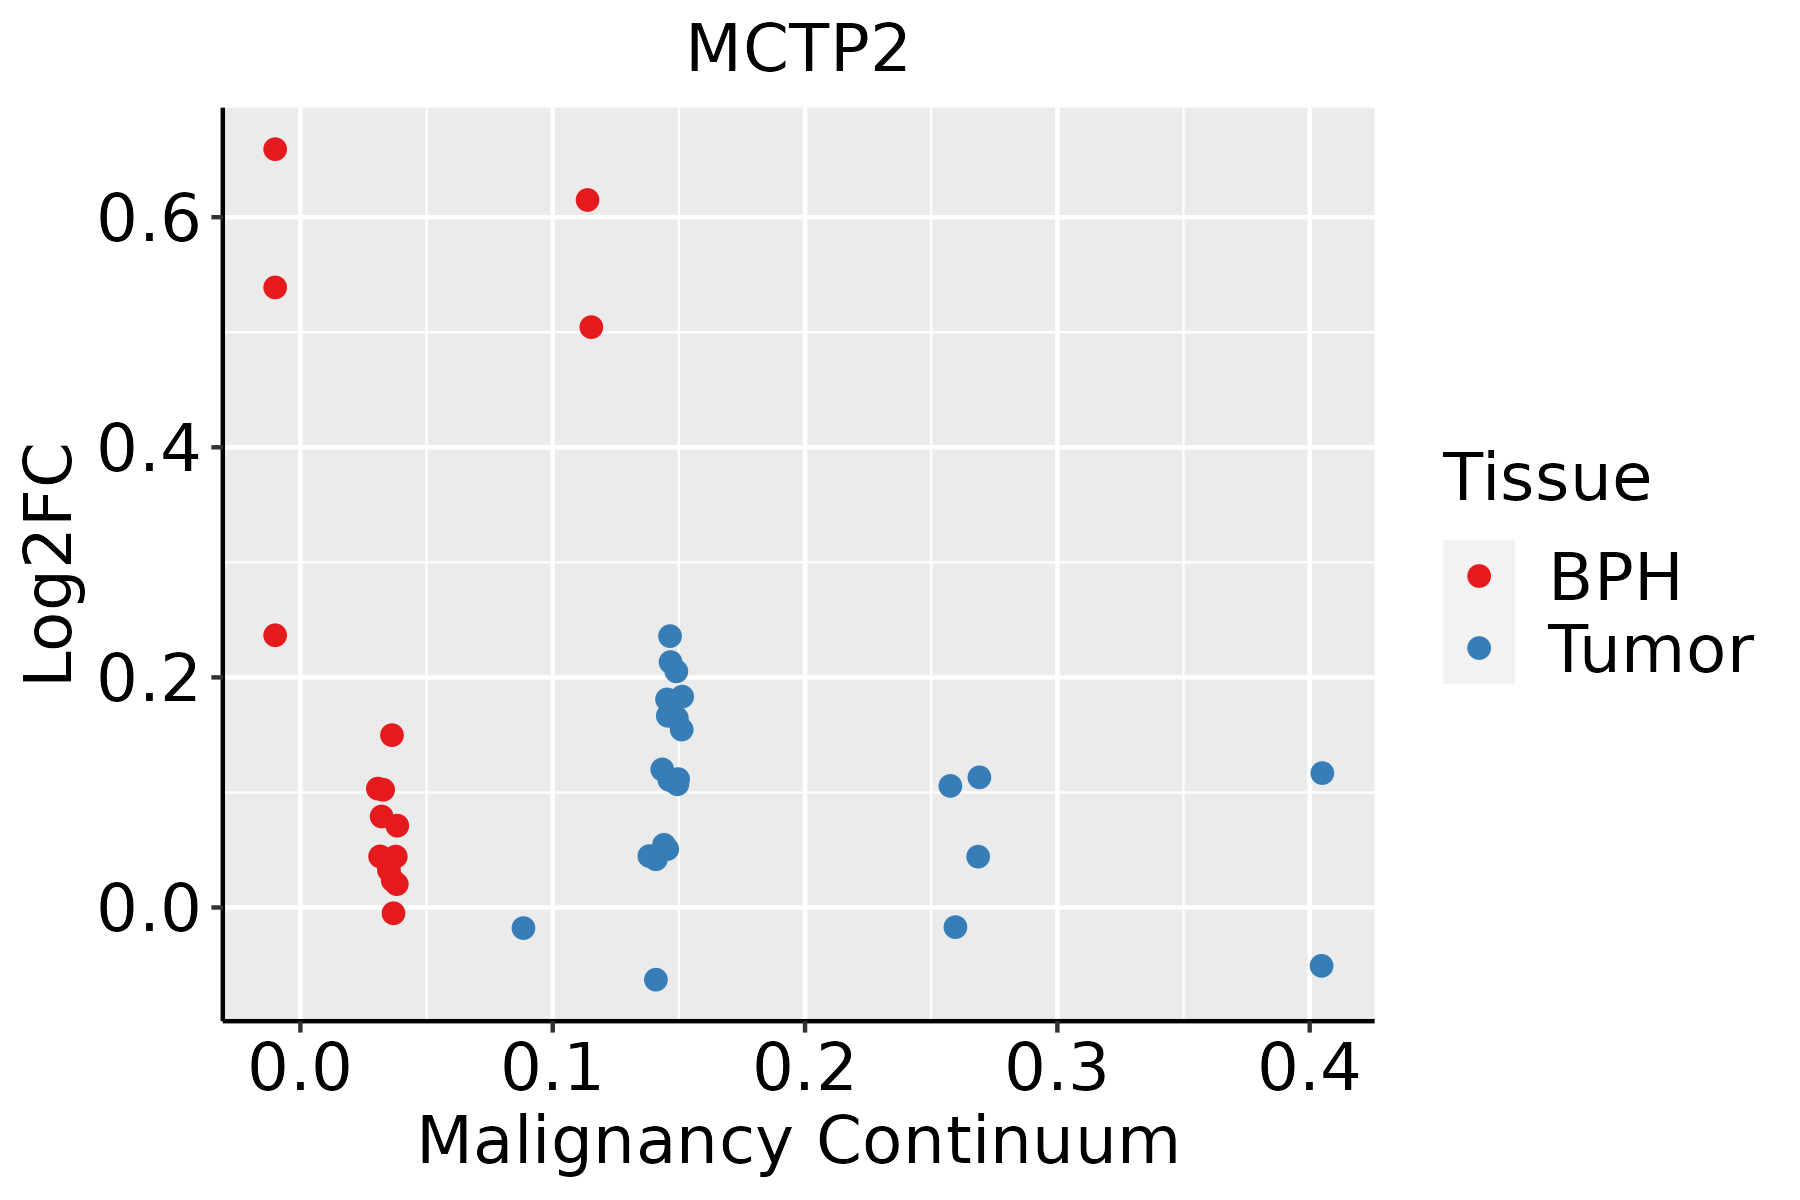 | BPH: Benign Prostatic Hyperplasia |
| Thyroid | 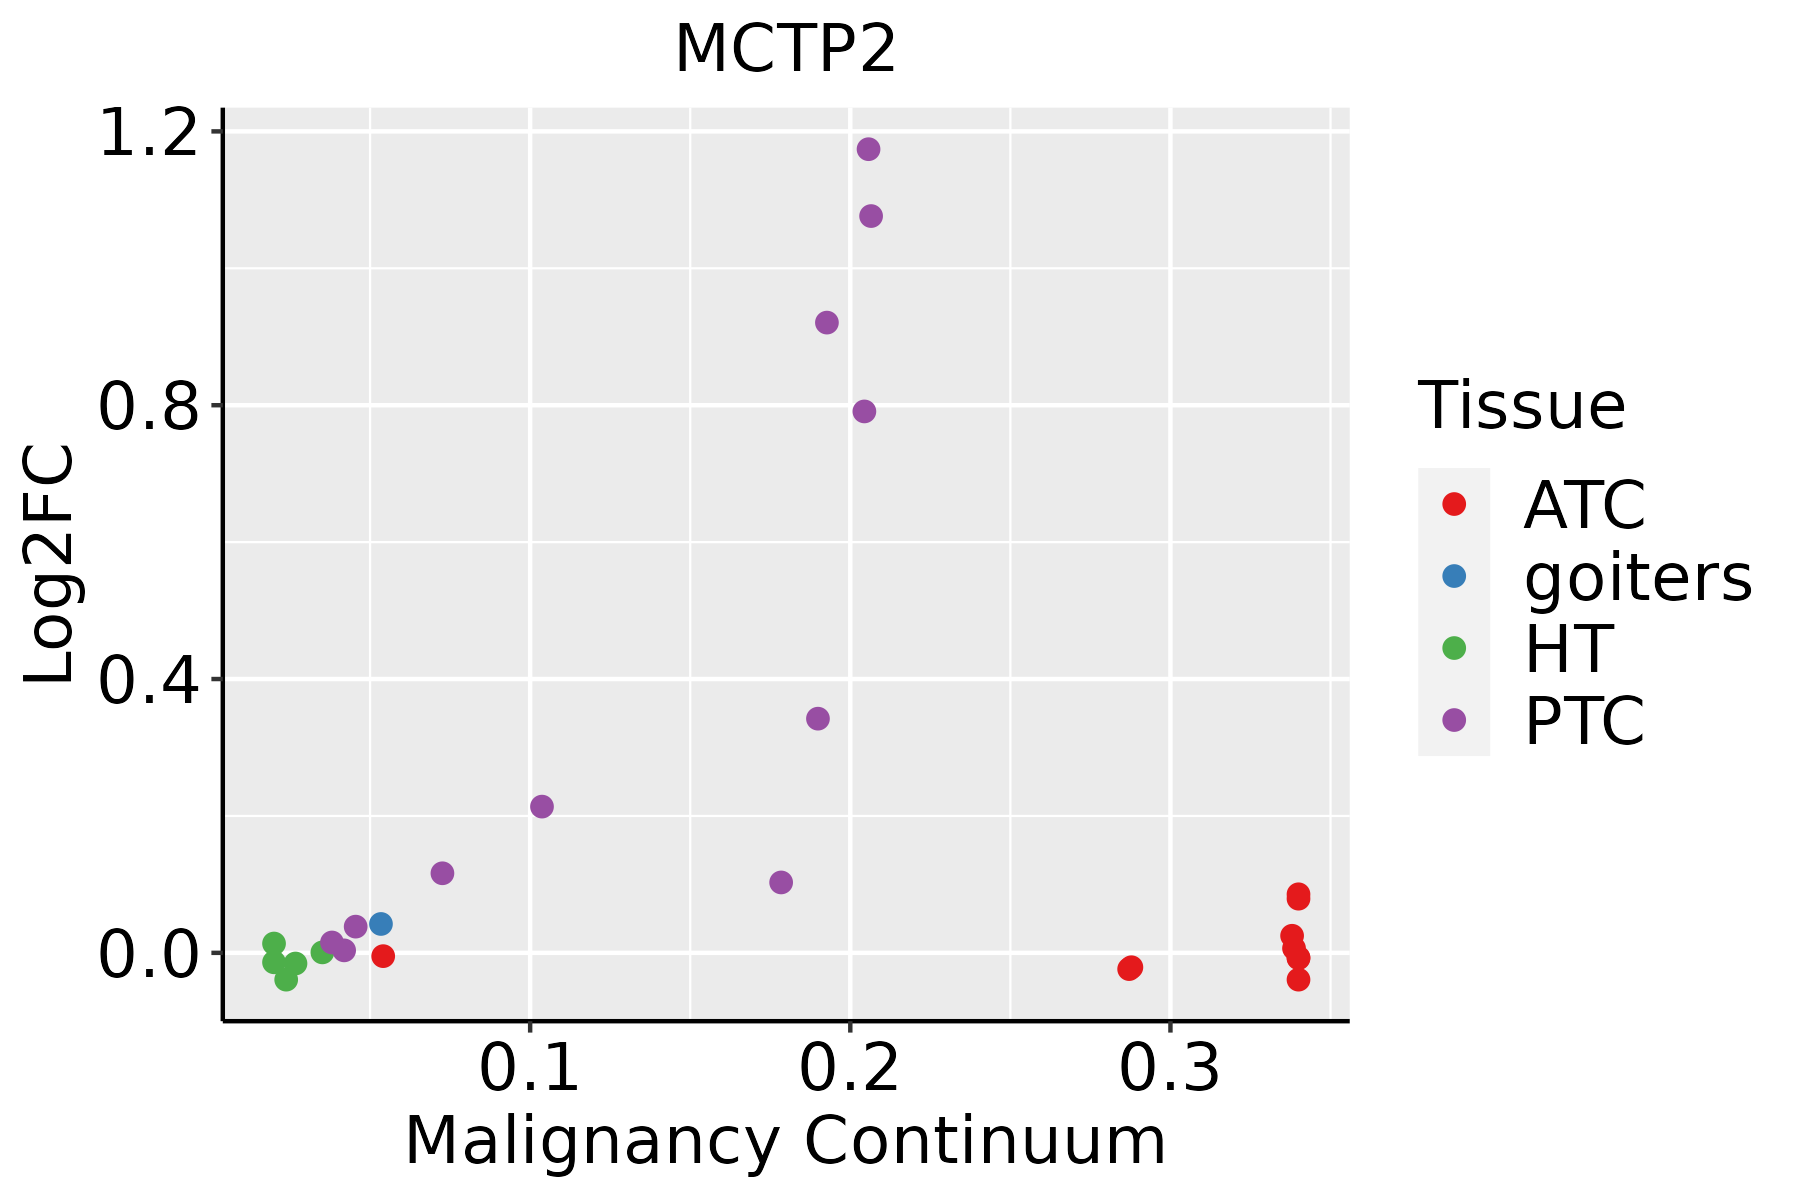 | ATC: Anaplastic thyroid cancer |
| HT: Hashimoto's thyroiditis | ||
| PTC: Papillary thyroid cancer |
| ∗log2FC in expression of this searched gene in stem-like cells from each diseased tissue sample relative to stem-like cells in normal samples in each tissue plotted against the malignancy continuum. Samples are colored based on if they are from different disease stage. |
Top |
Malignant transformation related pathway analysis |
| Find out the enriched GO biological processes and KEGG pathways involved in transition from healthy to precancer to cancer |
| Tissue | Disease Stage | Enriched GO biological Processes |
| Colorectum | AD |  |
| Colorectum | SER |  |
| Colorectum | MSS |  |
| Colorectum | MSI-H |  |
| Colorectum | FAP |  |
| ∗Top 15 enriched GO BP terms are showed in the bar plot of each disease state in each tissue. Each row represents a significant GO biological process which is colored according to the -log10(p.adjust). |
| Page: 1 2 3 4 5 6 7 8 9 |
| GO ID | Tissue | Disease Stage | Description | Gene Ratio | Bg Ratio | pvalue | p.adjust | Count |
| GO:0023061 | Colorectum | FAP | signal release | 94/2622 | 463/18723 | 1.06e-04 | 1.76e-03 | 94 |
| GO:0050804 | Colorectum | CRC | modulation of chemical synaptic transmission | 70/2078 | 439/18723 | 1.15e-03 | 1.33e-02 | 70 |
| GO:0099177 | Colorectum | CRC | regulation of trans-synaptic signaling | 70/2078 | 440/18723 | 1.23e-03 | 1.38e-02 | 70 |
| GO:00230611 | Colorectum | CRC | signal release | 72/2078 | 463/18723 | 1.95e-03 | 1.96e-02 | 72 |
| GO:0019932 | Lung | AIS | second-messenger-mediated signaling | 46/1849 | 312/18723 | 3.79e-03 | 3.52e-02 | 46 |
| GO:00199321 | Lung | MIAC | second-messenger-mediated signaling | 30/967 | 312/18723 | 8.15e-04 | 1.80e-02 | 30 |
| GO:0051588 | Lung | MIAC | regulation of neurotransmitter transport | 13/967 | 100/18723 | 1.89e-03 | 3.02e-02 | 13 |
| Page: 1 |
| Pathway ID | Tissue | Disease Stage | Description | Gene Ratio | Bg Ratio | pvalue | p.adjust | qvalue | Count |
| Page: 1 |
Top |
Cell-cell communication analysis |
| Identification of potential cell-cell interactions between two cell types and their ligand-receptor pairs for different disease states |
| Ligand | Receptor | LRpair | Pathway | Tissue | Disease Stage |
| Page: 1 |
Top |
Single-cell gene regulatory network inference analysis |
| Find out the significant the regulons (TFs) and the target genes of each regulon across cell types for different disease states |
| TF | Cell Type | Tissue | Disease Stage | Target Gene | RSS | Regulon Activity |
| MCTP2 | MMC | Lung | Healthy | ID1,BCAS2,THBS1, etc. | 2.09e-03 |  |
| ∗The dot plots of a searched regulon are shown for all cell subpopulations in each disease state of each tissue based on the regulon specific score inferred using pySCENIC and by calculating the average expression. |
| Page: 1 |
Top |
Somatic mutation of malignant transformation related genes |
| Annotation of somatic variants for genes involved in malignant transformation |
| Hugo Symbol | Variant Class | Variant Classification | dbSNP RS | HGVSc | HGVSp | HGVSp Short | SWISSPROT | BIOTYPE | SIFT | PolyPhen | Tumor Sample Barcode | Tissue | Histology | Sex | Age | Stage | Therapy Types | Drugs | Outcome |
| MCTP2 | SNV | Missense_Mutation | c.678N>C | p.Lys226Asn | p.K226N | Q6DN12 | protein_coding | deleterious(0) | probably_damaging(0.999) | TCGA-A2-A0CL-01 | Breast | breast invasive carcinoma | Female | <65 | III/IV | Chemotherapy | cytoxan | SD | |
| MCTP2 | SNV | Missense_Mutation | c.2075N>C | p.Ile692Thr | p.I692T | Q6DN12 | protein_coding | tolerated(0.26) | benign(0.006) | TCGA-A2-A0EQ-01 | Breast | breast invasive carcinoma | Female | <65 | I/II | Chemotherapy | adriamycin | SD | |
| MCTP2 | SNV | Missense_Mutation | novel | c.2185N>T | p.Val729Phe | p.V729F | Q6DN12 | protein_coding | tolerated(0.16) | benign(0.424) | TCGA-A8-A07G-01 | Breast | breast invasive carcinoma | Female | >=65 | I/II | Chemotherapy | 5-fluorouracil | CR |
| MCTP2 | SNV | Missense_Mutation | novel | c.1968C>G | p.Ile656Met | p.I656M | Q6DN12 | protein_coding | tolerated(0.08) | possibly_damaging(0.856) | TCGA-AC-A5XS-01 | Breast | breast invasive carcinoma | Female | >=65 | I/II | Hormone Therapy | femara | SD |
| MCTP2 | SNV | Missense_Mutation | c.714N>C | p.Leu238Phe | p.L238F | Q6DN12 | protein_coding | deleterious(0) | probably_damaging(1) | TCGA-B6-A0IJ-01 | Breast | breast invasive carcinoma | Female | <65 | I/II | Unknown | Unknown | SD | |
| MCTP2 | SNV | Missense_Mutation | c.162N>A | p.Asp54Glu | p.D54E | Q6DN12 | protein_coding | deleterious(0) | benign(0.371) | TCGA-BH-A0DX-01 | Breast | breast invasive carcinoma | Female | <65 | I/II | Chemotherapy | taxotere | CR | |
| MCTP2 | SNV | Missense_Mutation | c.338N>A | p.Leu113His | p.L113H | Q6DN12 | protein_coding | tolerated(0.22) | benign(0) | TCGA-D8-A1JP-01 | Breast | breast invasive carcinoma | Female | >=65 | I/II | Hormone Therapy | tamoxiphen | SD | |
| MCTP2 | SNV | Missense_Mutation | novel | c.2207N>G | p.Gln736Arg | p.Q736R | Q6DN12 | protein_coding | tolerated(0.49) | benign(0.013) | TCGA-OL-A66J-01 | Breast | breast invasive carcinoma | Female | >=65 | I/II | Unknown | Unknown | SD |
| MCTP2 | insertion | Frame_Shift_Ins | novel | c.1788_1788+1insCCTGGGACTCCTTGGCCATTTGTTG | p.Ile597ProfsTer10 | p.I597Pfs*10 | Q6DN12 | protein_coding | TCGA-A8-A095-01 | Breast | breast invasive carcinoma | Female | <65 | I/II | Chemotherapy | 5-fluorouracil | CR | ||
| MCTP2 | insertion | Frame_Shift_Ins | novel | c.1412_1413insG | p.Val473GlyfsTer5 | p.V473Gfs*5 | Q6DN12 | protein_coding | TCGA-AC-A6NO-01 | Breast | breast invasive carcinoma | Female | <65 | I/II | Unknown | Unknown | SD |
| Page: 1 2 3 4 5 6 7 8 9 10 11 |
Top |
Related drugs of malignant transformation related genes |
| Identification of chemicals and drugs interact with genes involved in malignant transfromation |
| (DGIdb 4.0) |
| Entrez ID | Symbol | Category | Interaction Types | Drug Claim Name | Drug Name | PMIDs |
| Page: 1 |

Copyright 2023-Present -The University of Texas Health Science Center at Houston |