
|
|||||
|
 | |
| |
| |
| |
| |
| |
|
Gene: MARVELD1 |
Gene summary for MARVELD1 |
| Gene information | Species | Human | Gene symbol | MARVELD1 | Gene ID | 83742 |
| Gene name | MARVEL domain containing 1 | |
| Gene Alias | GB14 | |
| Cytomap | 10q24.2 | |
| Gene Type | protein-coding | GO ID | GO:0007049 | UniProtAcc | Q9BSK0 |
Top |
Malignant transformation analysis |
| Identification of the aberrant gene expression in precancerous and cancerous lesions by comparing the gene expression of stem-like cells in diseased tissues with normal stem cells |
| Entrez ID | Symbol | Replicates | Species | Organ | Tissue | Adj P-value | Log2FC | Malignancy |
| 83742 | MARVELD1 | ATC2 | Human | Thyroid | ATC | 1.80e-12 | 8.72e-01 | 0.34 |
| 83742 | MARVELD1 | ATC3 | Human | Thyroid | ATC | 5.97e-08 | 4.41e-01 | 0.338 |
| 83742 | MARVELD1 | ATC4 | Human | Thyroid | ATC | 1.65e-42 | 7.95e-01 | 0.34 |
| 83742 | MARVELD1 | ATC5 | Human | Thyroid | ATC | 5.50e-43 | 7.53e-01 | 0.34 |
| Page: 1 2 3 4 5 |
| Tissue | Expression Dynamics | Abbreviation |
| Esophagus |  | ESCC: Esophageal squamous cell carcinoma |
| HGIN: High-grade intraepithelial neoplasias | ||
| LGIN: Low-grade intraepithelial neoplasias | ||
| Oral Cavity | 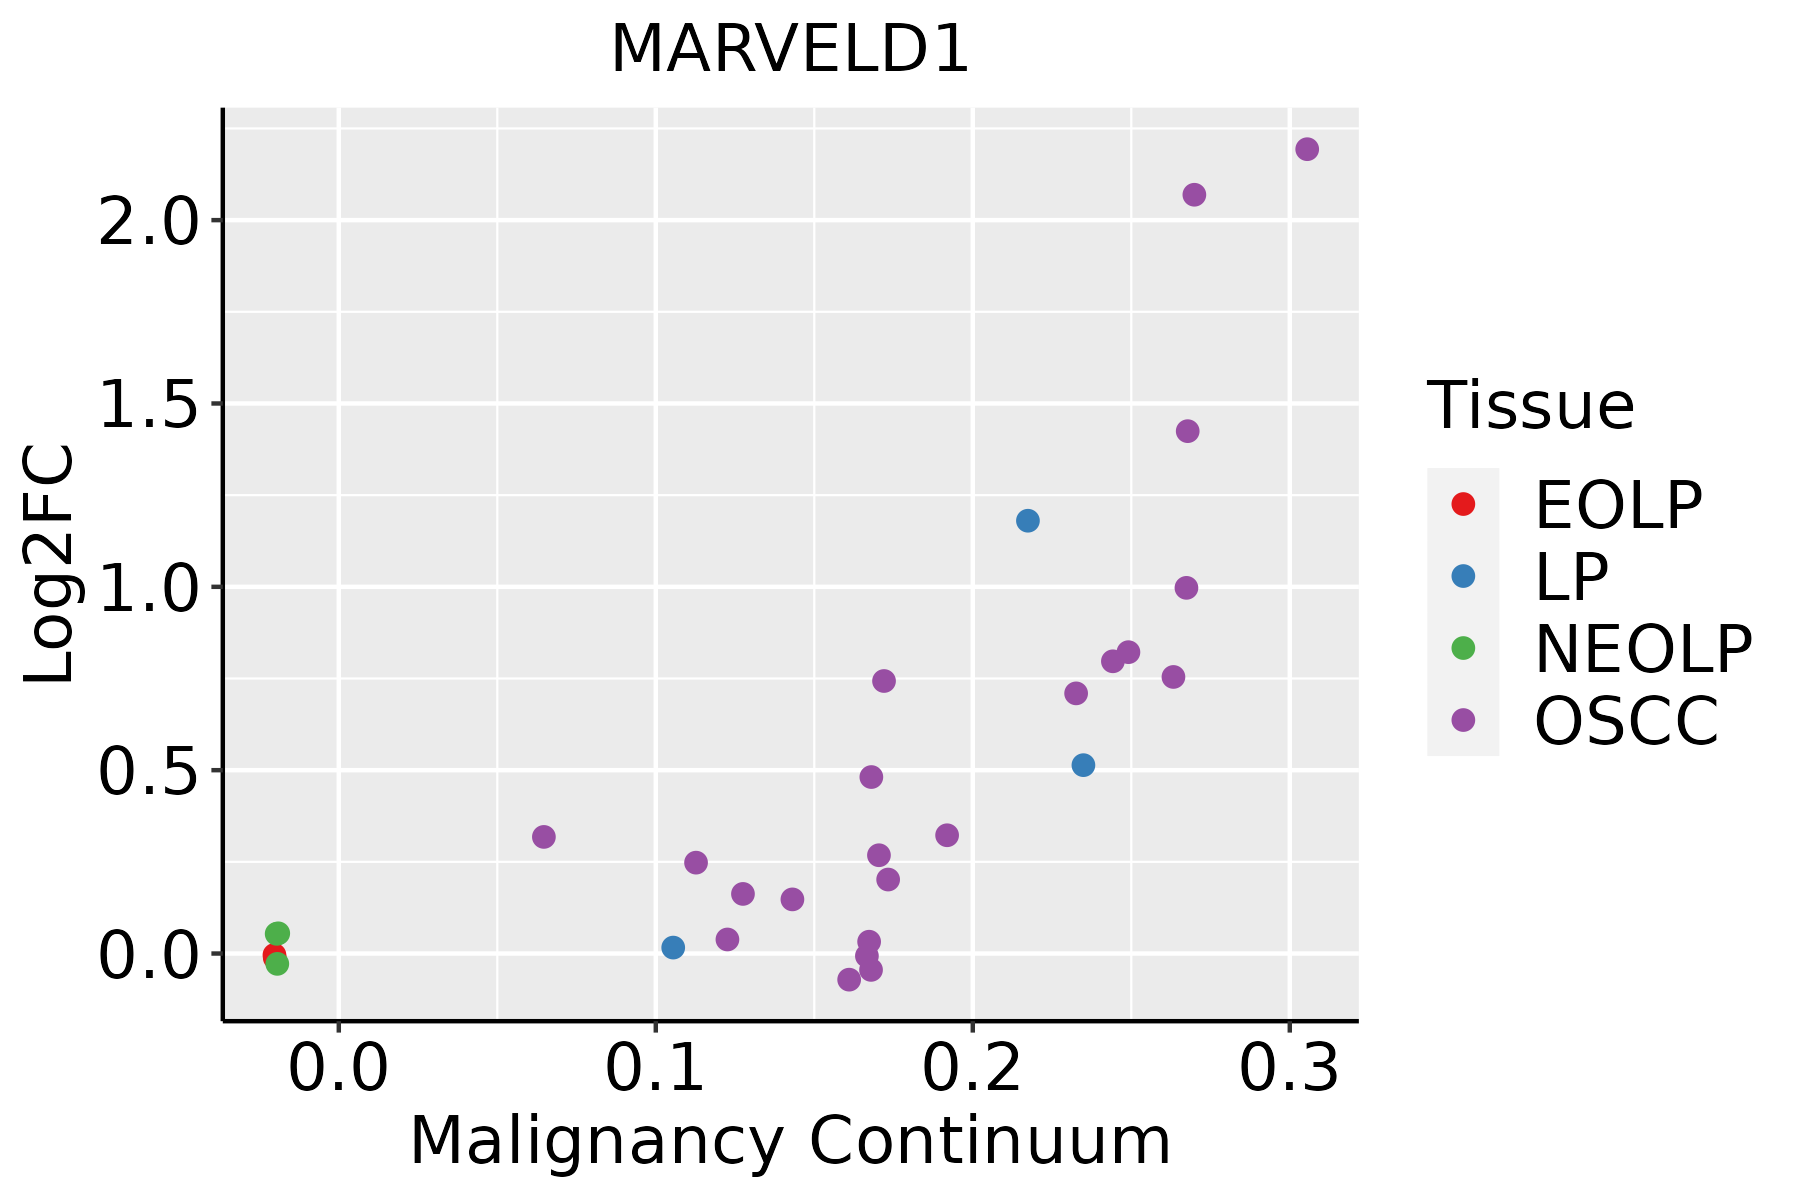 | EOLP: Erosive Oral lichen planus |
| LP: leukoplakia | ||
| NEOLP: Non-erosive oral lichen planus | ||
| OSCC: Oral squamous cell carcinoma | ||
| Skin |  | AK: Actinic keratosis |
| cSCC: Cutaneous squamous cell carcinoma | ||
| SCCIS:squamous cell carcinoma in situ | ||
| Thyroid |  | ATC: Anaplastic thyroid cancer |
| HT: Hashimoto's thyroiditis | ||
| PTC: Papillary thyroid cancer |
| ∗log2FC in expression of this searched gene in stem-like cells from each diseased tissue sample relative to stem-like cells in normal samples in each tissue plotted against the malignancy continuum. Samples are colored based on if they are from different disease stage. |
Top |
Malignant transformation related pathway analysis |
| Find out the enriched GO biological processes and KEGG pathways involved in transition from healthy to precancer to cancer |
| Tissue | Disease Stage | Enriched GO biological Processes |
| Colorectum | AD |  |
| Colorectum | SER |  |
| Colorectum | MSS |  |
| Colorectum | MSI-H |  |
| Colorectum | FAP |  |
| ∗Top 15 enriched GO BP terms are showed in the bar plot of each disease state in each tissue. Each row represents a significant GO biological process which is colored according to the -log10(p.adjust). |
| Page: 1 2 3 4 5 6 7 8 9 |
| GO ID | Tissue | Disease Stage | Description | Gene Ratio | Bg Ratio | pvalue | p.adjust | Count |
| GO:00425524 | Esophagus | ESCC | myelination | 85/8552 | 134/18723 | 2.51e-05 | 2.13e-04 | 85 |
| GO:00072724 | Esophagus | ESCC | ensheathment of neurons | 86/8552 | 136/18723 | 2.68e-05 | 2.24e-04 | 86 |
| GO:00083664 | Esophagus | ESCC | axon ensheathment | 86/8552 | 136/18723 | 2.68e-05 | 2.24e-04 | 86 |
| GO:00072723 | Oral cavity | OSCC | ensheathment of neurons | 72/7305 | 136/18723 | 6.59e-04 | 3.70e-03 | 72 |
| GO:00083663 | Oral cavity | OSCC | axon ensheathment | 72/7305 | 136/18723 | 6.59e-04 | 3.70e-03 | 72 |
| GO:00425523 | Oral cavity | OSCC | myelination | 71/7305 | 134/18723 | 6.93e-04 | 3.86e-03 | 71 |
| GO:004255221 | Skin | cSCC | myelination | 51/4864 | 134/18723 | 1.37e-03 | 8.70e-03 | 51 |
| GO:000727221 | Skin | cSCC | ensheathment of neurons | 51/4864 | 136/18723 | 1.99e-03 | 1.19e-02 | 51 |
| GO:000836621 | Skin | cSCC | axon ensheathment | 51/4864 | 136/18723 | 1.99e-03 | 1.19e-02 | 51 |
| GO:00425526 | Thyroid | ATC | myelination | 62/6293 | 134/18723 | 1.54e-03 | 7.84e-03 | 62 |
| GO:00072726 | Thyroid | ATC | ensheathment of neurons | 62/6293 | 136/18723 | 2.39e-03 | 1.11e-02 | 62 |
| GO:00083666 | Thyroid | ATC | axon ensheathment | 62/6293 | 136/18723 | 2.39e-03 | 1.11e-02 | 62 |
| Page: 1 |
| Pathway ID | Tissue | Disease Stage | Description | Gene Ratio | Bg Ratio | pvalue | p.adjust | qvalue | Count |
| Page: 1 |
Top |
Cell-cell communication analysis |
| Identification of potential cell-cell interactions between two cell types and their ligand-receptor pairs for different disease states |
| Ligand | Receptor | LRpair | Pathway | Tissue | Disease Stage |
| Page: 1 |
Top |
Single-cell gene regulatory network inference analysis |
| Find out the significant the regulons (TFs) and the target genes of each regulon across cell types for different disease states |
| TF | Cell Type | Tissue | Disease Stage | Target Gene | RSS | Regulon Activity |
| ∗The dot plots of a searched regulon are shown for all cell subpopulations in each disease state of each tissue based on the regulon specific score inferred using pySCENIC and by calculating the average expression. |
| Page: 1 |
Top |
Somatic mutation of malignant transformation related genes |
| Annotation of somatic variants for genes involved in malignant transformation |
| Hugo Symbol | Variant Class | Variant Classification | dbSNP RS | HGVSc | HGVSp | HGVSp Short | SWISSPROT | BIOTYPE | SIFT | PolyPhen | Tumor Sample Barcode | Tissue | Histology | Sex | Age | Stage | Therapy Types | Drugs | Outcome |
| MARVELD1 | SNV | Missense_Mutation | novel | c.223N>T | p.Leu75Phe | p.L75F | Q9BSK0 | protein_coding | deleterious(0) | probably_damaging(0.992) | TCGA-EO-A22U-01 | Endometrium | uterine corpus endometrioid carcinoma | Female | >=65 | I/II | Unknown | Unknown | SD |
| Page: 1 |
Top |
Related drugs of malignant transformation related genes |
| Identification of chemicals and drugs interact with genes involved in malignant transfromation |
| (DGIdb 4.0) |
| Entrez ID | Symbol | Category | Interaction Types | Drug Claim Name | Drug Name | PMIDs |
| Page: 1 |

Copyright 2023-Present -The University of Texas Health Science Center at Houston |