
|
|||||
|
 | |
| |
| |
| |
| |
| |
|
Gene: LRIF1 |
Gene summary for LRIF1 |
| Gene information | Species | Human | Gene symbol | LRIF1 | Gene ID | 55791 |
| Gene name | ligand dependent nuclear receptor interacting factor 1 | |
| Gene Alias | C1orf103 | |
| Cytomap | 1p13.3 | |
| Gene Type | protein-coding | GO ID | GO:0006139 | UniProtAcc | Q5T3J3 |
Top |
Malignant transformation analysis |
| Identification of the aberrant gene expression in precancerous and cancerous lesions by comparing the gene expression of stem-like cells in diseased tissues with normal stem cells |
| Entrez ID | Symbol | Replicates | Species | Organ | Tissue | Adj P-value | Log2FC | Malignancy |
| 55791 | LRIF1 | EOLP-1 | Human | Oral cavity | EOLP | 3.64e-03 | 1.80e-01 | -0.0202 |
| 55791 | LRIF1 | SYSMH1 | Human | Oral cavity | OSCC | 2.56e-06 | 2.29e-01 | 0.1127 |
| 55791 | LRIF1 | SYSMH2 | Human | Oral cavity | OSCC | 6.77e-06 | 3.34e-01 | 0.2326 |
| 55791 | LRIF1 | SYSMH3 | Human | Oral cavity | OSCC | 4.42e-02 | 1.32e-01 | 0.2442 |
| 55791 | LRIF1 | P5_S10_cSCC | Human | Skin | cSCC | 5.27e-35 | 5.46e-01 | -0.299 |
| 55791 | LRIF1 | P4_cSCC | Human | Skin | cSCC | 3.50e-03 | 9.81e-02 | -0.00290000000000005 |
| 55791 | LRIF1 | P10_cSCC | Human | Skin | cSCC | 5.37e-13 | 4.71e-01 | 0.1017 |
| 55791 | LRIF1 | male-WTA | Human | Thyroid | PTC | 6.11e-16 | 7.14e-02 | 0.1037 |
| 55791 | LRIF1 | PTC01 | Human | Thyroid | PTC | 6.77e-10 | 4.31e-02 | 0.1899 |
| 55791 | LRIF1 | PTC04 | Human | Thyroid | PTC | 2.16e-04 | 6.08e-02 | 0.1927 |
| 55791 | LRIF1 | PTC05 | Human | Thyroid | PTC | 9.74e-03 | 8.76e-02 | 0.2065 |
| 55791 | LRIF1 | PTC06 | Human | Thyroid | PTC | 5.63e-10 | 3.18e-01 | 0.2057 |
| 55791 | LRIF1 | PTC07 | Human | Thyroid | PTC | 5.71e-21 | 3.53e-01 | 0.2044 |
| 55791 | LRIF1 | ATC09 | Human | Thyroid | ATC | 7.91e-06 | 2.87e-01 | 0.2871 |
| 55791 | LRIF1 | ATC11 | Human | Thyroid | ATC | 7.58e-03 | 2.38e-01 | 0.3386 |
| 55791 | LRIF1 | ATC12 | Human | Thyroid | ATC | 4.15e-20 | 4.46e-01 | 0.34 |
| 55791 | LRIF1 | ATC13 | Human | Thyroid | ATC | 1.87e-24 | 3.86e-01 | 0.34 |
| 55791 | LRIF1 | ATC1 | Human | Thyroid | ATC | 1.57e-07 | 2.90e-01 | 0.2878 |
| 55791 | LRIF1 | ATC2 | Human | Thyroid | ATC | 4.15e-15 | 1.33e+00 | 0.34 |
| 55791 | LRIF1 | ATC3 | Human | Thyroid | ATC | 4.39e-06 | 2.55e-01 | 0.338 |
| Page: 1 2 3 4 5 6 |
| Tissue | Expression Dynamics | Abbreviation |
| Esophagus |  | ESCC: Esophageal squamous cell carcinoma |
| HGIN: High-grade intraepithelial neoplasias | ||
| LGIN: Low-grade intraepithelial neoplasias | ||
| Liver | 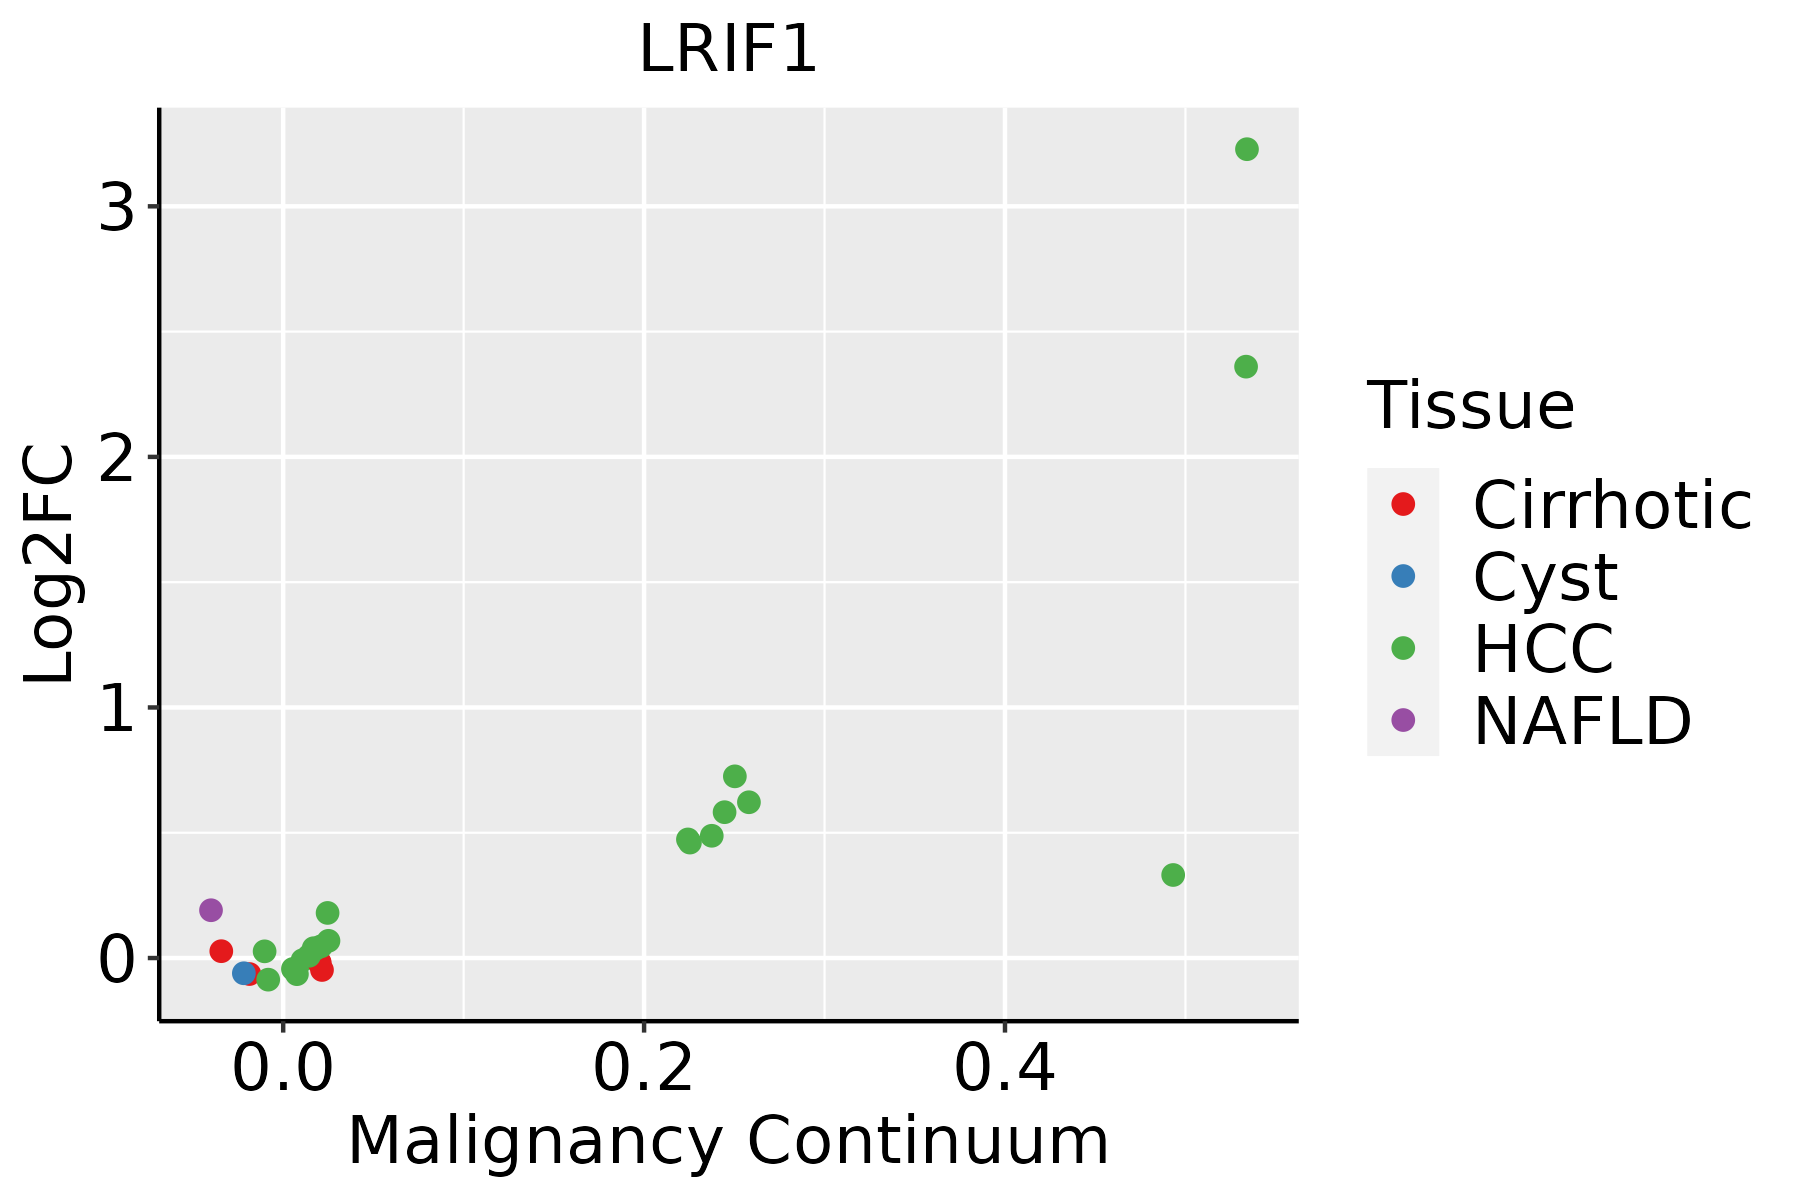 | HCC: Hepatocellular carcinoma |
| NAFLD: Non-alcoholic fatty liver disease | ||
| Oral Cavity |  | EOLP: Erosive Oral lichen planus |
| LP: leukoplakia | ||
| NEOLP: Non-erosive oral lichen planus | ||
| OSCC: Oral squamous cell carcinoma | ||
| Skin | 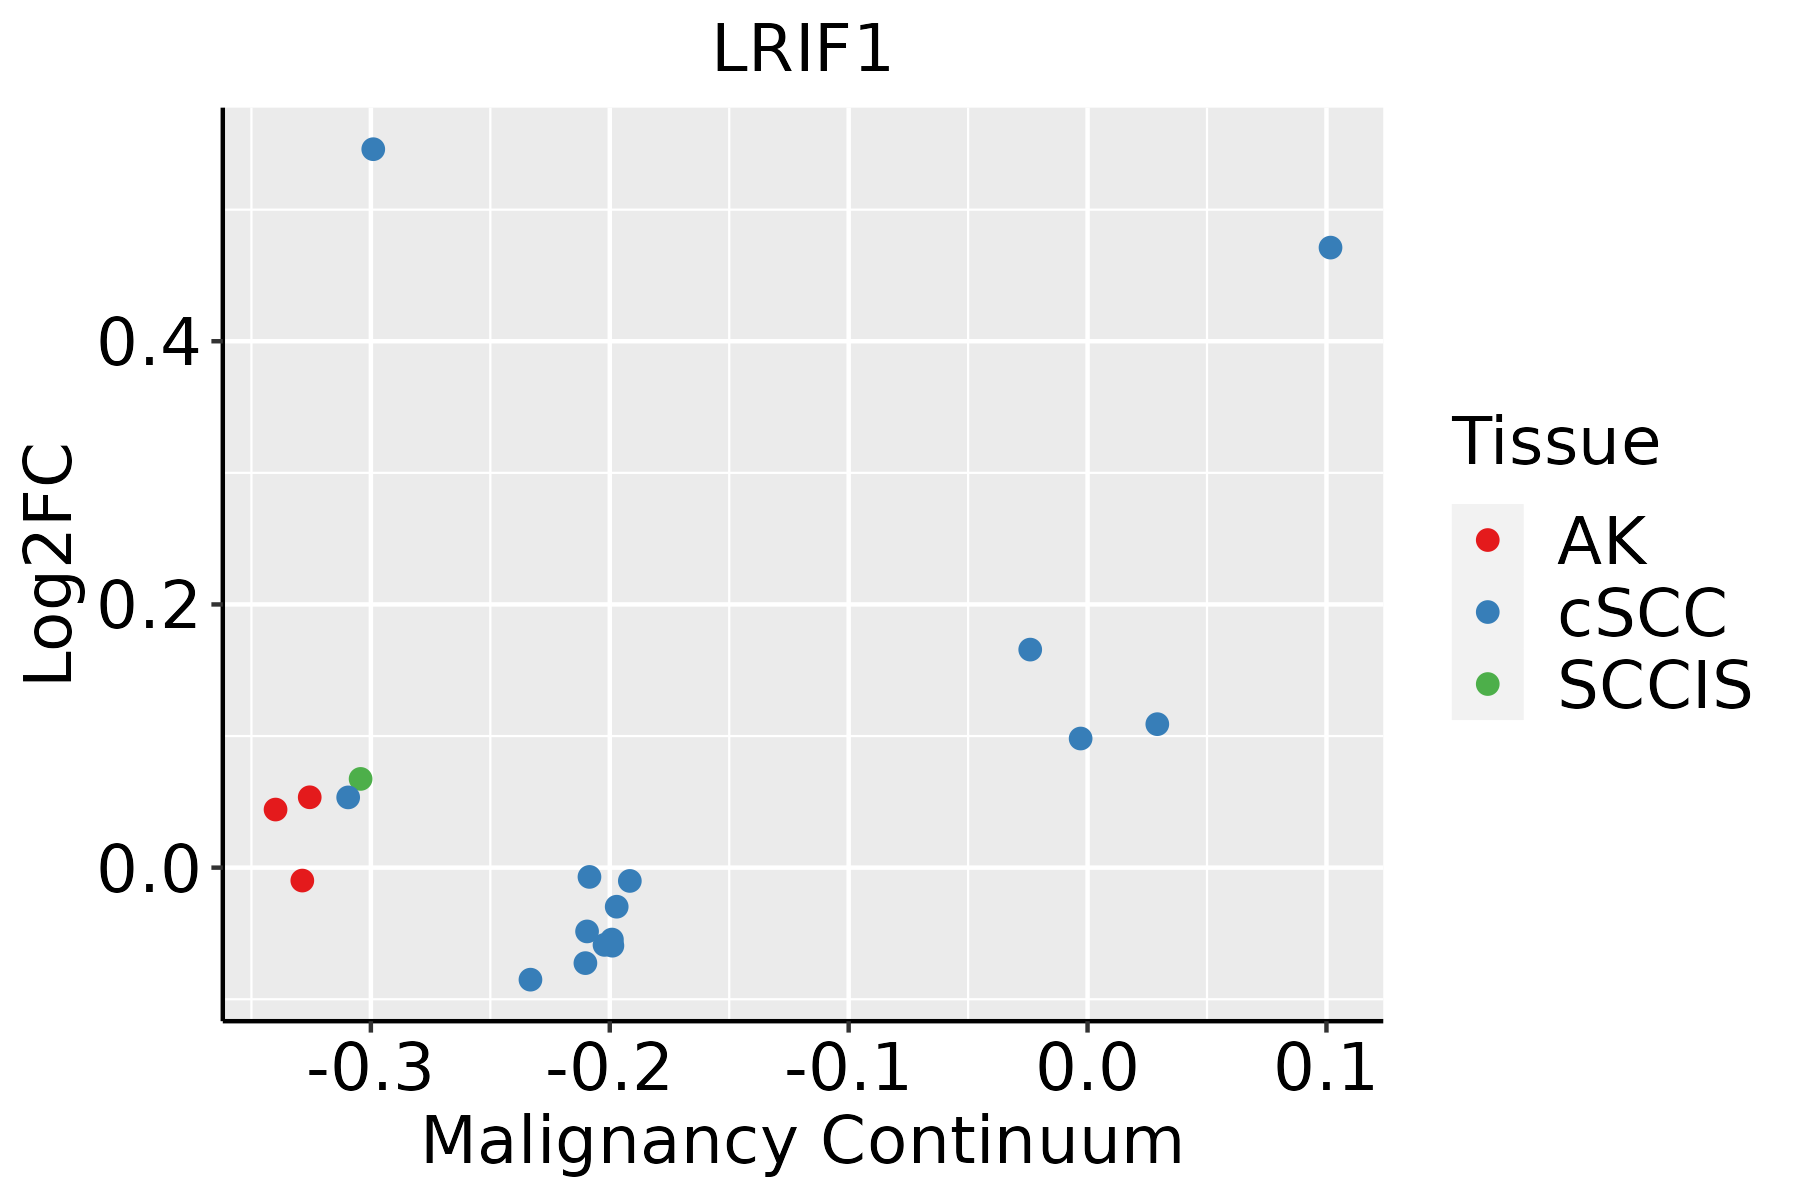 | AK: Actinic keratosis |
| cSCC: Cutaneous squamous cell carcinoma | ||
| SCCIS:squamous cell carcinoma in situ | ||
| Thyroid | 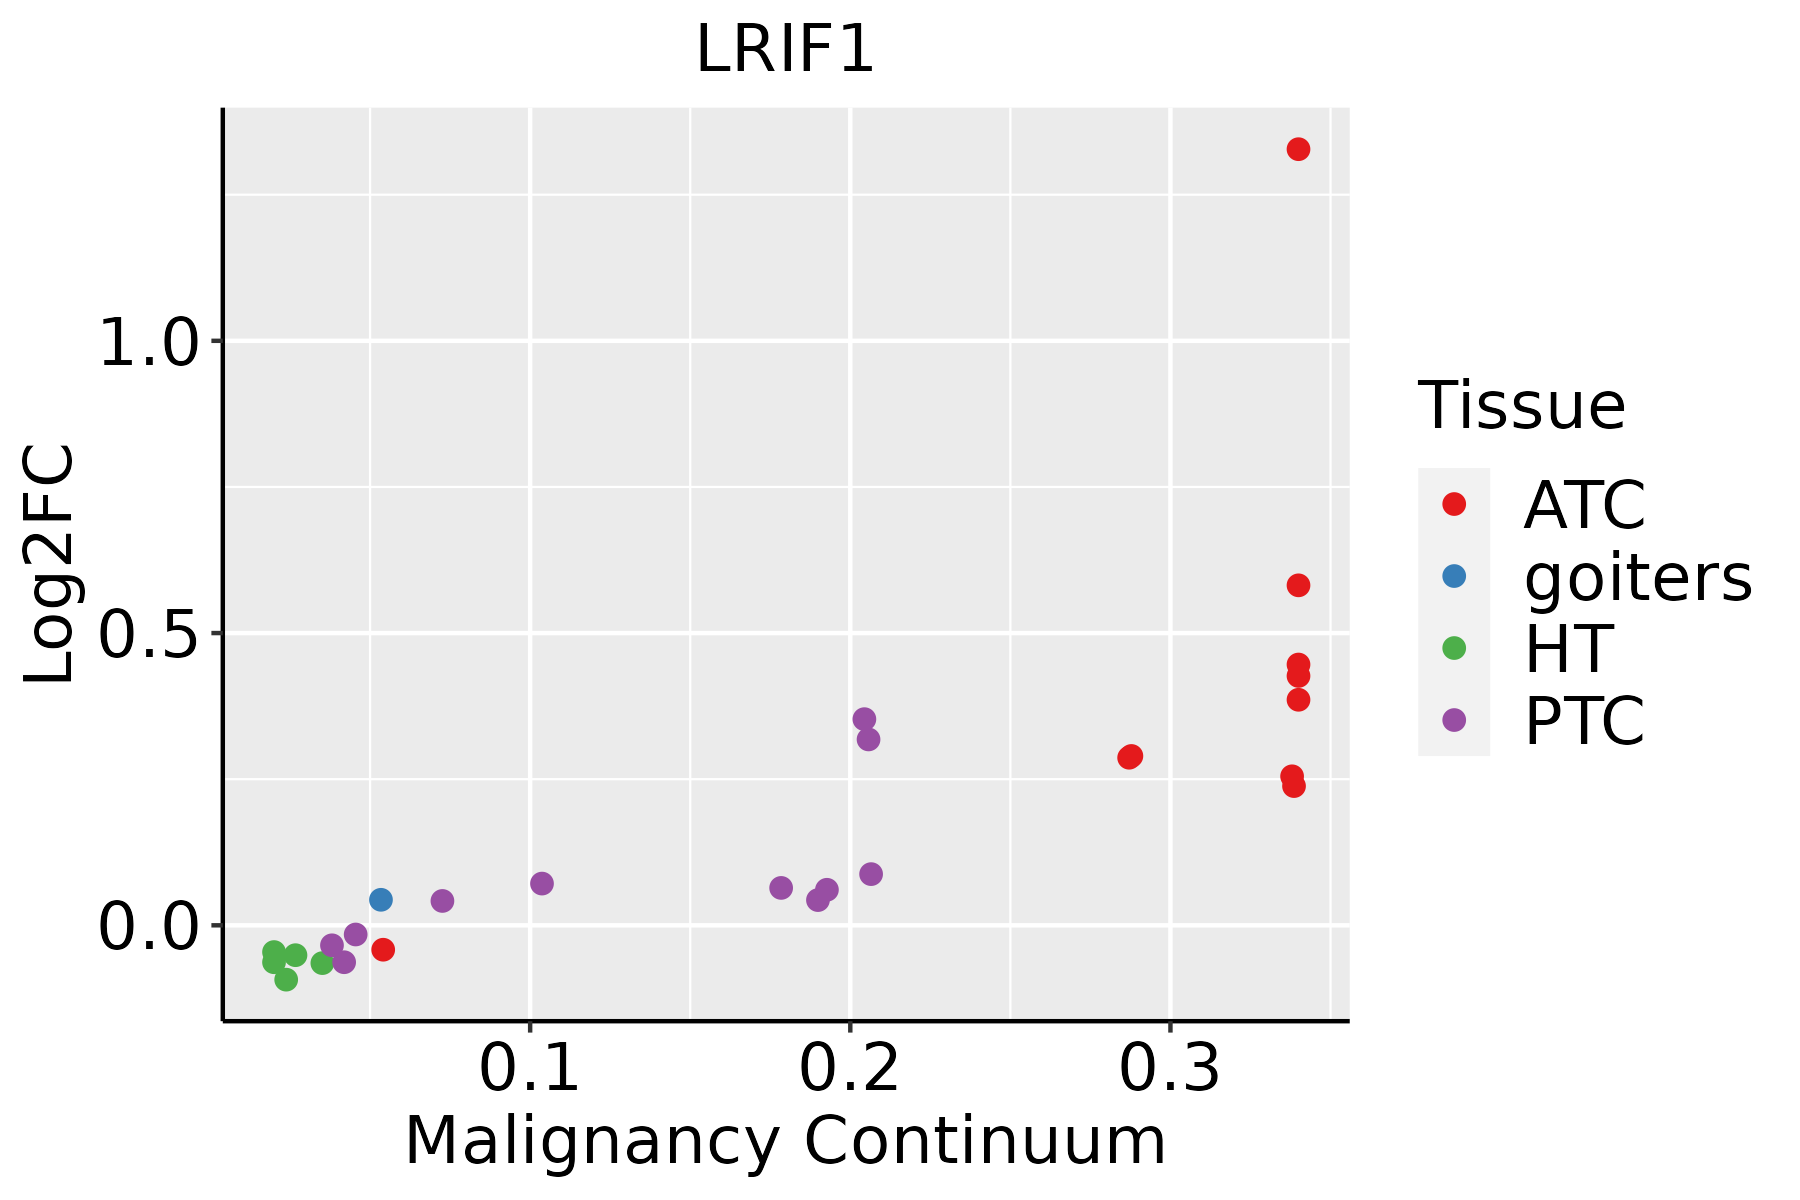 | ATC: Anaplastic thyroid cancer |
| HT: Hashimoto's thyroiditis | ||
| PTC: Papillary thyroid cancer |
| ∗log2FC in expression of this searched gene in stem-like cells from each diseased tissue sample relative to stem-like cells in normal samples in each tissue plotted against the malignancy continuum. Samples are colored based on if they are from different disease stage. |
Top |
Malignant transformation related pathway analysis |
| Find out the enriched GO biological processes and KEGG pathways involved in transition from healthy to precancer to cancer |
| Tissue | Disease Stage | Enriched GO biological Processes |
| Colorectum | AD |  |
| Colorectum | SER |  |
| Colorectum | MSS |  |
| Colorectum | MSI-H |  |
| Colorectum | FAP |  |
| ∗Top 15 enriched GO BP terms are showed in the bar plot of each disease state in each tissue. Each row represents a significant GO biological process which is colored according to the -log10(p.adjust). |
| Page: 1 2 3 4 5 6 7 8 9 |
| GO ID | Tissue | Disease Stage | Description | Gene Ratio | Bg Ratio | pvalue | p.adjust | Count |
| GO:00400295 | Esophagus | ESCC | regulation of gene expression, epigenetic | 74/8552 | 105/18723 | 2.24e-07 | 3.42e-06 | 74 |
| GO:00090484 | Esophagus | ESCC | dosage compensation by inactivation of X chromosome | 14/8552 | 16/18723 | 6.78e-04 | 3.56e-03 | 14 |
| GO:00075494 | Esophagus | ESCC | dosage compensation | 14/8552 | 18/18723 | 5.77e-03 | 2.14e-02 | 14 |
| GO:0040029 | Liver | HCC | regulation of gene expression, epigenetic | 61/7958 | 105/18723 | 9.02e-04 | 5.31e-03 | 61 |
| GO:0009048 | Liver | HCC | dosage compensation by inactivation of X chromosome | 13/7958 | 16/18723 | 1.84e-03 | 9.42e-03 | 13 |
| GO:0007549 | Liver | HCC | dosage compensation | 13/7958 | 18/18723 | 1.05e-02 | 3.89e-02 | 13 |
| GO:00400294 | Oral cavity | OSCC | regulation of gene expression, epigenetic | 59/7305 | 105/18723 | 2.62e-04 | 1.68e-03 | 59 |
| GO:00090483 | Oral cavity | OSCC | dosage compensation by inactivation of X chromosome | 13/7305 | 16/18723 | 7.05e-04 | 3.89e-03 | 13 |
| GO:00075493 | Oral cavity | OSCC | dosage compensation | 13/7305 | 18/18723 | 4.45e-03 | 1.79e-02 | 13 |
| GO:00400292 | Oral cavity | EOLP | regulation of gene expression, epigenetic | 24/2218 | 105/18723 | 1.07e-03 | 7.87e-03 | 24 |
| GO:00090481 | Oral cavity | EOLP | dosage compensation by inactivation of X chromosome | 7/2218 | 16/18723 | 1.40e-03 | 9.58e-03 | 7 |
| GO:00075491 | Oral cavity | EOLP | dosage compensation | 7/2218 | 18/18723 | 3.15e-03 | 1.84e-02 | 7 |
| GO:004002912 | Skin | cSCC | regulation of gene expression, epigenetic | 39/4864 | 105/18723 | 7.56e-03 | 3.53e-02 | 39 |
| GO:00400297 | Thyroid | PTC | regulation of gene expression, epigenetic | 57/5968 | 105/18723 | 1.60e-06 | 2.25e-05 | 57 |
| GO:00090485 | Thyroid | PTC | dosage compensation by inactivation of X chromosome | 10/5968 | 16/18723 | 1.13e-02 | 4.49e-02 | 10 |
| GO:004002913 | Thyroid | ATC | regulation of gene expression, epigenetic | 57/6293 | 105/18723 | 1.01e-05 | 1.00e-04 | 57 |
| Page: 1 |
| Pathway ID | Tissue | Disease Stage | Description | Gene Ratio | Bg Ratio | pvalue | p.adjust | qvalue | Count |
| Page: 1 |
Top |
Cell-cell communication analysis |
| Identification of potential cell-cell interactions between two cell types and their ligand-receptor pairs for different disease states |
| Ligand | Receptor | LRpair | Pathway | Tissue | Disease Stage |
| Page: 1 |
Top |
Single-cell gene regulatory network inference analysis |
| Find out the significant the regulons (TFs) and the target genes of each regulon across cell types for different disease states |
| TF | Cell Type | Tissue | Disease Stage | Target Gene | RSS | Regulon Activity |
| ∗The dot plots of a searched regulon are shown for all cell subpopulations in each disease state of each tissue based on the regulon specific score inferred using pySCENIC and by calculating the average expression. |
| Page: 1 |
Top |
Somatic mutation of malignant transformation related genes |
| Annotation of somatic variants for genes involved in malignant transformation |
| Hugo Symbol | Variant Class | Variant Classification | dbSNP RS | HGVSc | HGVSp | HGVSp Short | SWISSPROT | BIOTYPE | SIFT | PolyPhen | Tumor Sample Barcode | Tissue | Histology | Sex | Age | Stage | Therapy Types | Drugs | Outcome |
| LRIF1 | SNV | Missense_Mutation | c.62N>T | p.Ser21Leu | p.S21L | Q5T3J3 | protein_coding | deleterious(0.01) | benign(0.2) | TCGA-A7-A6VW-01 | Breast | breast invasive carcinoma | Female | <65 | I/II | Chemotherapy | doxorubicin | CR | |
| LRIF1 | SNV | Missense_Mutation | c.1699N>C | p.Asp567His | p.D567H | Q5T3J3 | protein_coding | tolerated(0.31) | probably_damaging(0.943) | TCGA-B6-A0RE-01 | Breast | breast invasive carcinoma | Female | <65 | I/II | Unknown | Unknown | SD | |
| LRIF1 | SNV | Missense_Mutation | c.322N>G | p.Leu108Val | p.L108V | Q5T3J3 | protein_coding | deleterious(0) | benign(0.275) | TCGA-C8-A275-01 | Breast | breast invasive carcinoma | Female | <65 | I/II | Unknown | Unknown | SD | |
| LRIF1 | SNV | Missense_Mutation | c.62N>T | p.Ser21Leu | p.S21L | Q5T3J3 | protein_coding | deleterious(0.01) | benign(0.2) | TCGA-C8-A8HP-01 | Breast | breast invasive carcinoma | Female | <65 | III/IV | Chemotherapy | 5-fluorouracil | CR | |
| LRIF1 | SNV | Missense_Mutation | c.62N>T | p.Ser21Leu | p.S21L | Q5T3J3 | protein_coding | deleterious(0.01) | benign(0.2) | TCGA-EW-A3E8-01 | Breast | breast invasive carcinoma | Female | <65 | I/II | Hormone Therapy | anastrozole | SD | |
| LRIF1 | deletion | Frame_Shift_Del | novel | c.247delC | p.Gln83ArgfsTer30 | p.Q83Rfs*30 | Q5T3J3 | protein_coding | TCGA-D8-A27V-01 | Breast | breast invasive carcinoma | Female | <65 | I/II | Hormone Therapy | tamoxiphen | SD | ||
| LRIF1 | SNV | Missense_Mutation | novel | c.272C>T | p.Ala91Val | p.A91V | Q5T3J3 | protein_coding | deleterious(0.01) | benign(0.109) | TCGA-2W-A8YY-01 | Cervix | cervical & endocervical cancer | Female | <65 | I/II | Chemotherapy | cisplatin | CR |
| LRIF1 | SNV | Missense_Mutation | c.1978N>C | p.Val660Leu | p.V660L | Q5T3J3 | protein_coding | tolerated(0.64) | benign(0.001) | TCGA-FU-A3EO-01 | Cervix | cervical & endocervical cancer | Female | <65 | I/II | Unknown | Unknown | SD | |
| LRIF1 | SNV | Missense_Mutation | c.1168N>G | p.Pro390Ala | p.P390A | Q5T3J3 | protein_coding | tolerated(0.69) | possibly_damaging(0.647) | TCGA-IR-A3LA-01 | Cervix | cervical & endocervical cancer | Female | <65 | I/II | Chemotherapy | cisplatin | CR | |
| LRIF1 | SNV | Missense_Mutation | novel | c.825N>C | p.Glu275Asp | p.E275D | Q5T3J3 | protein_coding | tolerated(0.16) | benign(0.009) | TCGA-JW-A5VL-01 | Cervix | cervical & endocervical cancer | Female | <65 | I/II | Unknown | Unknown | SD |
| Page: 1 2 3 4 5 6 7 8 9 10 11 12 |
Top |
Related drugs of malignant transformation related genes |
| Identification of chemicals and drugs interact with genes involved in malignant transfromation |
| (DGIdb 4.0) |
| Entrez ID | Symbol | Category | Interaction Types | Drug Claim Name | Drug Name | PMIDs |
| Page: 1 |

Copyright 2023-Present -The University of Texas Health Science Center at Houston |