
|
|||||
|
 | |
| |
| |
| |
| |
| |
|
Gene: LGALS4 |
Gene summary for LGALS4 |
| Gene information | Species | Human | Gene symbol | LGALS4 | Gene ID | 3960 |
| Gene name | galectin 4 | |
| Gene Alias | GAL4 | |
| Cytomap | 19q13.2 | |
| Gene Type | protein-coding | GO ID | GO:0007155 | UniProtAcc | P56470 |
Top |
Malignant transformation analysis |
| Identification of the aberrant gene expression in precancerous and cancerous lesions by comparing the gene expression of stem-like cells in diseased tissues with normal stem cells |
| Entrez ID | Symbol | Replicates | Species | Organ | Tissue | Adj P-value | Log2FC | Malignancy |
| 3960 | LGALS4 | cirrhotic2 | Human | Liver | Cirrhotic | 6.39e-34 | 4.01e-01 | 0.0201 |
| 3960 | LGALS4 | cirrhotic3 | Human | Liver | Cirrhotic | 4.58e-02 | 3.05e-01 | 0.0215 |
| 3960 | LGALS4 | p6 | Human | Liver | Cyst | 4.31e-06 | -8.36e-01 | -0.0218 |
| 3960 | LGALS4 | HCC1 | Human | Liver | HCC | 6.77e-160 | 9.86e-01 | 0.5336 |
| 3960 | LGALS4 | HCC2 | Human | Liver | HCC | 5.28e-22 | 6.17e+00 | 0.5341 |
| 3960 | LGALS4 | HCC5 | Human | Liver | HCC | 1.16e-17 | 7.02e-01 | 0.4932 |
| 3960 | LGALS4 | Pt13.a | Human | Liver | HCC | 2.62e-06 | -1.99e-01 | 0.021 |
| 3960 | LGALS4 | Pt13.b | Human | Liver | HCC | 3.58e-18 | -2.54e-01 | 0.0251 |
| 3960 | LGALS4 | Pt13.c | Human | Liver | HCC | 1.24e-10 | -7.29e-01 | 0.0076 |
| 3960 | LGALS4 | S014 | Human | Liver | HCC | 2.38e-23 | -8.36e-01 | 0.2254 |
| 3960 | LGALS4 | S015 | Human | Liver | HCC | 5.04e-07 | -6.84e-01 | 0.2375 |
| 3960 | LGALS4 | S016 | Human | Liver | HCC | 1.13e-24 | -8.19e-01 | 0.2243 |
| 3960 | LGALS4 | S027 | Human | Liver | HCC | 4.30e-21 | 3.56e+00 | 0.2446 |
| 3960 | LGALS4 | S028 | Human | Liver | HCC | 1.90e-38 | 3.40e+00 | 0.2503 |
| 3960 | LGALS4 | S029 | Human | Liver | HCC | 6.01e-37 | 4.14e+00 | 0.2581 |
| 3960 | LGALS4 | Pat01-B | Human | Stomach | GC | 1.65e-55 | 1.17e+00 | 0.5754 |
| 3960 | LGALS4 | Pat02-B | Human | Stomach | GC | 2.90e-70 | 1.05e+00 | 0.0368 |
| 3960 | LGALS4 | Pat03-B | Human | Stomach | GC | 5.82e-55 | 1.20e+00 | 0.3693 |
| 3960 | LGALS4 | Pat04-B | Human | Stomach | GC | 2.62e-39 | 9.68e-01 | -0.1483 |
| 3960 | LGALS4 | Pat05-B | Human | Stomach | GC | 2.92e-21 | 8.76e-01 | -0.0353 |
| Page: 1 2 3 4 5 6 7 |
| Tissue | Expression Dynamics | Abbreviation |
| Colorectum (GSE201348) |  | FAP: Familial adenomatous polyposis |
| CRC: Colorectal cancer | ||
| Colorectum (HTA11) |  | AD: Adenomas |
| SER: Sessile serrated lesions | ||
| MSI-H: Microsatellite-high colorectal cancer | ||
| MSS: Microsatellite stable colorectal cancer | ||
| Esophagus | 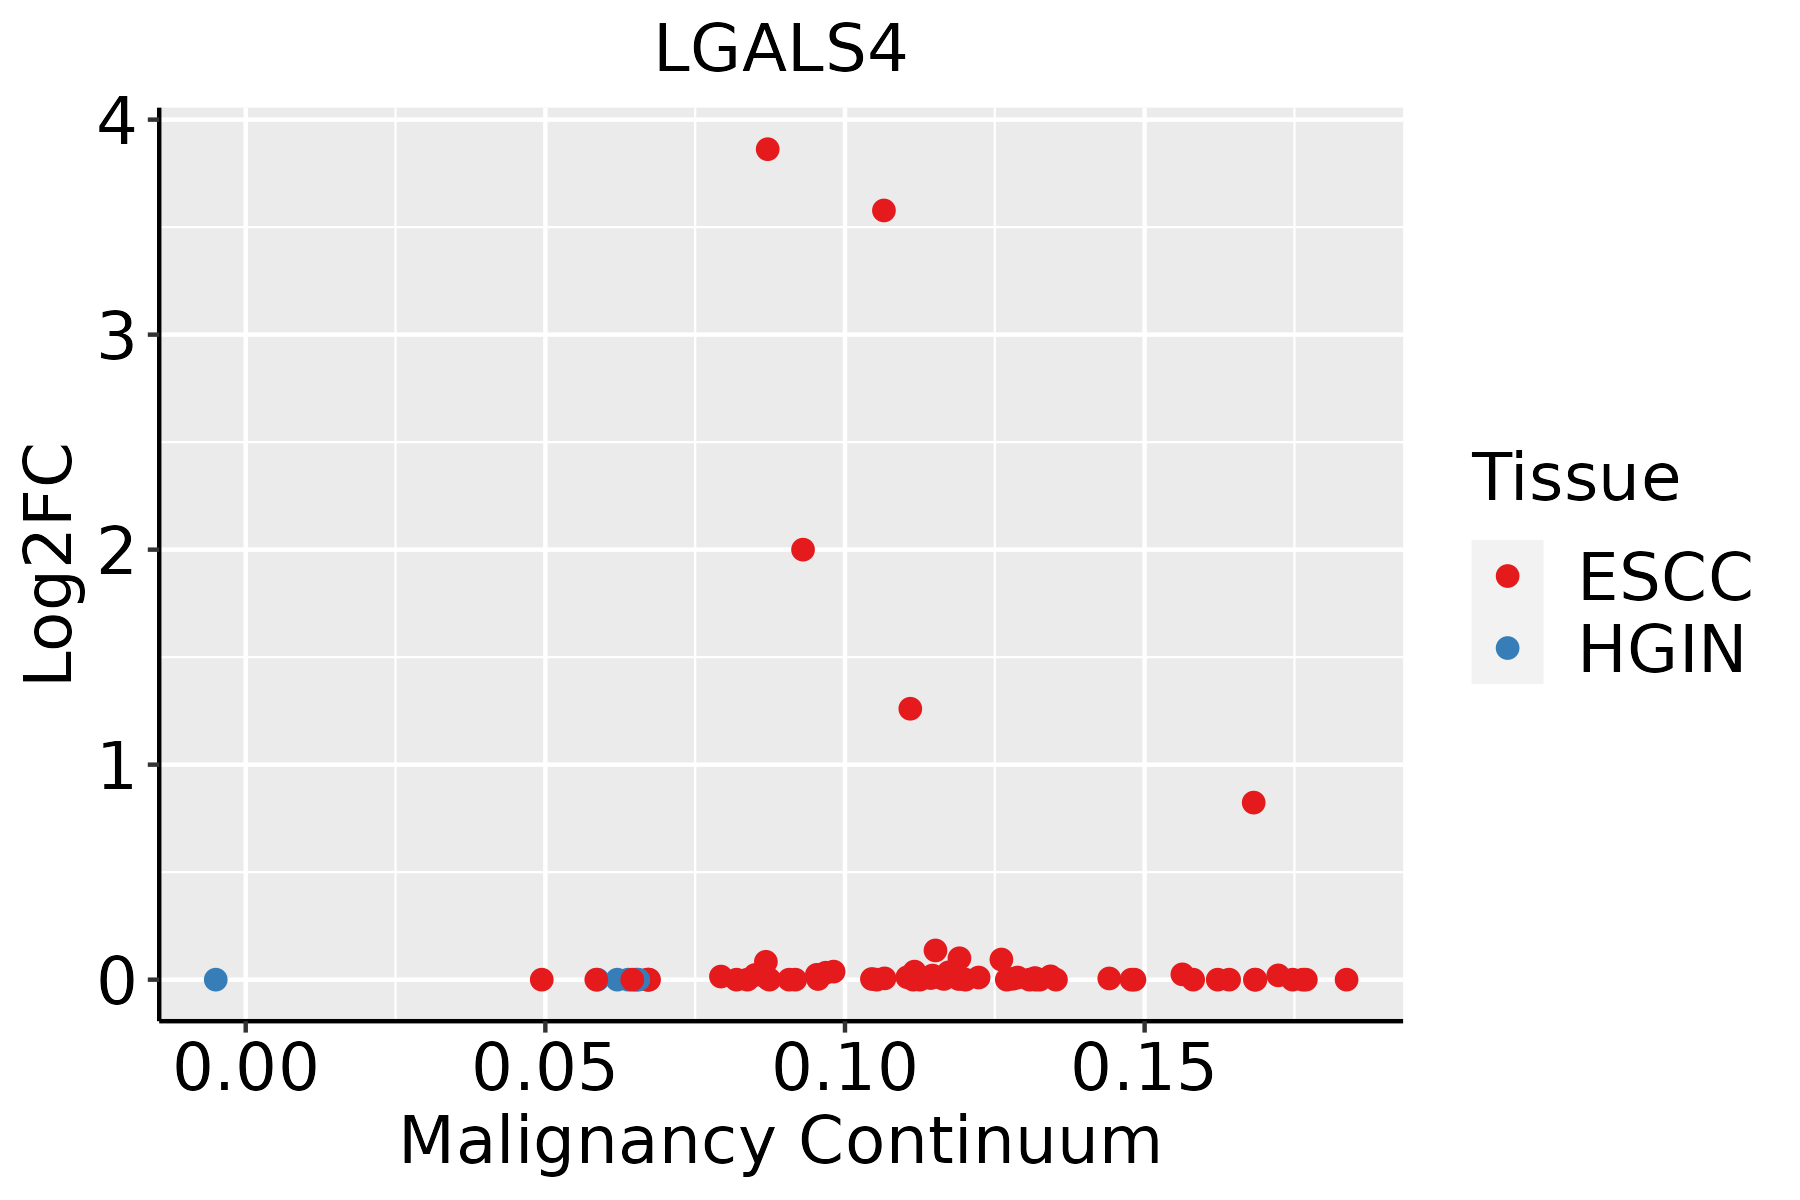 | ESCC: Esophageal squamous cell carcinoma |
| HGIN: High-grade intraepithelial neoplasias | ||
| LGIN: Low-grade intraepithelial neoplasias | ||
| GC | 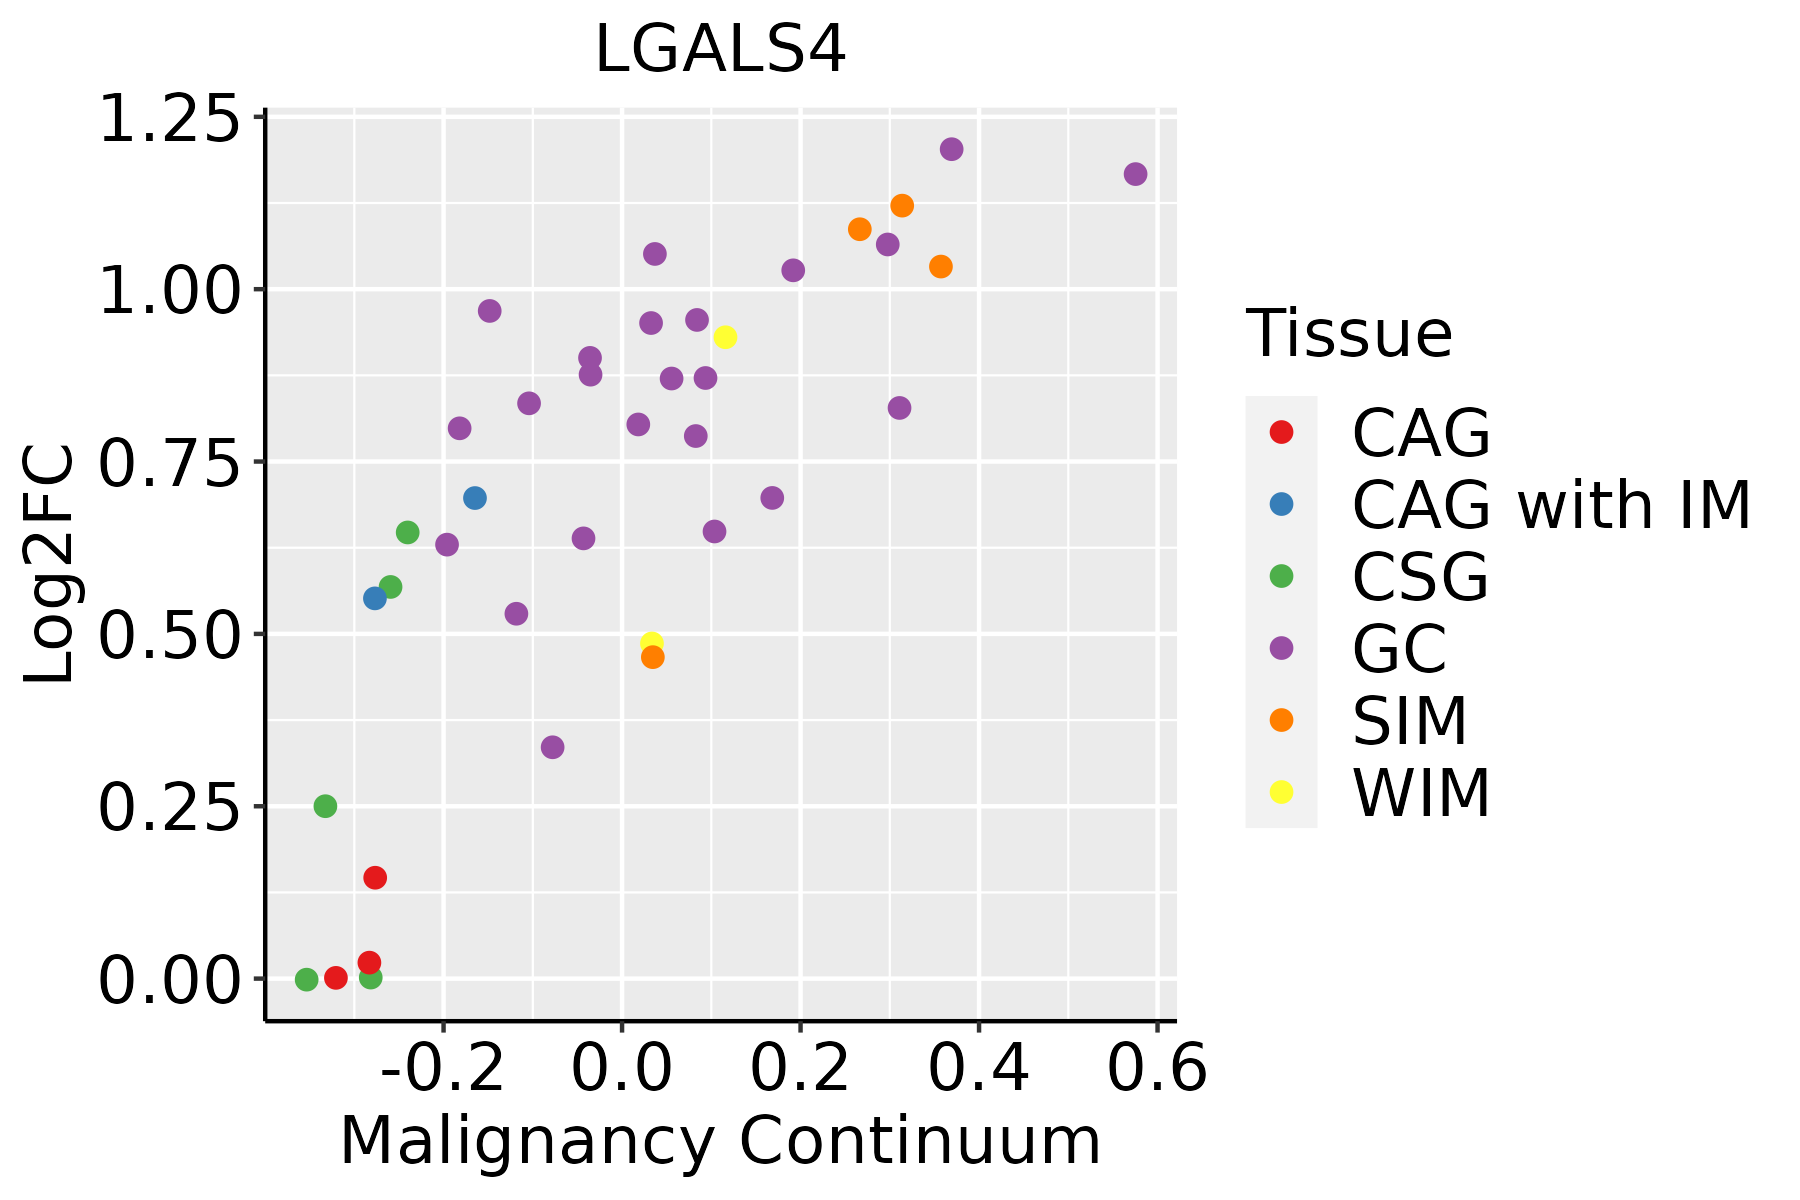 | CAG: Chronic atrophic gastritis |
| CAG with IM: Chronic atrophic gastritis with intestinal metaplasia | ||
| CSG: Chronic superficial gastritis | ||
| GC: Gastric cancer | ||
| SIM: Severe intestinal metaplasia | ||
| WIM: Wild intestinal metaplasia | ||
| Liver |  | HCC: Hepatocellular carcinoma |
| NAFLD: Non-alcoholic fatty liver disease |
| ∗log2FC in expression of this searched gene in stem-like cells from each diseased tissue sample relative to stem-like cells in normal samples in each tissue plotted against the malignancy continuum. Samples are colored based on if they are from different disease stage. |
Top |
Malignant transformation related pathway analysis |
| Find out the enriched GO biological processes and KEGG pathways involved in transition from healthy to precancer to cancer |
| Tissue | Disease Stage | Enriched GO biological Processes |
| Colorectum | AD |  |
| Colorectum | SER |  |
| Colorectum | MSS |  |
| Colorectum | MSI-H |  |
| Colorectum | FAP |  |
| ∗Top 15 enriched GO BP terms are showed in the bar plot of each disease state in each tissue. Each row represents a significant GO biological process which is colored according to the -log10(p.adjust). |
| Page: 1 2 3 4 5 6 7 8 9 |
| GO ID | Tissue | Disease Stage | Description | Gene Ratio | Bg Ratio | pvalue | p.adjust | Count |
| Page: 1 |
| Pathway ID | Tissue | Disease Stage | Description | Gene Ratio | Bg Ratio | pvalue | p.adjust | qvalue | Count |
| Page: 1 |
Top |
Cell-cell communication analysis |
| Identification of potential cell-cell interactions between two cell types and their ligand-receptor pairs for different disease states |
| Ligand | Receptor | LRpair | Pathway | Tissue | Disease Stage |
| Page: 1 |
Top |
Single-cell gene regulatory network inference analysis |
| Find out the significant the regulons (TFs) and the target genes of each regulon across cell types for different disease states |
| TF | Cell Type | Tissue | Disease Stage | Target Gene | RSS | Regulon Activity |
| ∗The dot plots of a searched regulon are shown for all cell subpopulations in each disease state of each tissue based on the regulon specific score inferred using pySCENIC and by calculating the average expression. |
| Page: 1 |
Top |
Somatic mutation of malignant transformation related genes |
| Annotation of somatic variants for genes involved in malignant transformation |
| Hugo Symbol | Variant Class | Variant Classification | dbSNP RS | HGVSc | HGVSp | HGVSp Short | SWISSPROT | BIOTYPE | SIFT | PolyPhen | Tumor Sample Barcode | Tissue | Histology | Sex | Age | Stage | Therapy Types | Drugs | Outcome |
| LGALS4 | SNV | Missense_Mutation | c.219N>T | p.Lys73Asn | p.K73N | P56470 | protein_coding | deleterious(0.01) | probably_damaging(0.923) | TCGA-BH-A0BW-01 | Breast | breast invasive carcinoma | Female | >=65 | I/II | Chemotherapy | adriamycin | CR | |
| LGALS4 | SNV | Missense_Mutation | novel | c.571N>T | p.Pro191Ser | p.P191S | P56470 | protein_coding | tolerated(0.25) | benign(0.006) | TCGA-EW-A1P7-01 | Breast | breast invasive carcinoma | Female | <65 | I/II | Chemotherapy | carboplatin | PD |
| LGALS4 | SNV | Missense_Mutation | rs371360675 | c.719N>A | p.Arg240His | p.R240H | P56470 | protein_coding | deleterious(0) | probably_damaging(0.998) | TCGA-2W-A8YY-01 | Cervix | cervical & endocervical cancer | Female | <65 | I/II | Chemotherapy | cisplatin | CR |
| LGALS4 | SNV | Missense_Mutation | novel | c.203N>G | p.Phe68Cys | p.F68C | P56470 | protein_coding | deleterious(0) | probably_damaging(0.998) | TCGA-5M-AAT4-01 | Colorectum | colon adenocarcinoma | Male | >=65 | III/IV | Unknown | Unknown | PD |
| LGALS4 | SNV | Missense_Mutation | rs761654023 | c.850N>T | p.Arg284Cys | p.R284C | P56470 | protein_coding | deleterious(0.04) | probably_damaging(0.992) | TCGA-A6-6781-01 | Colorectum | colon adenocarcinoma | Male | <65 | III/IV | Chemotherapy | oxaliplatin | SD |
| LGALS4 | SNV | Missense_Mutation | c.605N>G | p.Leu202Arg | p.L202R | P56470 | protein_coding | deleterious(0.02) | probably_damaging(0.997) | TCGA-AA-3492-01 | Colorectum | colon adenocarcinoma | Female | >=65 | I/II | Unknown | Unknown | SD | |
| LGALS4 | SNV | Missense_Mutation | c.819N>A | p.Phe273Leu | p.F273L | P56470 | protein_coding | deleterious(0.02) | benign(0.123) | TCGA-AA-3510-01 | Colorectum | colon adenocarcinoma | Male | >=65 | I/II | Unknown | Unknown | SD | |
| LGALS4 | SNV | Missense_Mutation | rs770991069 | c.115N>A | p.Ala39Thr | p.A39T | P56470 | protein_coding | tolerated(0.24) | benign(0.021) | TCGA-AA-3715-01 | Colorectum | colon adenocarcinoma | Male | >=65 | I/II | Unknown | Unknown | PD |
| LGALS4 | SNV | Missense_Mutation | c.340G>C | p.Val114Leu | p.V114L | P56470 | protein_coding | deleterious(0.01) | possibly_damaging(0.706) | TCGA-AA-3811-01 | Colorectum | colon adenocarcinoma | Female | >=65 | III/IV | Unknown | Unknown | PD | |
| LGALS4 | SNV | Missense_Mutation | rs199814280 | c.905N>T | p.Ser302Leu | p.S302L | P56470 | protein_coding | tolerated(0.25) | benign(0.003) | TCGA-D5-6928-01 | Colorectum | colon adenocarcinoma | Male | >=65 | I/II | Unknown | Unknown | SD |
| Page: 1 2 3 4 |
Top |
Related drugs of malignant transformation related genes |
| Identification of chemicals and drugs interact with genes involved in malignant transfromation |
| (DGIdb 4.0) |
| Entrez ID | Symbol | Category | Interaction Types | Drug Claim Name | Drug Name | PMIDs |
| Page: 1 |

Copyright 2023-Present -The University of Texas Health Science Center at Houston |