
|
|||||
|
 | |
| |
| |
| |
| |
| |
|
Gene: LBR |
Gene summary for LBR |
| Gene information | Species | Human | Gene symbol | LBR | Gene ID | 3930 |
| Gene name | lamin B receptor | |
| Gene Alias | C14SR | |
| Cytomap | 1q42.12 | |
| Gene Type | protein-coding | GO ID | GO:0002376 | UniProtAcc | Q14739 |
Top |
Malignant transformation analysis |
| Identification of the aberrant gene expression in precancerous and cancerous lesions by comparing the gene expression of stem-like cells in diseased tissues with normal stem cells |
| Entrez ID | Symbol | Replicates | Species | Organ | Tissue | Adj P-value | Log2FC | Malignancy |
| 3930 | LBR | C51 | Human | Oral cavity | OSCC | 3.84e-05 | 5.04e-01 | 0.2674 |
| 3930 | LBR | C57 | Human | Oral cavity | OSCC | 1.34e-10 | 4.41e-01 | 0.1679 |
| 3930 | LBR | C06 | Human | Oral cavity | OSCC | 3.87e-03 | 7.58e-01 | 0.2699 |
| 3930 | LBR | C08 | Human | Oral cavity | OSCC | 1.88e-35 | 7.78e-01 | 0.1919 |
| 3930 | LBR | C09 | Human | Oral cavity | OSCC | 2.22e-03 | 1.23e-01 | 0.1431 |
| 3930 | LBR | LN46 | Human | Oral cavity | OSCC | 3.40e-03 | 1.75e-01 | 0.1666 |
| 3930 | LBR | EOLP-1 | Human | Oral cavity | EOLP | 1.83e-05 | 1.73e-01 | -0.0202 |
| 3930 | LBR | NEOLP-2 | Human | Oral cavity | NEOLP | 3.36e-02 | 1.87e-01 | -0.0196 |
| 3930 | LBR | NEOLP-3 | Human | Oral cavity | NEOLP | 3.44e-03 | 1.57e-01 | -0.0191 |
| 3930 | LBR | SYSMH1 | Human | Oral cavity | OSCC | 3.04e-24 | 6.08e-01 | 0.1127 |
| 3930 | LBR | SYSMH2 | Human | Oral cavity | OSCC | 8.20e-10 | 4.20e-01 | 0.2326 |
| 3930 | LBR | SYSMH3 | Human | Oral cavity | OSCC | 3.74e-13 | 3.43e-01 | 0.2442 |
| 3930 | LBR | SYSMH5 | Human | Oral cavity | OSCC | 2.93e-04 | 1.70e-01 | 0.0647 |
| 3930 | LBR | P4_cSCC | Human | Skin | cSCC | 3.37e-07 | 3.73e-01 | -0.00290000000000005 |
| 3930 | LBR | P10_cSCC | Human | Skin | cSCC | 3.72e-20 | 8.98e-01 | 0.1017 |
| 3930 | LBR | male-WTA | Human | Thyroid | PTC | 7.26e-09 | 1.58e-02 | 0.1037 |
| 3930 | LBR | PTC04 | Human | Thyroid | PTC | 3.91e-03 | 7.45e-02 | 0.1927 |
| 3930 | LBR | PTC05 | Human | Thyroid | PTC | 7.36e-05 | 1.68e-01 | 0.2065 |
| 3930 | LBR | PTC06 | Human | Thyroid | PTC | 1.94e-09 | 2.91e-01 | 0.2057 |
| 3930 | LBR | PTC07 | Human | Thyroid | PTC | 6.39e-09 | 1.04e-01 | 0.2044 |
| Page: 1 2 3 4 5 6 |
| Tissue | Expression Dynamics | Abbreviation |
| Esophagus | 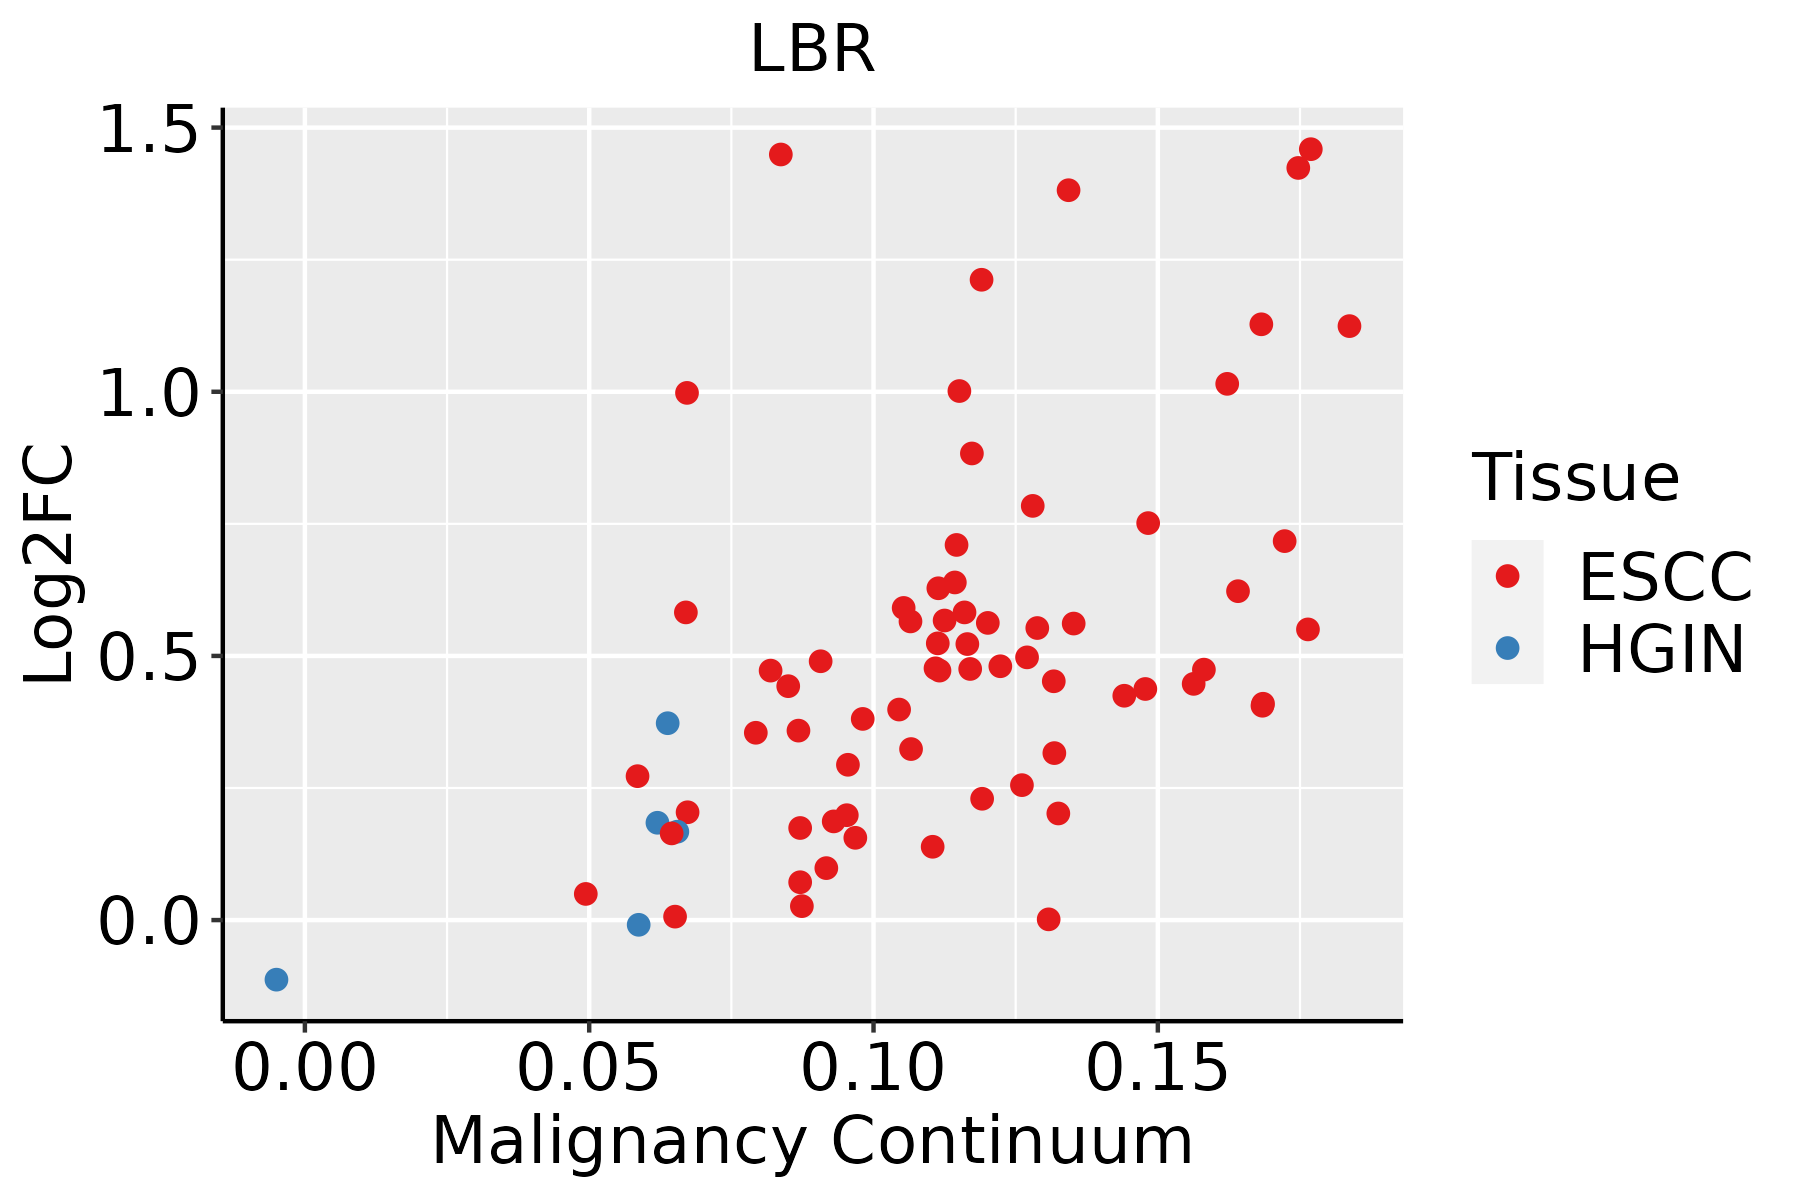 | ESCC: Esophageal squamous cell carcinoma |
| HGIN: High-grade intraepithelial neoplasias | ||
| LGIN: Low-grade intraepithelial neoplasias | ||
| Liver | 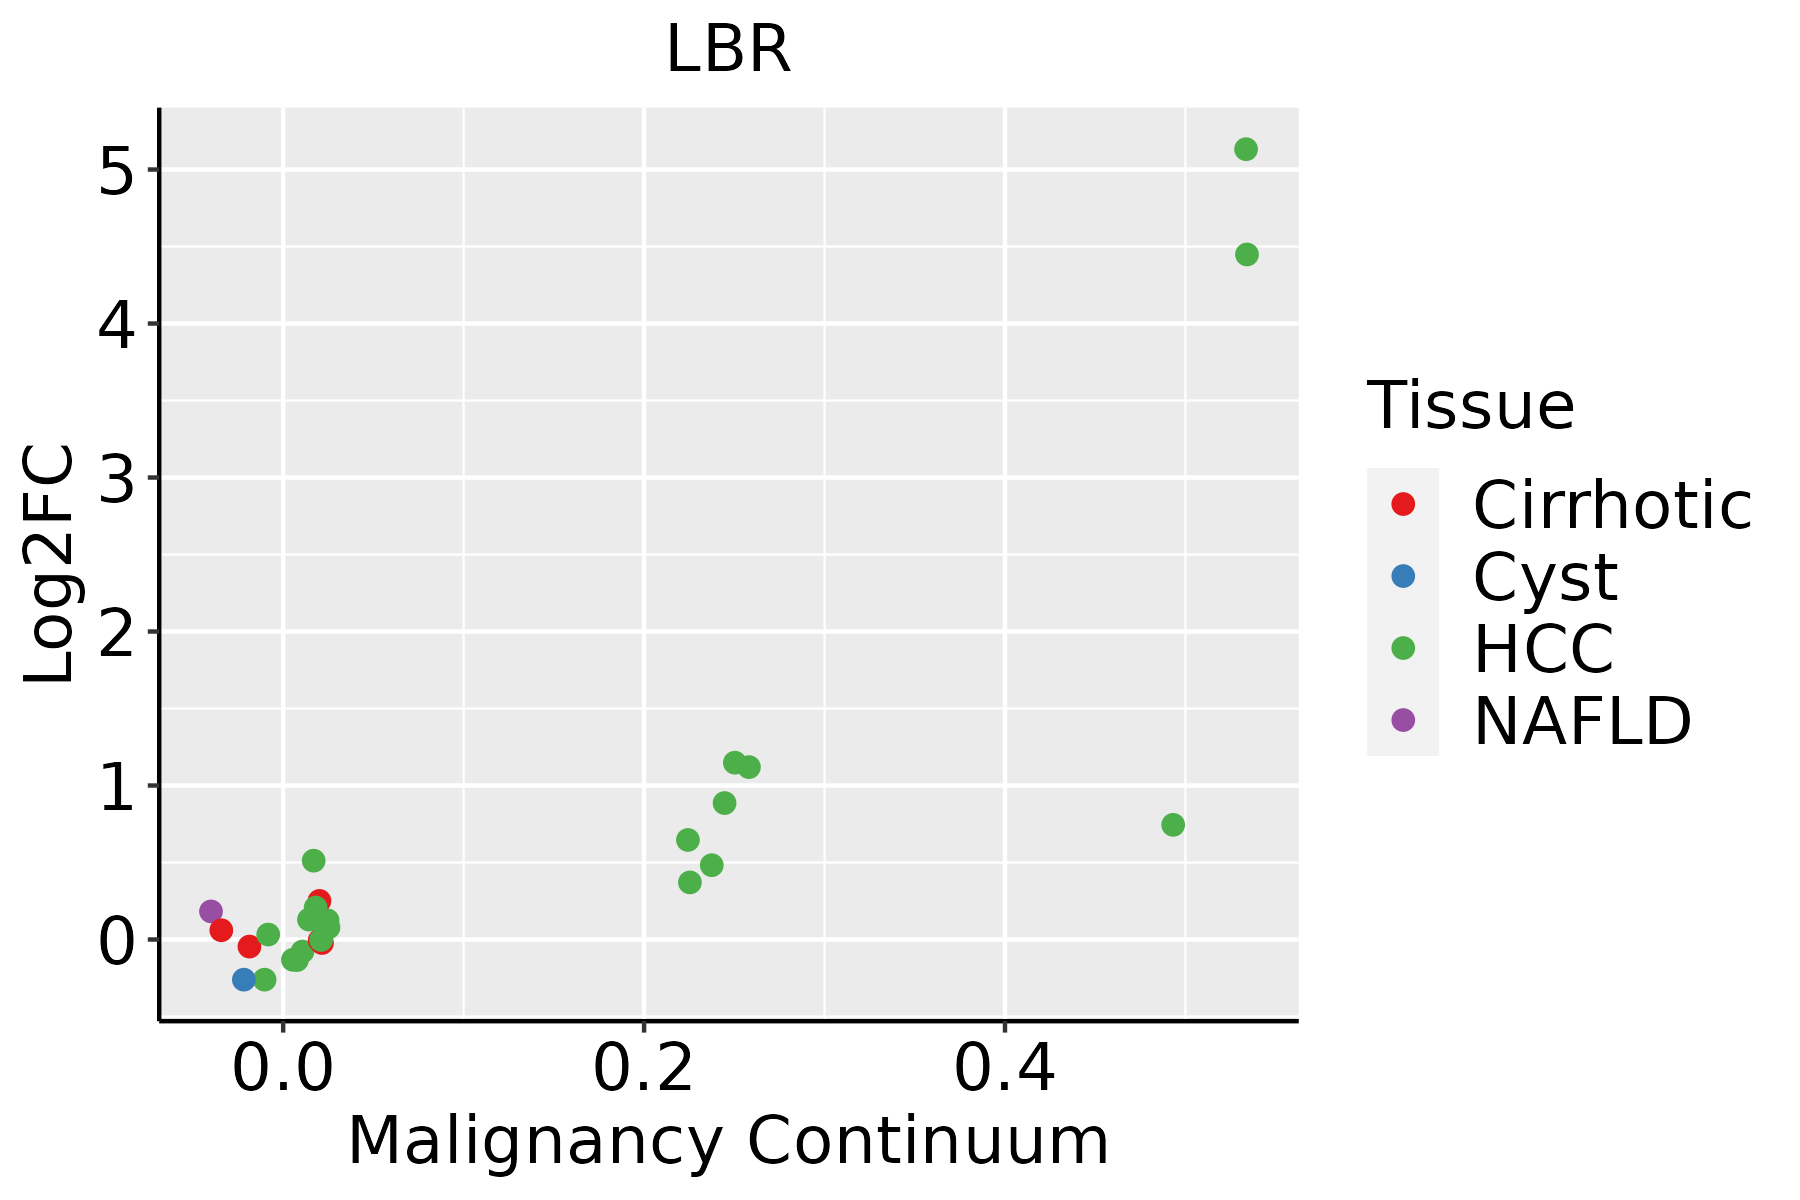 | HCC: Hepatocellular carcinoma |
| NAFLD: Non-alcoholic fatty liver disease | ||
| Oral Cavity | 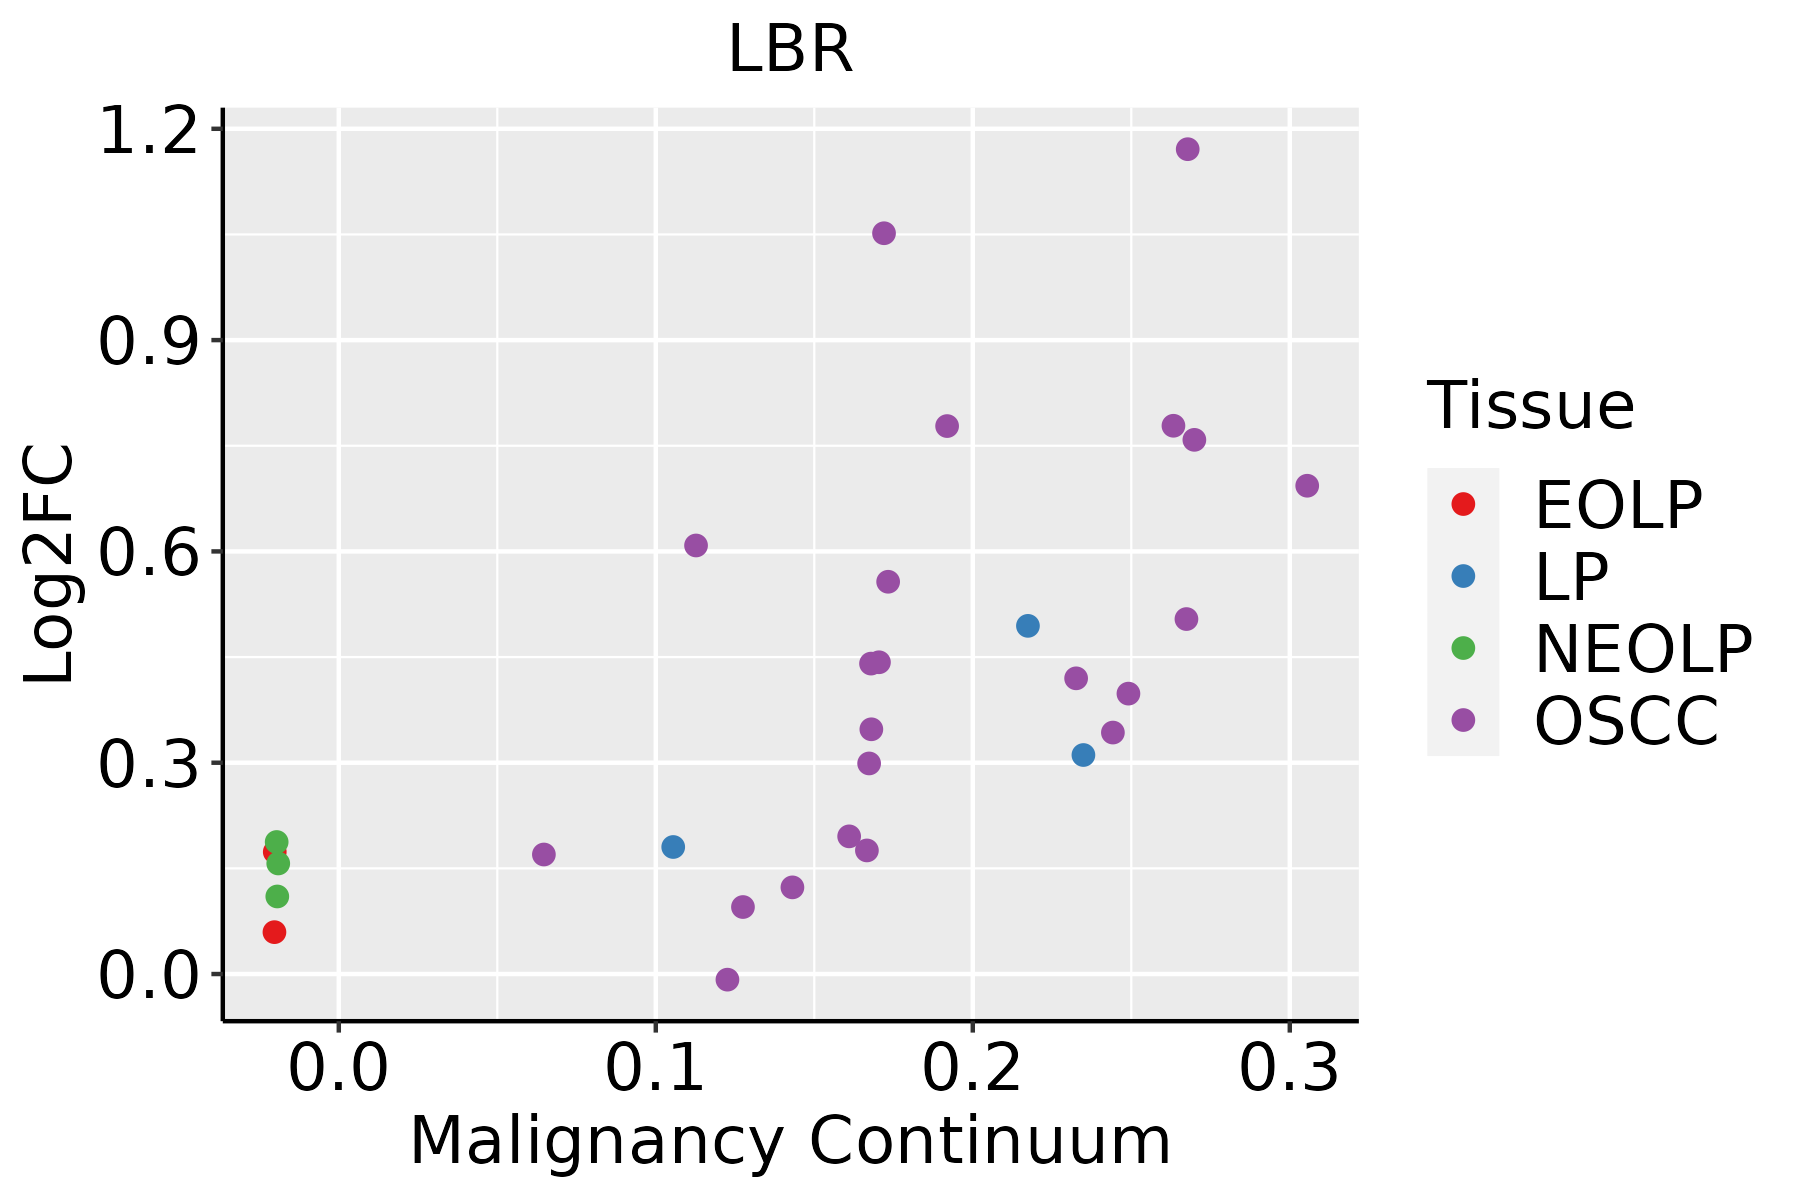 | EOLP: Erosive Oral lichen planus |
| LP: leukoplakia | ||
| NEOLP: Non-erosive oral lichen planus | ||
| OSCC: Oral squamous cell carcinoma | ||
| Skin | 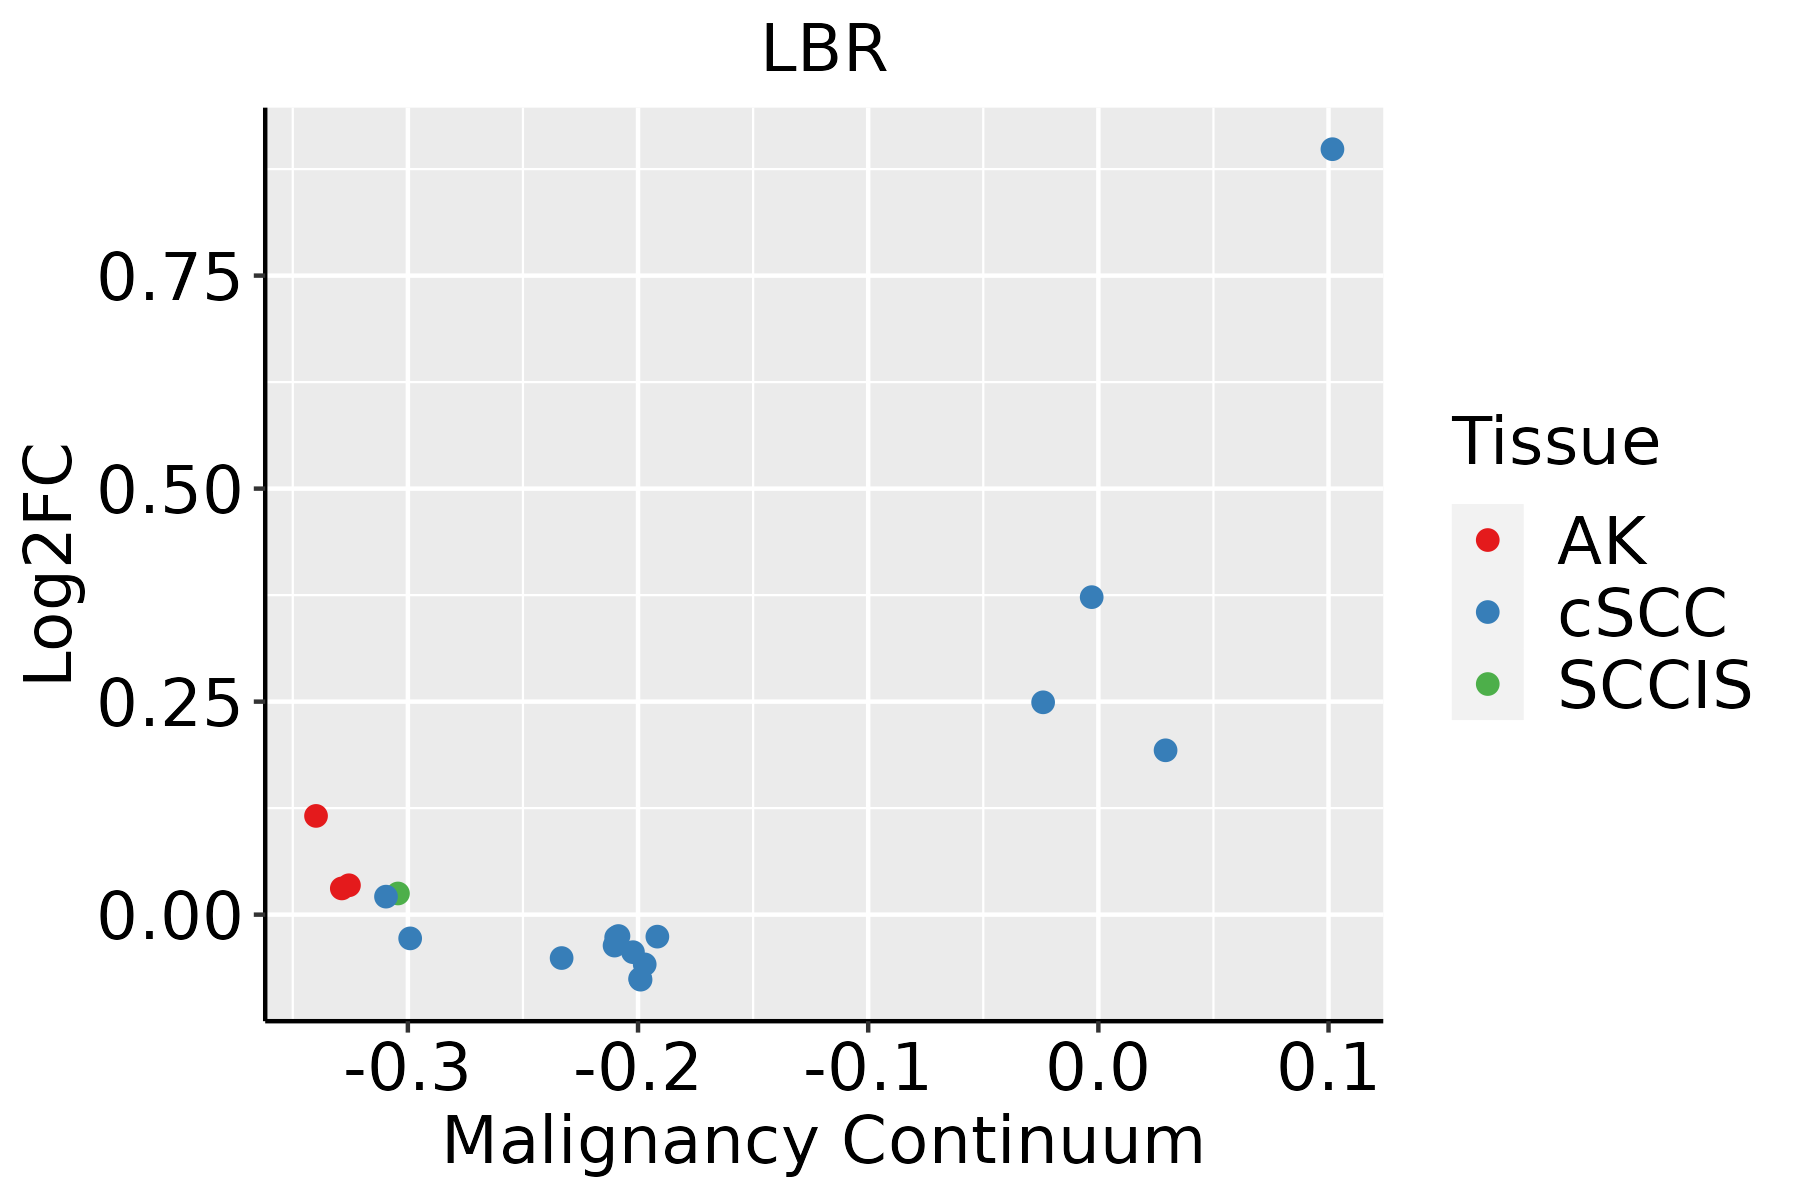 | AK: Actinic keratosis |
| cSCC: Cutaneous squamous cell carcinoma | ||
| SCCIS:squamous cell carcinoma in situ | ||
| Thyroid | 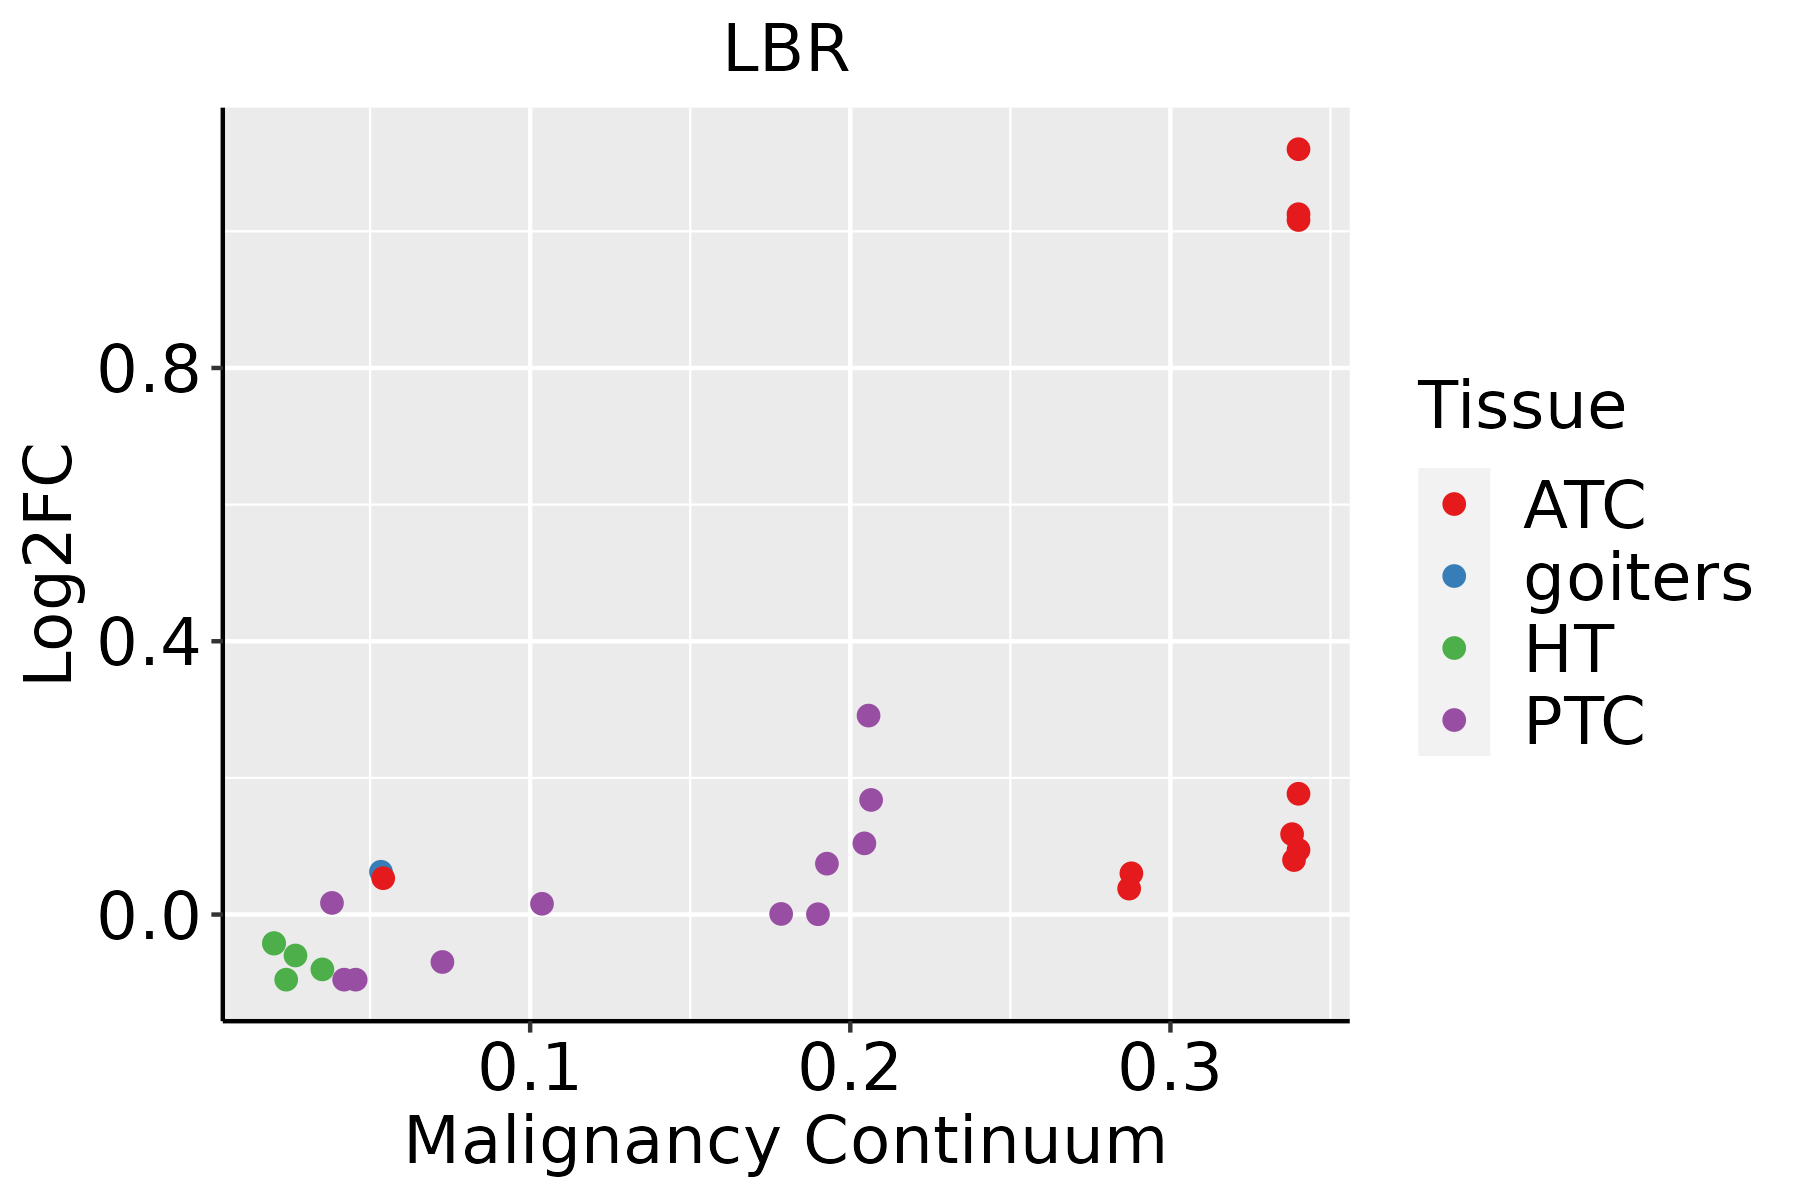 | ATC: Anaplastic thyroid cancer |
| HT: Hashimoto's thyroiditis | ||
| PTC: Papillary thyroid cancer |
| ∗log2FC in expression of this searched gene in stem-like cells from each diseased tissue sample relative to stem-like cells in normal samples in each tissue plotted against the malignancy continuum. Samples are colored based on if they are from different disease stage. |
Top |
Malignant transformation related pathway analysis |
| Find out the enriched GO biological processes and KEGG pathways involved in transition from healthy to precancer to cancer |
| Tissue | Disease Stage | Enriched GO biological Processes |
| Colorectum | AD |  |
| Colorectum | SER |  |
| Colorectum | MSS |  |
| Colorectum | MSI-H |  |
| Colorectum | FAP |  |
| ∗Top 15 enriched GO BP terms are showed in the bar plot of each disease state in each tissue. Each row represents a significant GO biological process which is colored according to the -log10(p.adjust). |
| Page: 1 2 3 4 5 6 7 8 9 |
| GO ID | Tissue | Disease Stage | Description | Gene Ratio | Bg Ratio | pvalue | p.adjust | Count |
| GO:0030099111 | Esophagus | ESCC | myeloid cell differentiation | 232/8552 | 381/18723 | 1.22e-09 | 2.90e-08 | 232 |
| GO:000257317 | Esophagus | ESCC | myeloid leukocyte differentiation | 128/8552 | 208/18723 | 2.75e-06 | 3.15e-05 | 128 |
| GO:00060668 | Esophagus | ESCC | alcohol metabolic process | 202/8552 | 353/18723 | 7.32e-06 | 7.26e-05 | 202 |
| GO:00161263 | Esophagus | ESCC | sterol biosynthetic process | 46/8552 | 64/18723 | 1.91e-05 | 1.67e-04 | 46 |
| GO:00066953 | Esophagus | ESCC | cholesterol biosynthetic process | 41/8552 | 57/18723 | 5.25e-05 | 4.06e-04 | 41 |
| GO:19026533 | Esophagus | ESCC | secondary alcohol biosynthetic process | 41/8552 | 57/18723 | 5.25e-05 | 4.06e-04 | 41 |
| GO:19026524 | Esophagus | ESCC | secondary alcohol metabolic process | 87/8552 | 147/18723 | 6.58e-04 | 3.50e-03 | 87 |
| GO:00461653 | Esophagus | ESCC | alcohol biosynthetic process | 83/8552 | 140/18723 | 8.04e-04 | 4.16e-03 | 83 |
| GO:00066946 | Esophagus | ESCC | steroid biosynthetic process | 98/8552 | 173/18723 | 2.34e-03 | 1.03e-02 | 98 |
| GO:00082034 | Esophagus | ESCC | cholesterol metabolic process | 79/8552 | 137/18723 | 3.11e-03 | 1.29e-02 | 79 |
| GO:00161254 | Esophagus | ESCC | sterol metabolic process | 86/8552 | 152/18723 | 4.37e-03 | 1.73e-02 | 86 |
| GO:19016174 | Esophagus | ESCC | organic hydroxy compound biosynthetic process | 128/8552 | 237/18723 | 5.86e-03 | 2.16e-02 | 128 |
| GO:000820211 | Liver | Cirrhotic | steroid metabolic process | 143/4634 | 319/18723 | 2.79e-15 | 3.18e-13 | 143 |
| GO:19026521 | Liver | Cirrhotic | secondary alcohol metabolic process | 75/4634 | 147/18723 | 5.62e-12 | 3.91e-10 | 75 |
| GO:00082031 | Liver | Cirrhotic | cholesterol metabolic process | 70/4634 | 137/18723 | 2.59e-11 | 1.55e-09 | 70 |
| GO:00161251 | Liver | Cirrhotic | sterol metabolic process | 75/4634 | 152/18723 | 4.54e-11 | 2.61e-09 | 75 |
| GO:000606612 | Liver | Cirrhotic | alcohol metabolic process | 141/4634 | 353/18723 | 1.57e-10 | 8.03e-09 | 141 |
| GO:00066941 | Liver | Cirrhotic | steroid biosynthetic process | 77/4634 | 173/18723 | 1.02e-08 | 3.91e-07 | 77 |
| GO:0016126 | Liver | Cirrhotic | sterol biosynthetic process | 37/4634 | 64/18723 | 1.74e-08 | 6.32e-07 | 37 |
| GO:0006695 | Liver | Cirrhotic | cholesterol biosynthetic process | 34/4634 | 57/18723 | 2.22e-08 | 7.77e-07 | 34 |
| Page: 1 2 3 4 |
| Pathway ID | Tissue | Disease Stage | Description | Gene Ratio | Bg Ratio | pvalue | p.adjust | qvalue | Count |
| hsa001005 | Esophagus | ESCC | Steroid biosynthesis | 18/4205 | 20/8465 | 1.78e-04 | 6.79e-04 | 3.48e-04 | 18 |
| hsa0010012 | Esophagus | ESCC | Steroid biosynthesis | 18/4205 | 20/8465 | 1.78e-04 | 6.79e-04 | 3.48e-04 | 18 |
| hsa00100 | Liver | Cirrhotic | Steroid biosynthesis | 12/2530 | 20/8465 | 4.92e-03 | 1.76e-02 | 1.09e-02 | 12 |
| hsa001001 | Liver | Cirrhotic | Steroid biosynthesis | 12/2530 | 20/8465 | 4.92e-03 | 1.76e-02 | 1.09e-02 | 12 |
| hsa001002 | Liver | HCC | Steroid biosynthesis | 15/4020 | 20/8465 | 1.17e-02 | 2.97e-02 | 1.65e-02 | 15 |
| hsa001003 | Liver | HCC | Steroid biosynthesis | 15/4020 | 20/8465 | 1.17e-02 | 2.97e-02 | 1.65e-02 | 15 |
| hsa001004 | Oral cavity | OSCC | Steroid biosynthesis | 15/3704 | 20/8465 | 4.62e-03 | 1.13e-02 | 5.75e-03 | 15 |
| hsa0010011 | Oral cavity | OSCC | Steroid biosynthesis | 15/3704 | 20/8465 | 4.62e-03 | 1.13e-02 | 5.75e-03 | 15 |
| Page: 1 |
Top |
Cell-cell communication analysis |
| Identification of potential cell-cell interactions between two cell types and their ligand-receptor pairs for different disease states |
| Ligand | Receptor | LRpair | Pathway | Tissue | Disease Stage |
| Page: 1 |
Top |
Single-cell gene regulatory network inference analysis |
| Find out the significant the regulons (TFs) and the target genes of each regulon across cell types for different disease states |
| TF | Cell Type | Tissue | Disease Stage | Target Gene | RSS | Regulon Activity |
| ∗The dot plots of a searched regulon are shown for all cell subpopulations in each disease state of each tissue based on the regulon specific score inferred using pySCENIC and by calculating the average expression. |
| Page: 1 |
Top |
Somatic mutation of malignant transformation related genes |
| Annotation of somatic variants for genes involved in malignant transformation |
| Hugo Symbol | Variant Class | Variant Classification | dbSNP RS | HGVSc | HGVSp | HGVSp Short | SWISSPROT | BIOTYPE | SIFT | PolyPhen | Tumor Sample Barcode | Tissue | Histology | Sex | Age | Stage | Therapy Types | Drugs | Outcome |
| LBR | SNV | Missense_Mutation | c.289T>G | p.Ser97Ala | p.S97A | Q14739 | protein_coding | tolerated(0.17) | benign(0.369) | TCGA-A2-A25D-01 | Breast | breast invasive carcinoma | Female | >=65 | III/IV | Hormone Therapy | tamoxiphen | SD | |
| LBR | SNV | Missense_Mutation | rs750036742 | c.1130G>A | p.Arg377Gln | p.R377Q | Q14739 | protein_coding | deleterious(0.02) | probably_damaging(1) | TCGA-A7-A2KD-01 | Breast | breast invasive carcinoma | Female | <65 | III/IV | Chemotherapy | cytoxan | SD |
| LBR | SNV | Missense_Mutation | c.1112N>A | p.Gly371Asp | p.G371D | Q14739 | protein_coding | deleterious(0.03) | probably_damaging(1) | TCGA-A8-A07R-01 | Breast | breast invasive carcinoma | Female | >=65 | III/IV | Ancillary | zoledronic | SD | |
| LBR | SNV | Missense_Mutation | c.1510N>A | p.Ala504Thr | p.A504T | Q14739 | protein_coding | deleterious(0) | probably_damaging(0.943) | TCGA-AN-A0XP-01 | Breast | breast invasive carcinoma | Female | >=65 | III/IV | Unknown | Unknown | SD | |
| LBR | SNV | Missense_Mutation | novel | c.1047N>C | p.Leu349Phe | p.L349F | Q14739 | protein_coding | tolerated(0.45) | benign(0.006) | TCGA-AO-A0JC-01 | Breast | breast invasive carcinoma | Female | <65 | I/II | Chemotherapy | fluorouracil | SD |
| LBR | SNV | Missense_Mutation | c.259N>T | p.Pro87Ser | p.P87S | Q14739 | protein_coding | tolerated(0.33) | probably_damaging(0.96) | TCGA-BH-A0HY-01 | Breast | breast invasive carcinoma | Female | <65 | I/II | Hormone Therapy | taxotere | CR | |
| LBR | SNV | Missense_Mutation | c.756N>C | p.Glu252Asp | p.E252D | Q14739 | protein_coding | tolerated(1) | benign(0.005) | TCGA-D8-A1XK-01 | Breast | breast invasive carcinoma | Female | <65 | I/II | Chemotherapy | doxorubicine+cyclophosphamide | SD | |
| LBR | insertion | Nonsense_Mutation | novel | c.1092_1093insTATATGTGGGCGCTAAAAAAGTTGATGTCATAGAAGTATAAAG | p.Val365TyrfsTer11 | p.V365Yfs*11 | Q14739 | protein_coding | TCGA-A8-A06X-01 | Breast | breast invasive carcinoma | Female | >=65 | I/II | Unknown | Unknown | SD | ||
| LBR | SNV | Missense_Mutation | c.1414G>A | p.Ala472Thr | p.A472T | Q14739 | protein_coding | tolerated(0.07) | possibly_damaging(0.679) | TCGA-2W-A8YY-01 | Cervix | cervical & endocervical cancer | Female | <65 | I/II | Chemotherapy | cisplatin | CR | |
| LBR | SNV | Missense_Mutation | c.1630N>T | p.Arg544Cys | p.R544C | Q14739 | protein_coding | deleterious(0) | probably_damaging(0.999) | TCGA-IR-A3LA-01 | Cervix | cervical & endocervical cancer | Female | <65 | I/II | Chemotherapy | cisplatin | CR |
| Page: 1 2 3 4 5 6 7 |
Top |
Related drugs of malignant transformation related genes |
| Identification of chemicals and drugs interact with genes involved in malignant transfromation |
| (DGIdb 4.0) |
| Entrez ID | Symbol | Category | Interaction Types | Drug Claim Name | Drug Name | PMIDs |
| Page: 1 |

Copyright 2023-Present -The University of Texas Health Science Center at Houston |