
|
|||||
|
 | |
| |
| |
| |
| |
| |
|
Gene: LAS1L |
Gene summary for LAS1L |
| Gene information | Species | Human | Gene symbol | LAS1L | Gene ID | 81887 |
| Gene name | LAS1 like ribosome biogenesis factor | |
| Gene Alias | Las1 | |
| Cytomap | Xq12 | |
| Gene Type | protein-coding | GO ID | GO:0000460 | UniProtAcc | Q9Y4W2 |
Top |
Malignant transformation analysis |
| Identification of the aberrant gene expression in precancerous and cancerous lesions by comparing the gene expression of stem-like cells in diseased tissues with normal stem cells |
| Entrez ID | Symbol | Replicates | Species | Organ | Tissue | Adj P-value | Log2FC | Malignancy |
| 81887 | LAS1L | C51 | Human | Oral cavity | OSCC | 4.31e-06 | 5.10e-01 | 0.2674 |
| 81887 | LAS1L | C57 | Human | Oral cavity | OSCC | 4.10e-02 | 2.73e-01 | 0.1679 |
| 81887 | LAS1L | C06 | Human | Oral cavity | OSCC | 2.27e-06 | 9.71e-01 | 0.2699 |
| 81887 | LAS1L | C08 | Human | Oral cavity | OSCC | 3.43e-22 | 5.42e-01 | 0.1919 |
| 81887 | LAS1L | LN22 | Human | Oral cavity | OSCC | 1.22e-02 | 5.23e-01 | 0.1733 |
| 81887 | LAS1L | LN46 | Human | Oral cavity | OSCC | 4.17e-08 | 3.70e-01 | 0.1666 |
| 81887 | LAS1L | LP15 | Human | Oral cavity | LP | 1.74e-02 | 5.00e-01 | 0.2174 |
| 81887 | LAS1L | SYSMH2 | Human | Oral cavity | OSCC | 4.71e-09 | 3.42e-01 | 0.2326 |
| 81887 | LAS1L | SYSMH3 | Human | Oral cavity | OSCC | 4.80e-18 | 4.78e-01 | 0.2442 |
| 81887 | LAS1L | SYSMH5 | Human | Oral cavity | OSCC | 1.73e-03 | 2.05e-01 | 0.0647 |
| 81887 | LAS1L | SYSMH6 | Human | Oral cavity | OSCC | 1.22e-02 | 1.27e-01 | 0.1275 |
| 81887 | LAS1L | P1_cSCC | Human | Skin | cSCC | 9.74e-13 | 4.91e-01 | 0.0292 |
| 81887 | LAS1L | P2_cSCC | Human | Skin | cSCC | 3.58e-11 | 3.44e-01 | -0.024 |
| 81887 | LAS1L | P4_cSCC | Human | Skin | cSCC | 9.14e-15 | 5.10e-01 | -0.00290000000000005 |
| 81887 | LAS1L | P10_cSCC | Human | Skin | cSCC | 1.71e-18 | 4.73e-01 | 0.1017 |
| 81887 | LAS1L | male-WTA | Human | Thyroid | PTC | 3.54e-11 | 1.22e-01 | 0.1037 |
| 81887 | LAS1L | PTC01 | Human | Thyroid | PTC | 2.42e-04 | 1.36e-01 | 0.1899 |
| 81887 | LAS1L | PTC04 | Human | Thyroid | PTC | 3.34e-04 | 9.98e-02 | 0.1927 |
| 81887 | LAS1L | PTC05 | Human | Thyroid | PTC | 2.56e-11 | 3.31e-01 | 0.2065 |
| 81887 | LAS1L | PTC06 | Human | Thyroid | PTC | 3.15e-16 | 2.75e-01 | 0.2057 |
| Page: 1 2 3 4 5 6 |
| Tissue | Expression Dynamics | Abbreviation |
| Esophagus |  | ESCC: Esophageal squamous cell carcinoma |
| HGIN: High-grade intraepithelial neoplasias | ||
| LGIN: Low-grade intraepithelial neoplasias | ||
| Liver | 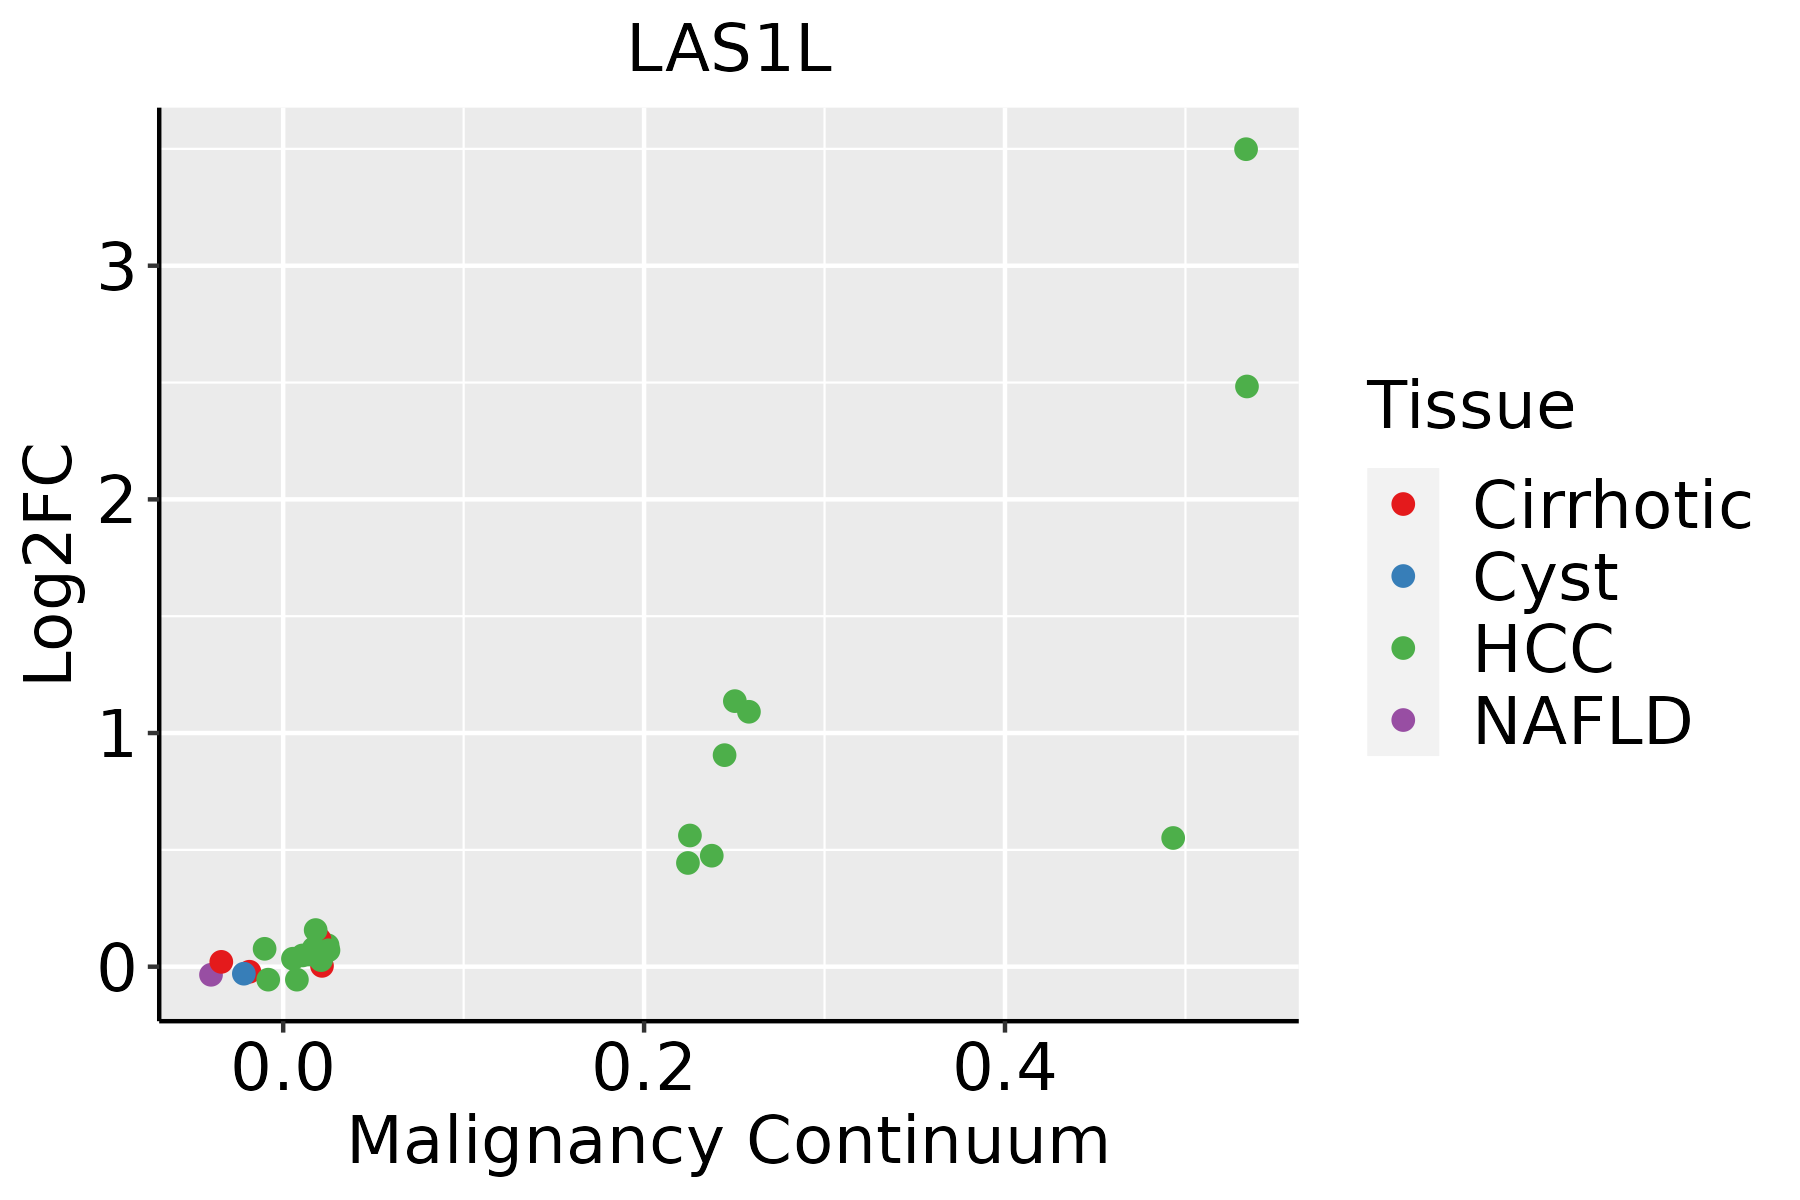 | HCC: Hepatocellular carcinoma |
| NAFLD: Non-alcoholic fatty liver disease | ||
| Oral Cavity |  | EOLP: Erosive Oral lichen planus |
| LP: leukoplakia | ||
| NEOLP: Non-erosive oral lichen planus | ||
| OSCC: Oral squamous cell carcinoma | ||
| Skin | 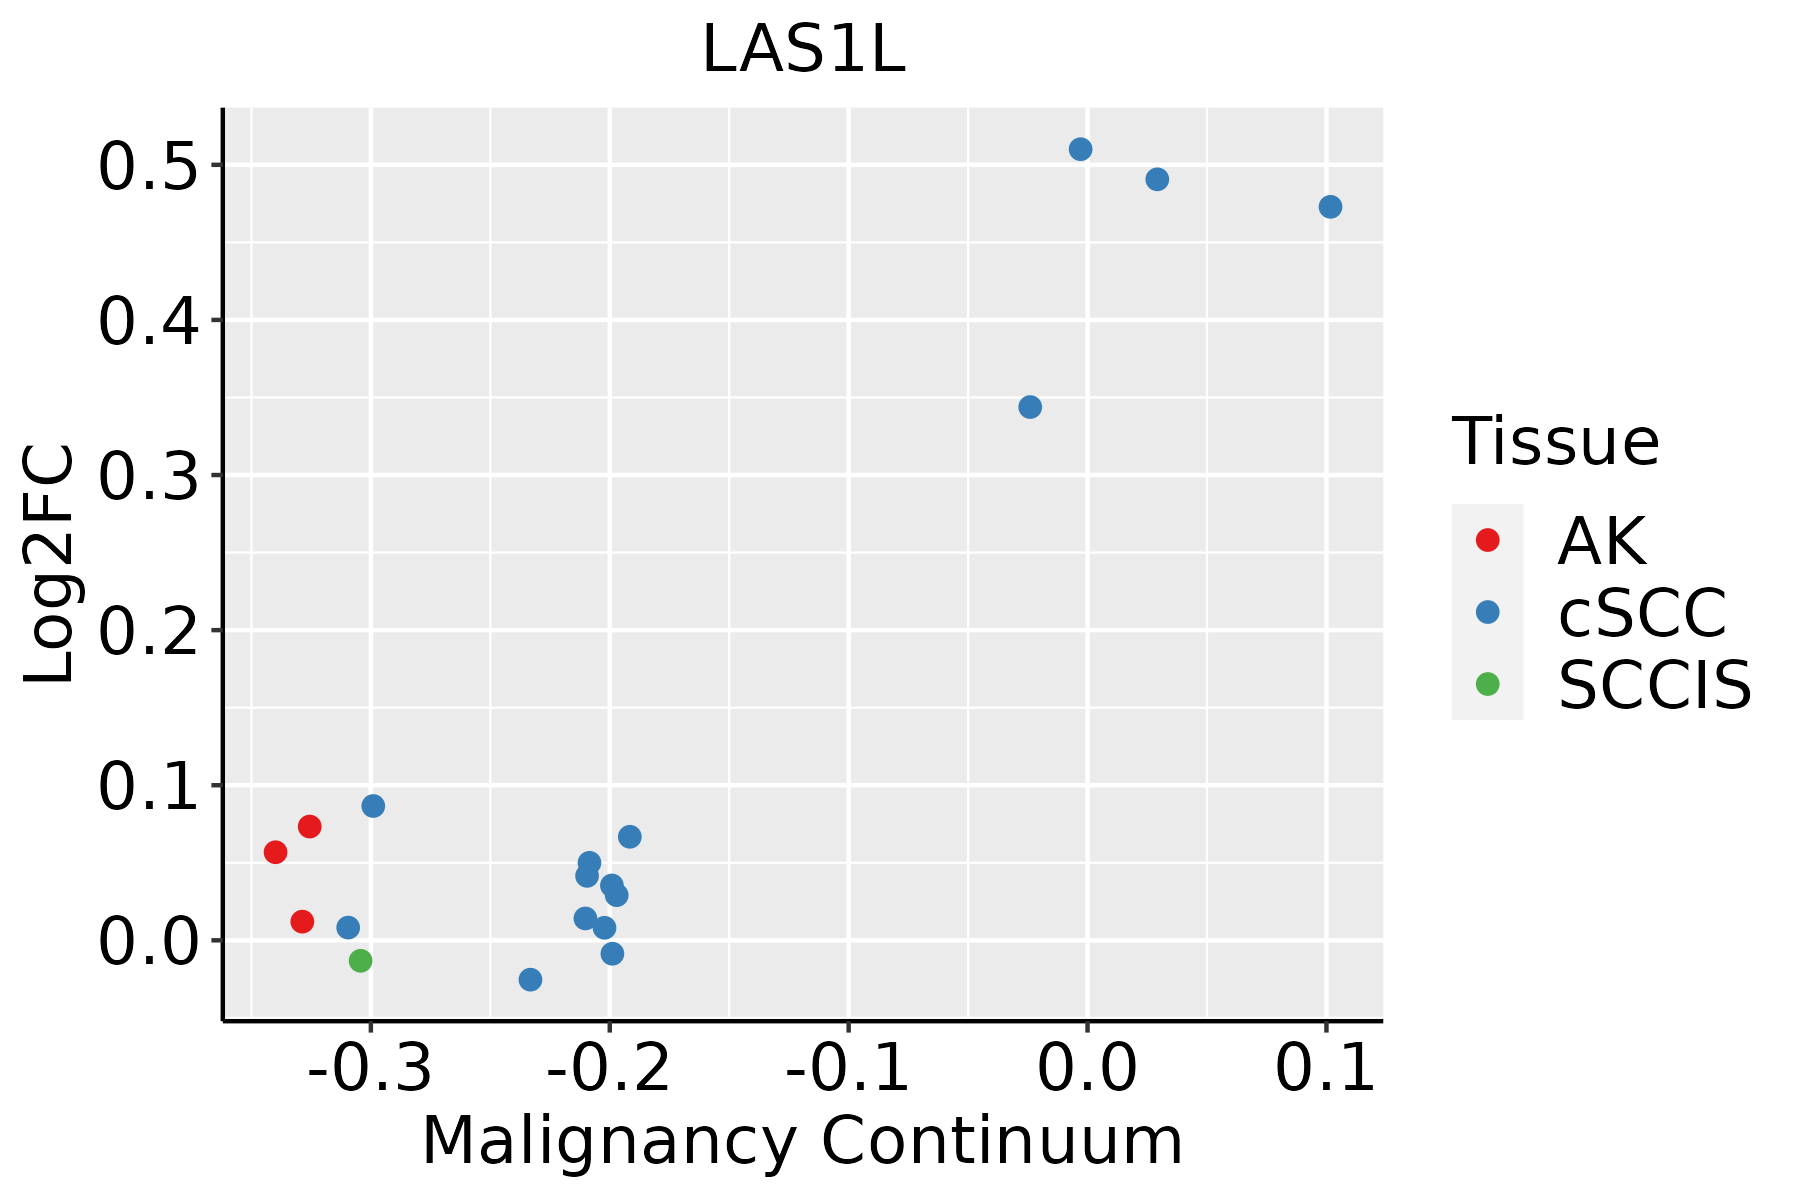 | AK: Actinic keratosis |
| cSCC: Cutaneous squamous cell carcinoma | ||
| SCCIS:squamous cell carcinoma in situ | ||
| Thyroid |  | ATC: Anaplastic thyroid cancer |
| HT: Hashimoto's thyroiditis | ||
| PTC: Papillary thyroid cancer |
| ∗log2FC in expression of this searched gene in stem-like cells from each diseased tissue sample relative to stem-like cells in normal samples in each tissue plotted against the malignancy continuum. Samples are colored based on if they are from different disease stage. |
Top |
Malignant transformation related pathway analysis |
| Find out the enriched GO biological processes and KEGG pathways involved in transition from healthy to precancer to cancer |
| Tissue | Disease Stage | Enriched GO biological Processes |
| Colorectum | AD |  |
| Colorectum | SER |  |
| Colorectum | MSS |  |
| Colorectum | MSI-H |  |
| Colorectum | FAP |  |
| ∗Top 15 enriched GO BP terms are showed in the bar plot of each disease state in each tissue. Each row represents a significant GO biological process which is colored according to the -log10(p.adjust). |
| Page: 1 2 3 4 5 6 7 8 9 |
| GO ID | Tissue | Disease Stage | Description | Gene Ratio | Bg Ratio | pvalue | p.adjust | Count |
| GO:0022613111 | Esophagus | ESCC | ribonucleoprotein complex biogenesis | 365/8552 | 463/18723 | 1.74e-49 | 1.11e-45 | 365 |
| GO:0042254111 | Esophagus | ESCC | ribosome biogenesis | 252/8552 | 299/18723 | 3.27e-44 | 1.04e-40 | 252 |
| GO:003447015 | Esophagus | ESCC | ncRNA processing | 300/8552 | 395/18723 | 3.09e-35 | 3.26e-32 | 300 |
| GO:0016072110 | Esophagus | ESCC | rRNA metabolic process | 197/8552 | 236/18723 | 1.31e-33 | 1.18e-30 | 197 |
| GO:0006364110 | Esophagus | ESCC | rRNA processing | 189/8552 | 225/18723 | 4.88e-33 | 3.87e-30 | 189 |
| GO:003466012 | Esophagus | ESCC | ncRNA metabolic process | 346/8552 | 485/18723 | 4.35e-31 | 2.51e-28 | 346 |
| GO:0042273111 | Esophagus | ESCC | ribosomal large subunit biogenesis | 65/8552 | 72/18723 | 1.53e-15 | 9.82e-14 | 65 |
| GO:000047016 | Esophagus | ESCC | maturation of LSU-rRNA | 27/8552 | 28/18723 | 9.94e-09 | 2.00e-07 | 27 |
| GO:00903053 | Esophagus | ESCC | nucleic acid phosphodiester bond hydrolysis | 163/8552 | 261/18723 | 3.07e-08 | 5.73e-07 | 163 |
| GO:00004603 | Esophagus | ESCC | maturation of 5.8S rRNA | 30/8552 | 35/18723 | 1.07e-06 | 1.34e-05 | 30 |
| GO:002261312 | Liver | Cirrhotic | ribonucleoprotein complex biogenesis | 231/4634 | 463/18723 | 3.28e-32 | 6.86e-29 | 231 |
| GO:004225412 | Liver | Cirrhotic | ribosome biogenesis | 154/4634 | 299/18723 | 1.18e-23 | 6.72e-21 | 154 |
| GO:000636412 | Liver | Cirrhotic | rRNA processing | 115/4634 | 225/18723 | 1.12e-17 | 1.64e-15 | 115 |
| GO:00160724 | Liver | Cirrhotic | rRNA metabolic process | 119/4634 | 236/18723 | 1.19e-17 | 1.70e-15 | 119 |
| GO:004227312 | Liver | Cirrhotic | ribosomal large subunit biogenesis | 47/4634 | 72/18723 | 4.20e-13 | 3.29e-11 | 47 |
| GO:00344701 | Liver | Cirrhotic | ncRNA processing | 158/4634 | 395/18723 | 1.09e-11 | 6.96e-10 | 158 |
| GO:00346603 | Liver | Cirrhotic | ncRNA metabolic process | 173/4634 | 485/18723 | 3.64e-08 | 1.21e-06 | 173 |
| GO:00004702 | Liver | Cirrhotic | maturation of LSU-rRNA | 19/4634 | 28/18723 | 1.84e-06 | 3.48e-05 | 19 |
| GO:0000460 | Liver | Cirrhotic | maturation of 5.8S rRNA | 17/4634 | 35/18723 | 1.93e-03 | 1.21e-02 | 17 |
| GO:002261322 | Liver | HCC | ribonucleoprotein complex biogenesis | 355/7958 | 463/18723 | 7.76e-52 | 4.92e-48 | 355 |
| Page: 1 2 3 4 |
| Pathway ID | Tissue | Disease Stage | Description | Gene Ratio | Bg Ratio | pvalue | p.adjust | qvalue | Count |
| Page: 1 |
Top |
Cell-cell communication analysis |
| Identification of potential cell-cell interactions between two cell types and their ligand-receptor pairs for different disease states |
| Ligand | Receptor | LRpair | Pathway | Tissue | Disease Stage |
| Page: 1 |
Top |
Single-cell gene regulatory network inference analysis |
| Find out the significant the regulons (TFs) and the target genes of each regulon across cell types for different disease states |
| TF | Cell Type | Tissue | Disease Stage | Target Gene | RSS | Regulon Activity |
| LAS1L | PERI | Cervix | ADJ | KRT18,NRN1,HIST1H4C, etc. | 2.36e-01 |  |
| LAS1L | MYOFIB | Cervix | CC | KRT18,NRN1,HIST1H4C, etc. | 3.18e-01 |  |
| LAS1L | MYOFIB | Cervix | HSIL_HPV | KRT18,NRN1,HIST1H4C, etc. | 1.12e-01 |  |
| LAS1L | PVA | Pancreas | ADJ | CRYBG3,CARD11,CSNK2A2, etc. | 2.21e-02 |  |
| LAS1L | MSC | Pancreas | ADJ | CRYBG3,CARD11,CSNK2A2, etc. | 0.00e+00 | |
| LAS1L | INCAF | Pancreas | ADJ | CRYBG3,CARD11,CSNK2A2, etc. | 0.00e+00 | |
| LAS1L | CAF | Pancreas | ADJ | CRYBG3,CARD11,CSNK2A2, etc. | 0.00e+00 | |
| LAS1L | FIB | Pancreas | ADJ | CRYBG3,CARD11,CSNK2A2, etc. | 0.00e+00 | |
| LAS1L | PVA | Pancreas | PanIN | CRYBG3,CARD11,CSNK2A2, etc. | 6.16e-02 |  |
| ∗The dot plots of a searched regulon are shown for all cell subpopulations in each disease state of each tissue based on the regulon specific score inferred using pySCENIC and by calculating the average expression. |
| Page: 1 |
Top |
Somatic mutation of malignant transformation related genes |
| Annotation of somatic variants for genes involved in malignant transformation |
| Hugo Symbol | Variant Class | Variant Classification | dbSNP RS | HGVSc | HGVSp | HGVSp Short | SWISSPROT | BIOTYPE | SIFT | PolyPhen | Tumor Sample Barcode | Tissue | Histology | Sex | Age | Stage | Therapy Types | Drugs | Outcome |
| LAS1L | SNV | Missense_Mutation | c.1945N>C | p.Thr649Pro | p.T649P | Q9Y4W2 | protein_coding | tolerated(0.24) | benign(0.146) | TCGA-A1-A0SO-01 | Breast | breast invasive carcinoma | Female | >=65 | I/II | Chemotherapy | SD | ||
| LAS1L | SNV | Missense_Mutation | rs769442653 | c.743N>T | p.Gly248Val | p.G248V | Q9Y4W2 | protein_coding | tolerated(0.2) | benign(0.003) | TCGA-A8-A08C-01 | Breast | breast invasive carcinoma | Female | >=65 | I/II | Chemotherapy | 5-fluorouracil | CR |
| LAS1L | SNV | Missense_Mutation | novel | c.1370N>T | p.Ser457Phe | p.S457F | Q9Y4W2 | protein_coding | deleterious(0.02) | benign(0.365) | TCGA-AC-A5XS-01 | Breast | breast invasive carcinoma | Female | >=65 | I/II | Hormone Therapy | femara | SD |
| LAS1L | SNV | Missense_Mutation | novel | c.2015N>T | p.Thr672Ile | p.T672I | Q9Y4W2 | protein_coding | tolerated(0.37) | benign(0.005) | TCGA-AN-A0FL-01 | Breast | breast invasive carcinoma | Female | <65 | I/II | Unknown | Unknown | SD |
| LAS1L | SNV | Missense_Mutation | c.1814N>C | p.Arg605Thr | p.R605T | Q9Y4W2 | protein_coding | tolerated(0.19) | benign(0.012) | TCGA-AO-A03O-01 | Breast | breast invasive carcinoma | Female | >=65 | I/II | Chemotherapy | doxorubicin | SD | |
| LAS1L | SNV | Missense_Mutation | novel | c.206N>T | p.Ala69Val | p.A69V | Q9Y4W2 | protein_coding | deleterious(0) | possibly_damaging(0.819) | TCGA-B6-A0IB-01 | Breast | breast invasive carcinoma | Female | <65 | III/IV | Unknown | Unknown | PD |
| LAS1L | SNV | Missense_Mutation | c.2065N>T | p.Thr689Ser | p.T689S | Q9Y4W2 | protein_coding | tolerated(0.69) | benign(0) | TCGA-BH-A0AZ-01 | Breast | breast invasive carcinoma | Female | <65 | III/IV | Chemotherapy | doxorubicin | CR | |
| LAS1L | SNV | Missense_Mutation | c.608G>A | p.Arg203Lys | p.R203K | Q9Y4W2 | protein_coding | tolerated(0.62) | benign(0) | TCGA-BH-A0HF-01 | Breast | breast invasive carcinoma | Female | >=65 | I/II | Hormone Therapy | arimidex | SD | |
| LAS1L | SNV | Missense_Mutation | novel | c.206N>T | p.Ala69Val | p.A69V | Q9Y4W2 | protein_coding | deleterious(0) | possibly_damaging(0.819) | TCGA-E9-A22B-01 | Breast | breast invasive carcinoma | Female | >=65 | I/II | Hormone Therapy | tamoxiphen | SD |
| LAS1L | SNV | Missense_Mutation | rs201107712 | c.1933N>A | p.Val645Met | p.V645M | Q9Y4W2 | protein_coding | deleterious(0.01) | probably_damaging(0.944) | TCGA-2W-A8YY-01 | Cervix | cervical & endocervical cancer | Female | <65 | I/II | Chemotherapy | cisplatin | CR |
| Page: 1 2 3 4 5 6 7 8 9 |
Top |
Related drugs of malignant transformation related genes |
| Identification of chemicals and drugs interact with genes involved in malignant transfromation |
| (DGIdb 4.0) |
| Entrez ID | Symbol | Category | Interaction Types | Drug Claim Name | Drug Name | PMIDs |
| Page: 1 |

Copyright 2023-Present -The University of Texas Health Science Center at Houston |