
|
|||||
|
 | |
| |
| |
| |
| |
| |
|
Gene: LAMTOR5 |
Gene summary for LAMTOR5 |
| Gene information | Species | Human | Gene symbol | LAMTOR5 | Gene ID | 10542 |
| Gene name | late endosomal/lysosomal adaptor, MAPK and MTOR activator 5 | |
| Gene Alias | HBXIP | |
| Cytomap | 1p13.3 | |
| Gene Type | protein-coding | GO ID | GO:0001101 | UniProtAcc | A0A0C4DGV4 |
Top |
Malignant transformation analysis |
| Identification of the aberrant gene expression in precancerous and cancerous lesions by comparing the gene expression of stem-like cells in diseased tissues with normal stem cells |
| Entrez ID | Symbol | Replicates | Species | Organ | Tissue | Adj P-value | Log2FC | Malignancy |
| 10542 | LAMTOR5 | P57T-E | Human | Esophagus | ESCC | 2.23e-21 | 5.73e-01 | 0.0926 |
| 10542 | LAMTOR5 | P61T-E | Human | Esophagus | ESCC | 4.91e-18 | 7.13e-01 | 0.099 |
| 10542 | LAMTOR5 | P62T-E | Human | Esophagus | ESCC | 8.19e-78 | 1.46e+00 | 0.1302 |
| 10542 | LAMTOR5 | P65T-E | Human | Esophagus | ESCC | 1.02e-36 | 8.45e-01 | 0.0978 |
| 10542 | LAMTOR5 | P74T-E | Human | Esophagus | ESCC | 4.00e-47 | 1.76e+00 | 0.1479 |
| 10542 | LAMTOR5 | P75T-E | Human | Esophagus | ESCC | 4.60e-59 | 1.58e+00 | 0.1125 |
| 10542 | LAMTOR5 | P76T-E | Human | Esophagus | ESCC | 6.49e-57 | 1.38e+00 | 0.1207 |
| 10542 | LAMTOR5 | P79T-E | Human | Esophagus | ESCC | 1.31e-41 | 1.13e+00 | 0.1154 |
| 10542 | LAMTOR5 | P80T-E | Human | Esophagus | ESCC | 2.54e-56 | 1.99e+00 | 0.155 |
| 10542 | LAMTOR5 | P82T-E | Human | Esophagus | ESCC | 9.47e-12 | 1.11e+00 | 0.1072 |
| 10542 | LAMTOR5 | P83T-E | Human | Esophagus | ESCC | 2.63e-46 | 1.75e+00 | 0.1738 |
| 10542 | LAMTOR5 | P84T-E | Human | Esophagus | ESCC | 1.54e-10 | 1.16e+00 | 0.0933 |
| 10542 | LAMTOR5 | P89T-E | Human | Esophagus | ESCC | 1.15e-23 | 1.83e+00 | 0.1752 |
| 10542 | LAMTOR5 | P91T-E | Human | Esophagus | ESCC | 2.13e-19 | 2.30e+00 | 0.1828 |
| 10542 | LAMTOR5 | P94T-E | Human | Esophagus | ESCC | 2.98e-03 | 1.13e+00 | 0.0879 |
| 10542 | LAMTOR5 | P107T-E | Human | Esophagus | ESCC | 7.00e-34 | 1.06e+00 | 0.171 |
| 10542 | LAMTOR5 | P126T-E | Human | Esophagus | ESCC | 3.34e-13 | 1.35e+00 | 0.1125 |
| 10542 | LAMTOR5 | P127T-E | Human | Esophagus | ESCC | 1.42e-57 | 1.16e+00 | 0.0826 |
| 10542 | LAMTOR5 | P128T-E | Human | Esophagus | ESCC | 4.31e-57 | 2.29e+00 | 0.1241 |
| 10542 | LAMTOR5 | P130T-E | Human | Esophagus | ESCC | 2.90e-79 | 2.34e+00 | 0.1676 |
| Page: 1 2 3 4 5 6 7 8 9 10 11 |
| Tissue | Expression Dynamics | Abbreviation |
| Cervix |  | CC: Cervix cancer |
| HSIL_HPV: HPV-infected high-grade squamous intraepithelial lesions | ||
| N_HPV: HPV-infected normal cervix | ||
| Colorectum (GSE201348) |  | FAP: Familial adenomatous polyposis |
| CRC: Colorectal cancer | ||
| Colorectum (HTA11) |  | AD: Adenomas |
| SER: Sessile serrated lesions | ||
| MSI-H: Microsatellite-high colorectal cancer | ||
| MSS: Microsatellite stable colorectal cancer | ||
| Endometrium | 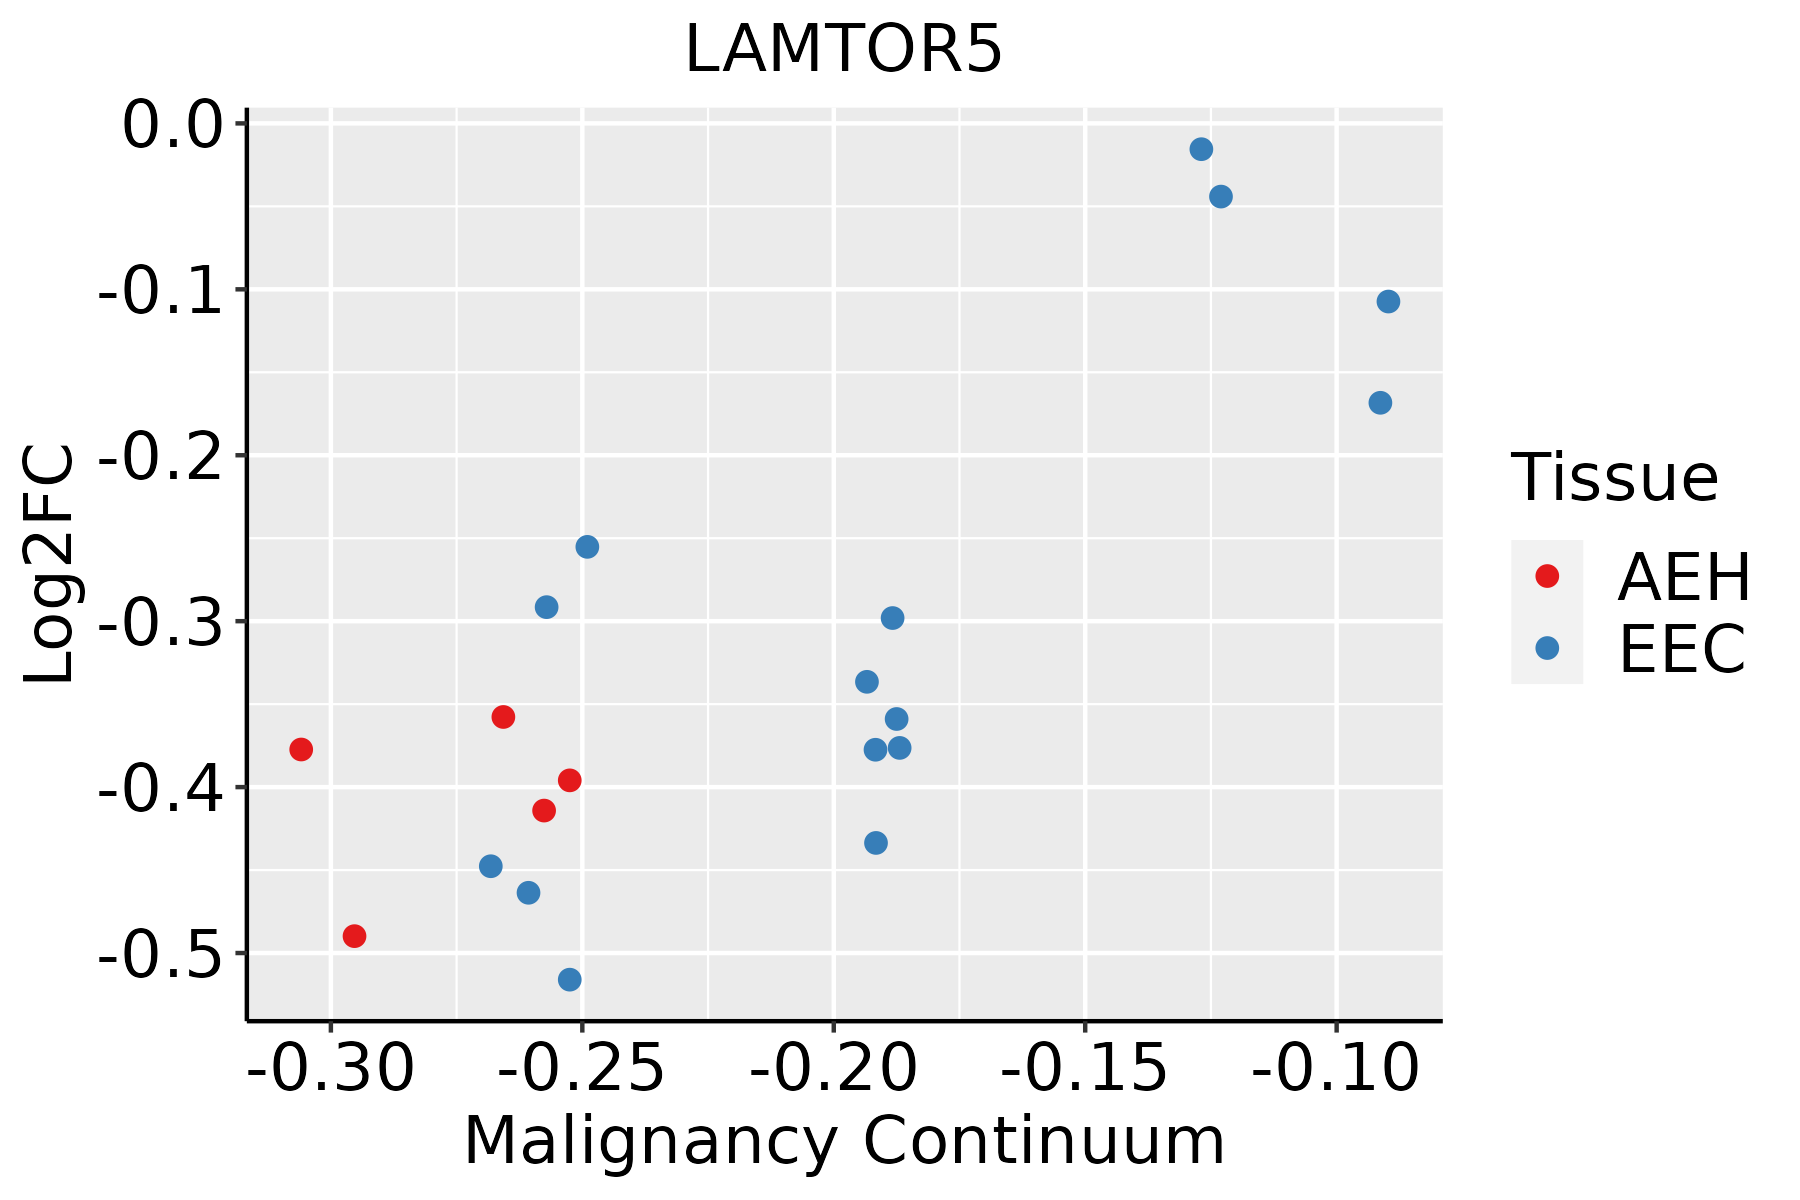 | AEH: Atypical endometrial hyperplasia |
| EEC: Endometrioid Cancer | ||
| Esophagus | 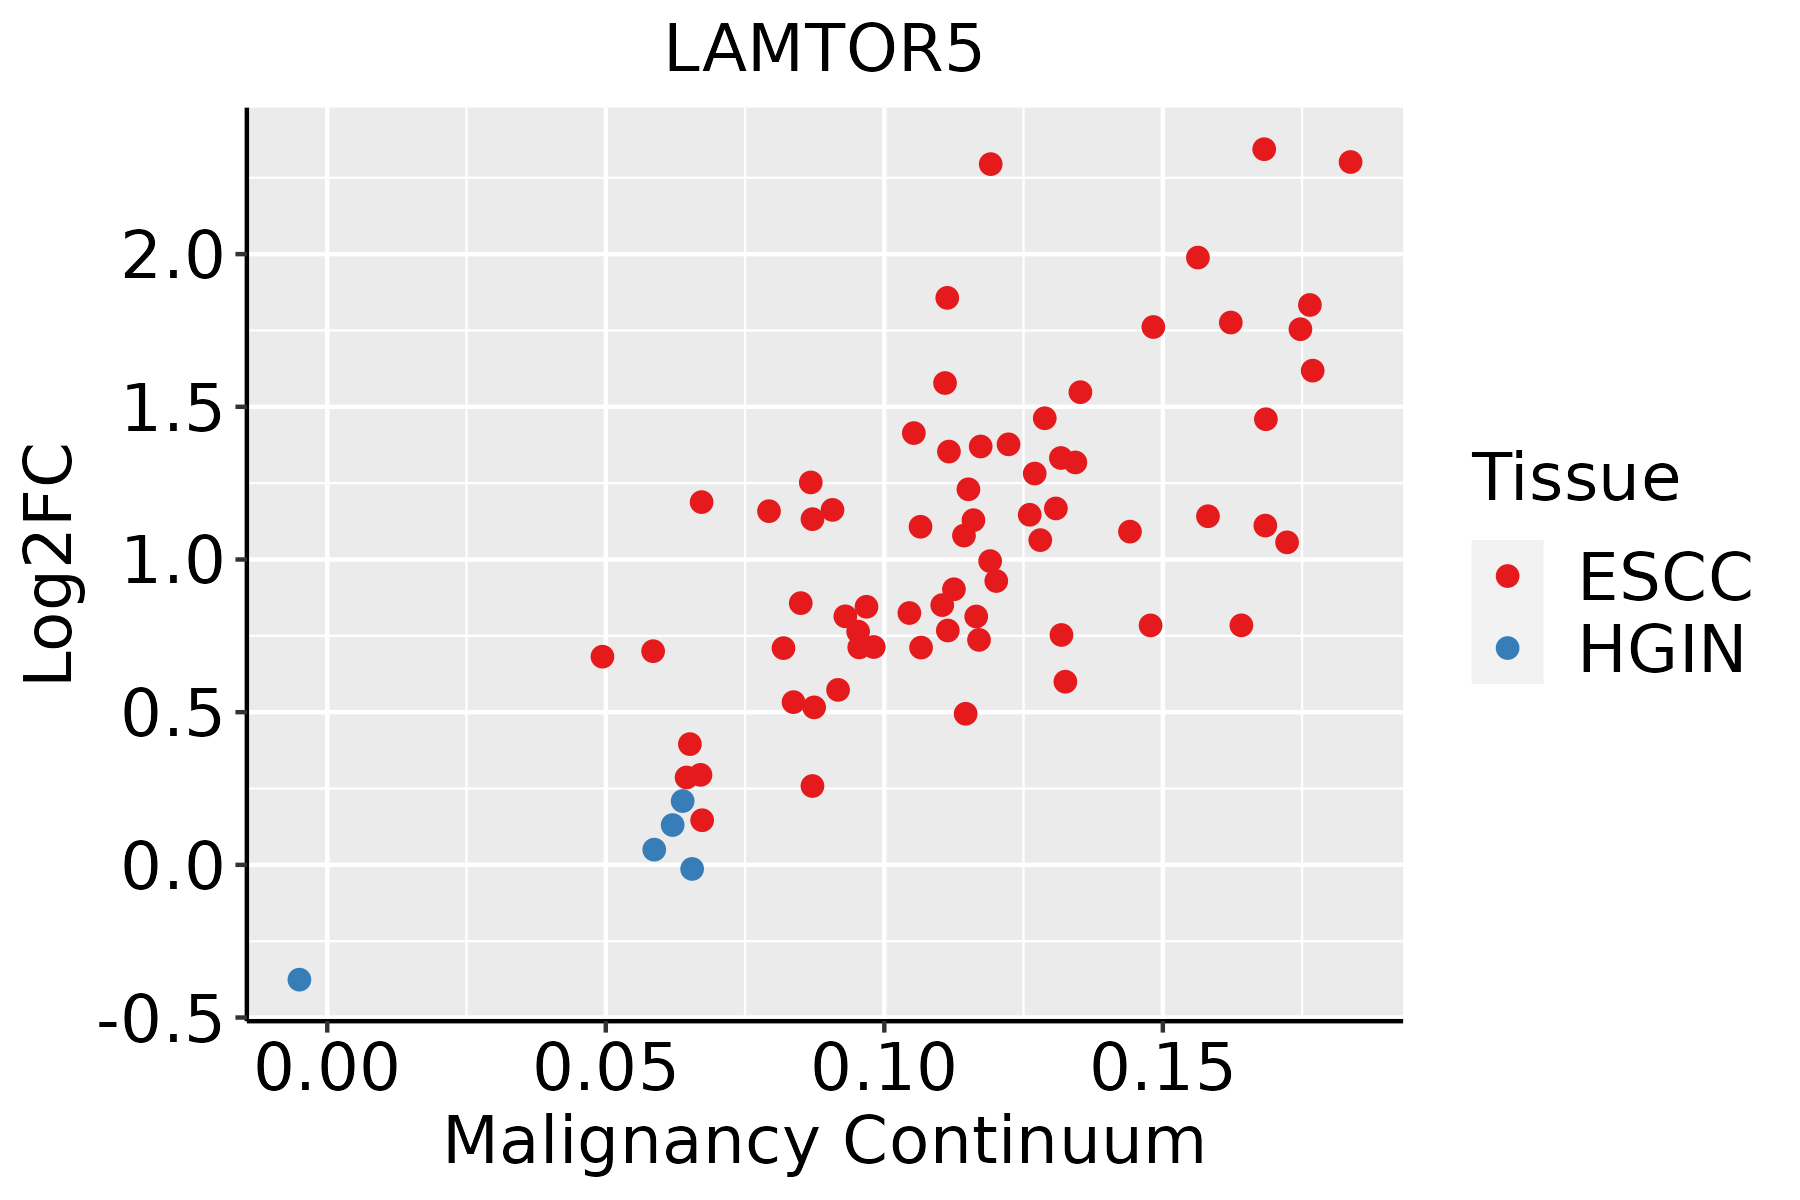 | ESCC: Esophageal squamous cell carcinoma |
| HGIN: High-grade intraepithelial neoplasias | ||
| LGIN: Low-grade intraepithelial neoplasias | ||
| Liver | 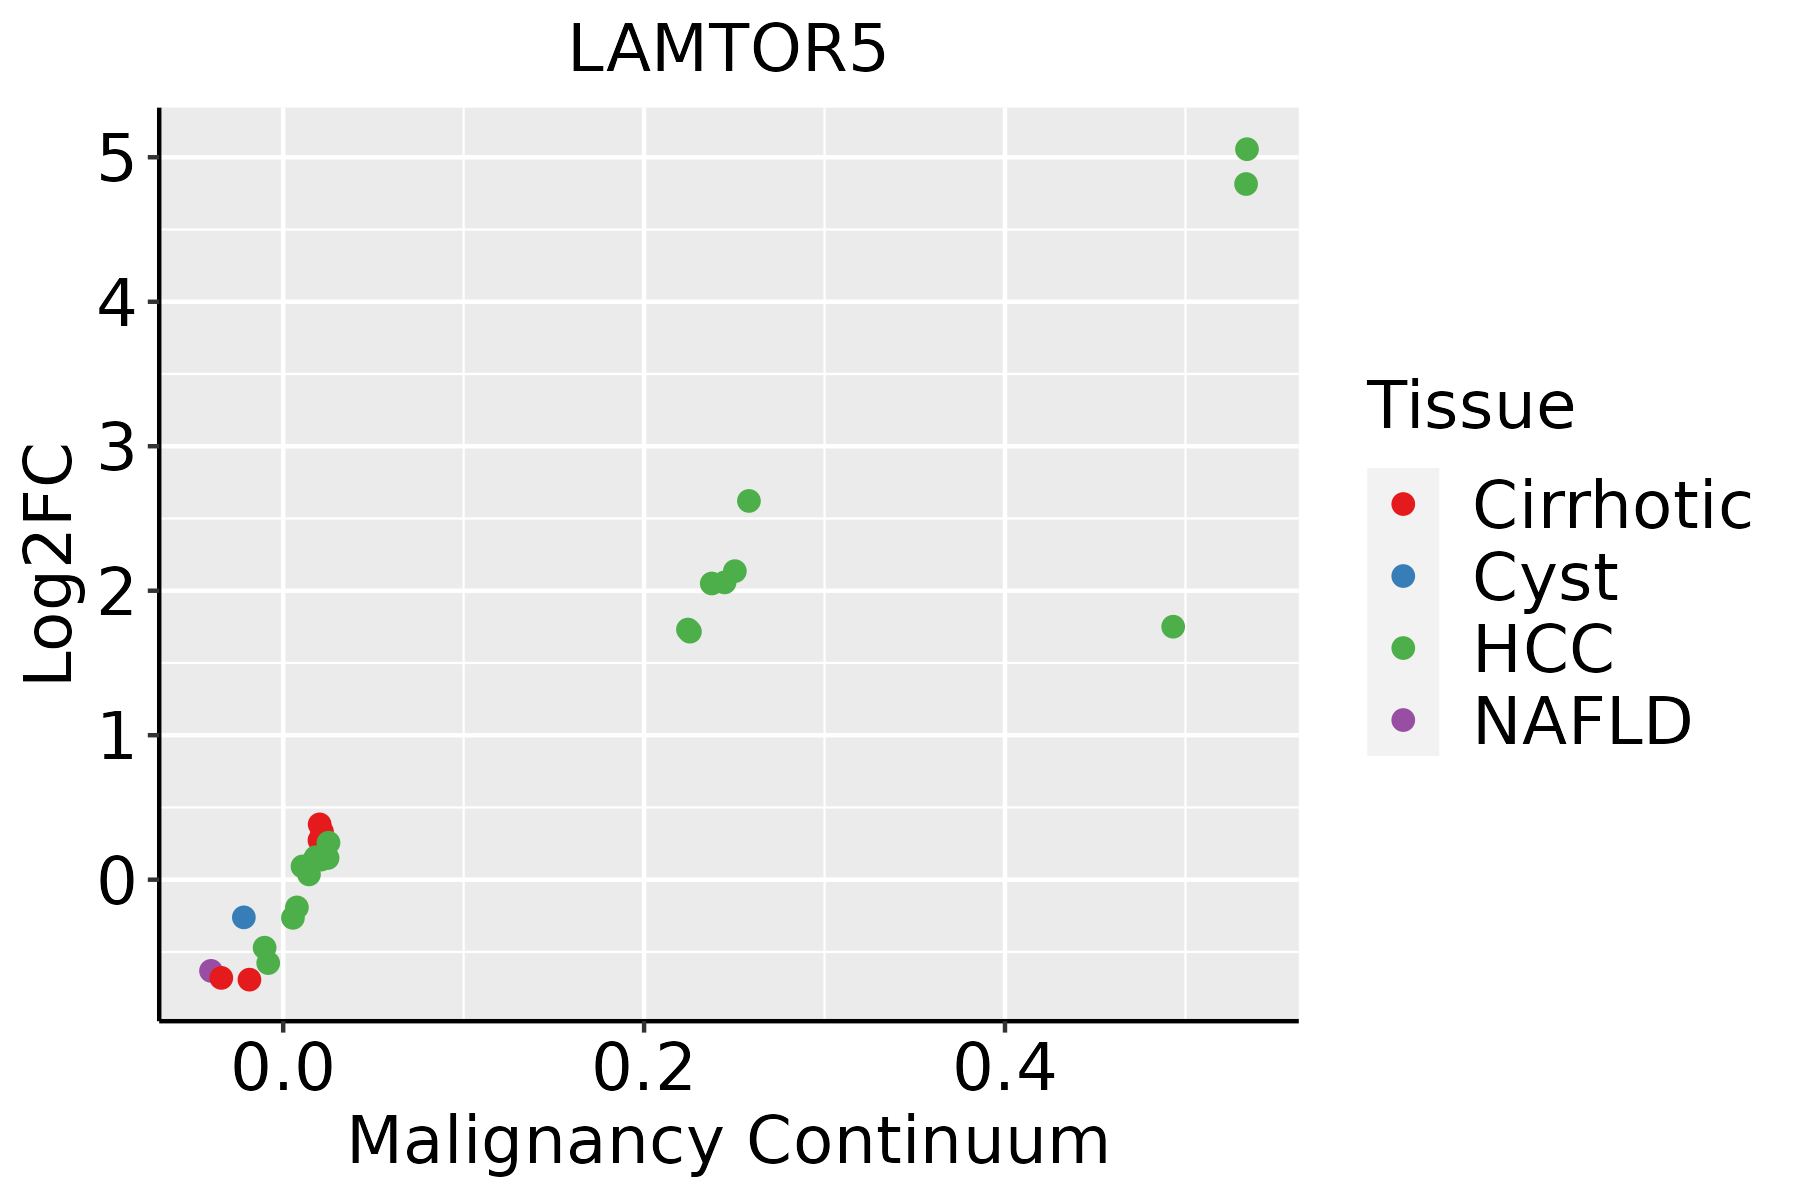 | HCC: Hepatocellular carcinoma |
| NAFLD: Non-alcoholic fatty liver disease | ||
| Oral Cavity |  | EOLP: Erosive Oral lichen planus |
| LP: leukoplakia | ||
| NEOLP: Non-erosive oral lichen planus | ||
| OSCC: Oral squamous cell carcinoma | ||
| Prostate | 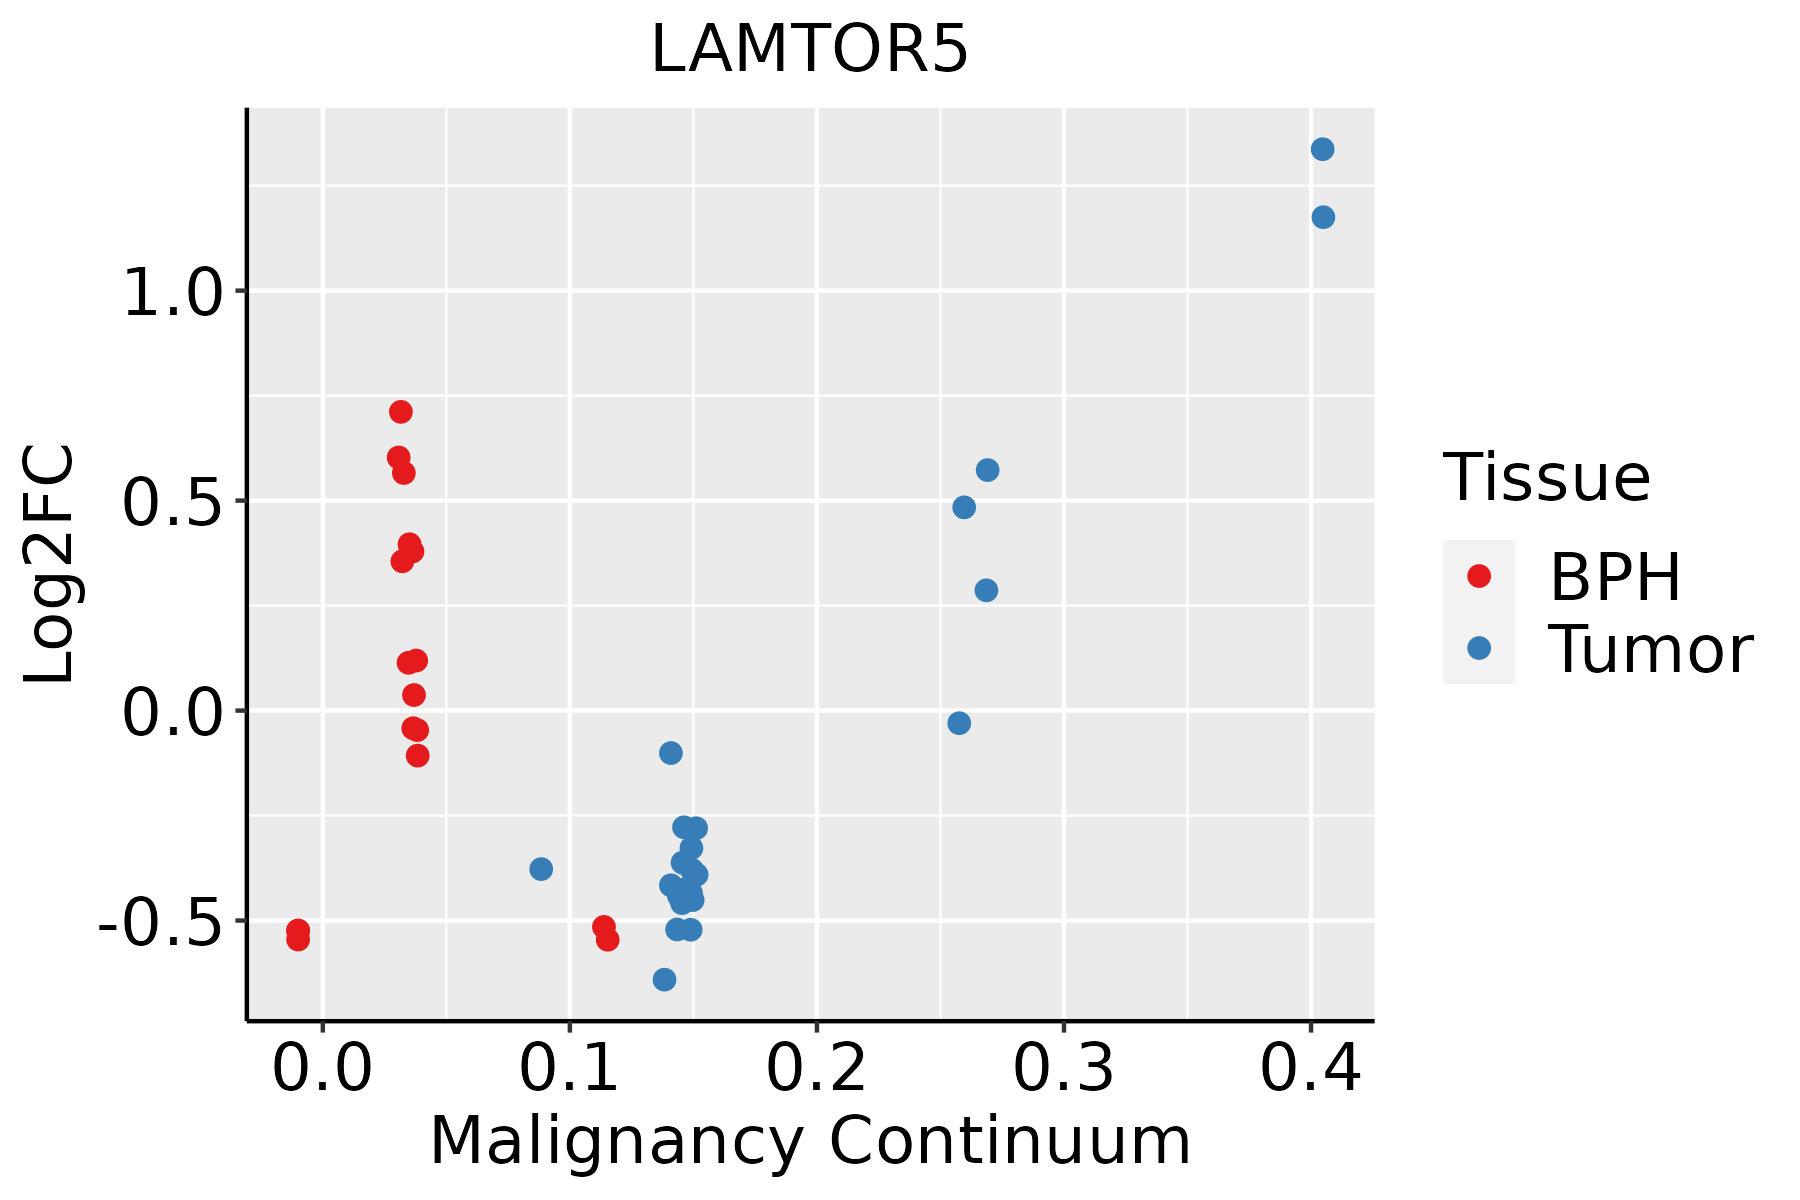 | BPH: Benign Prostatic Hyperplasia |
| Skin |  | AK: Actinic keratosis |
| cSCC: Cutaneous squamous cell carcinoma | ||
| SCCIS:squamous cell carcinoma in situ | ||
| Thyroid |  | ATC: Anaplastic thyroid cancer |
| HT: Hashimoto's thyroiditis | ||
| PTC: Papillary thyroid cancer |
| ∗log2FC in expression of this searched gene in stem-like cells from each diseased tissue sample relative to stem-like cells in normal samples in each tissue plotted against the malignancy continuum. Samples are colored based on if they are from different disease stage. |
Top |
Malignant transformation related pathway analysis |
| Find out the enriched GO biological processes and KEGG pathways involved in transition from healthy to precancer to cancer |
| Tissue | Disease Stage | Enriched GO biological Processes |
| Colorectum | AD |  |
| Colorectum | SER |  |
| Colorectum | MSS |  |
| Colorectum | MSI-H |  |
| Colorectum | FAP |  |
| ∗Top 15 enriched GO BP terms are showed in the bar plot of each disease state in each tissue. Each row represents a significant GO biological process which is colored according to the -log10(p.adjust). |
| Page: 1 2 3 4 5 6 7 8 9 |
| GO ID | Tissue | Disease Stage | Description | Gene Ratio | Bg Ratio | pvalue | p.adjust | Count |
| GO:001603210 | Cervix | CC | viral process | 109/2311 | 415/18723 | 5.40e-15 | 6.46e-12 | 109 |
| GO:001905810 | Cervix | CC | viral life cycle | 87/2311 | 317/18723 | 2.20e-13 | 1.20e-10 | 87 |
| GO:005254710 | Cervix | CC | regulation of peptidase activity | 112/2311 | 461/18723 | 6.70e-13 | 3.08e-10 | 112 |
| GO:005254810 | Cervix | CC | regulation of endopeptidase activity | 103/2311 | 432/18723 | 1.89e-11 | 5.14e-09 | 103 |
| GO:190382910 | Cervix | CC | positive regulation of cellular protein localization | 72/2311 | 276/18723 | 3.20e-10 | 4.46e-08 | 72 |
| GO:200011610 | Cervix | CC | regulation of cysteine-type endopeptidase activity | 61/2311 | 235/18723 | 8.69e-09 | 7.22e-07 | 61 |
| GO:004328110 | Cervix | CC | regulation of cysteine-type endopeptidase activity involved in apoptotic process | 55/2311 | 209/18723 | 2.77e-08 | 1.95e-06 | 55 |
| GO:004586110 | Cervix | CC | negative regulation of proteolysis | 80/2311 | 351/18723 | 2.88e-08 | 1.98e-06 | 80 |
| GO:00345048 | Cervix | CC | protein localization to nucleus | 68/2311 | 290/18723 | 9.91e-08 | 5.25e-06 | 68 |
| GO:005109810 | Cervix | CC | regulation of binding | 80/2311 | 363/18723 | 1.32e-07 | 6.42e-06 | 80 |
| GO:00513469 | Cervix | CC | negative regulation of hydrolase activity | 81/2311 | 379/18723 | 4.27e-07 | 1.67e-05 | 81 |
| GO:00018197 | Cervix | CC | positive regulation of cytokine production | 95/2311 | 467/18723 | 4.88e-07 | 1.85e-05 | 95 |
| GO:00104669 | Cervix | CC | negative regulation of peptidase activity | 60/2311 | 262/18723 | 1.27e-06 | 4.34e-05 | 60 |
| GO:00510904 | Cervix | CC | regulation of DNA-binding transcription factor activity | 87/2311 | 440/18723 | 4.85e-06 | 1.22e-04 | 87 |
| GO:001907910 | Cervix | CC | viral genome replication | 35/2311 | 131/18723 | 6.11e-06 | 1.49e-04 | 35 |
| GO:001095110 | Cervix | CC | negative regulation of endopeptidase activity | 56/2311 | 252/18723 | 7.43e-06 | 1.74e-04 | 56 |
| GO:005109910 | Cervix | CC | positive regulation of binding | 42/2311 | 173/18723 | 1.07e-05 | 2.33e-04 | 42 |
| GO:00325359 | Cervix | CC | regulation of cellular component size | 76/2311 | 383/18723 | 1.66e-05 | 3.21e-04 | 76 |
| GO:00096158 | Cervix | CC | response to virus | 73/2311 | 367/18723 | 2.22e-05 | 3.95e-04 | 73 |
| GO:005110110 | Cervix | CC | regulation of DNA binding | 31/2311 | 118/18723 | 2.91e-05 | 4.81e-04 | 31 |
| Page: 1 2 3 4 5 6 7 8 9 10 11 12 13 14 15 16 17 18 19 20 21 22 23 24 25 26 27 28 29 30 31 32 33 34 |
| Pathway ID | Tissue | Disease Stage | Description | Gene Ratio | Bg Ratio | pvalue | p.adjust | qvalue | Count |
| hsa04150 | Colorectum | MSS | mTOR signaling pathway | 47/1875 | 156/8465 | 1.19e-02 | 3.99e-02 | 2.44e-02 | 47 |
| hsa041501 | Colorectum | MSS | mTOR signaling pathway | 47/1875 | 156/8465 | 1.19e-02 | 3.99e-02 | 2.44e-02 | 47 |
| hsa041505 | Esophagus | ESCC | mTOR signaling pathway | 98/4205 | 156/8465 | 5.81e-04 | 1.95e-03 | 9.97e-04 | 98 |
| hsa0415013 | Esophagus | ESCC | mTOR signaling pathway | 98/4205 | 156/8465 | 5.81e-04 | 1.95e-03 | 9.97e-04 | 98 |
| hsa041502 | Liver | HCC | mTOR signaling pathway | 95/4020 | 156/8465 | 4.70e-04 | 1.99e-03 | 1.11e-03 | 95 |
| hsa0415011 | Liver | HCC | mTOR signaling pathway | 95/4020 | 156/8465 | 4.70e-04 | 1.99e-03 | 1.11e-03 | 95 |
| hsa041504 | Oral cavity | OSCC | mTOR signaling pathway | 90/3704 | 156/8465 | 2.87e-04 | 9.15e-04 | 4.66e-04 | 90 |
| hsa0415012 | Oral cavity | OSCC | mTOR signaling pathway | 90/3704 | 156/8465 | 2.87e-04 | 9.15e-04 | 4.66e-04 | 90 |
| Page: 1 |
Top |
Cell-cell communication analysis |
| Identification of potential cell-cell interactions between two cell types and their ligand-receptor pairs for different disease states |
| Ligand | Receptor | LRpair | Pathway | Tissue | Disease Stage |
| Page: 1 |
Top |
Single-cell gene regulatory network inference analysis |
| Find out the significant the regulons (TFs) and the target genes of each regulon across cell types for different disease states |
| TF | Cell Type | Tissue | Disease Stage | Target Gene | RSS | Regulon Activity |
| ∗The dot plots of a searched regulon are shown for all cell subpopulations in each disease state of each tissue based on the regulon specific score inferred using pySCENIC and by calculating the average expression. |
| Page: 1 |
Top |
Somatic mutation of malignant transformation related genes |
| Annotation of somatic variants for genes involved in malignant transformation |
| Hugo Symbol | Variant Class | Variant Classification | dbSNP RS | HGVSc | HGVSp | HGVSp Short | SWISSPROT | BIOTYPE | SIFT | PolyPhen | Tumor Sample Barcode | Tissue | Histology | Sex | Age | Stage | Therapy Types | Drugs | Outcome |
| LAMTOR5 | insertion | Frame_Shift_Ins | novel | c.183_184insACGGAATTTCGCTCGTCTTCCAGGCT | p.Ala62ThrfsTer43 | p.A62Tfs*43 | protein_coding | TCGA-BH-A0HU-01 | Breast | breast invasive carcinoma | Female | <65 | I/II | Chemotherapy | docetaxel | SD | |||
| LAMTOR5 | SNV | Missense_Mutation | novel | c.229N>C | p.Glu77Gln | p.E77Q | protein_coding | tolerated_low_confidence(0.61) | benign(0.014) | TCGA-C5-A2LZ-01 | Cervix | cervical & endocervical cancer | Female | >=65 | III/IV | Unknown | Unknown | PD | |
| LAMTOR5 | SNV | Missense_Mutation | rs766029896 | c.347G>A | p.Arg116His | p.R116H | protein_coding | deleterious(0.04) | benign(0.304) | TCGA-AA-3864-01 | Colorectum | colon adenocarcinoma | Male | >=65 | I/II | Unknown | Unknown | SD | |
| LAMTOR5 | SNV | Missense_Mutation | rs768953245 | c.292C>T | p.Pro98Ser | p.P98S | protein_coding | deleterious(0.03) | possibly_damaging(0.525) | TCGA-AX-A1CE-01 | Endometrium | uterine corpus endometrioid carcinoma | Female | <65 | I/II | Unspecific | Paclitaxel | SD | |
| LAMTOR5 | SNV | Missense_Mutation | c.461G>A | p.Gly154Glu | p.G154E | protein_coding | tolerated(0.25) | benign(0.29) | TCGA-B5-A11Y-01 | Endometrium | uterine corpus endometrioid carcinoma | Female | <65 | I/II | Unknown | Unknown | SD | ||
| LAMTOR5 | SNV | Missense_Mutation | novel | c.380N>C | p.Ile127Thr | p.I127T | protein_coding | deleterious(0) | possibly_damaging(0.838) | TCGA-B5-A3FA-01 | Endometrium | uterine corpus endometrioid carcinoma | Female | >=65 | I/II | Unknown | Unknown | SD | |
| LAMTOR5 | SNV | Missense_Mutation | novel | c.151N>T | p.Arg51Trp | p.R51W | protein_coding | deleterious_low_confidence(0.01) | possibly_damaging(0.528) | TCGA-BG-A222-01 | Endometrium | uterine corpus endometrioid carcinoma | Female | <65 | I/II | Unknown | Unknown | SD | |
| LAMTOR5 | SNV | Missense_Mutation | rs767736737 | c.127N>G | p.Phe43Val | p.F43V | protein_coding | deleterious_low_confidence(0.05) | benign(0.022) | TCGA-EO-A3AV-01 | Endometrium | uterine corpus endometrioid carcinoma | Female | <65 | III/IV | Chemotherapy | carboplatin | CR | |
| LAMTOR5 | SNV | Missense_Mutation | novel | c.190N>A | p.Gly64Ser | p.G64S | protein_coding | tolerated_low_confidence(0.13) | benign(0.001) | TCGA-G3-A25Y-01 | Liver | liver hepatocellular carcinoma | Female | <65 | I/II | Unknown | Unknown | PD | |
| LAMTOR5 | SNV | Missense_Mutation | rs375886789 | c.196N>A | p.Glu66Lys | p.E66K | protein_coding | tolerated_low_confidence(0.11) | benign(0.015) | TCGA-55-8507-01 | Lung | lung adenocarcinoma | Male | <65 | I/II | Unknown | Unknown | SD |
| Page: 1 2 |
Top |
Related drugs of malignant transformation related genes |
| Identification of chemicals and drugs interact with genes involved in malignant transfromation |
| (DGIdb 4.0) |
| Entrez ID | Symbol | Category | Interaction Types | Drug Claim Name | Drug Name | PMIDs |
| Page: 1 |

Copyright 2023-Present -The University of Texas Health Science Center at Houston |