
|
|||||
|
 | |
| |
| |
| |
| |
| |
|
Gene: KDM5C |
Gene summary for KDM5C |
| Gene information | Species | Human | Gene symbol | KDM5C | Gene ID | 8242 |
| Gene name | lysine demethylase 5C | |
| Gene Alias | DXS1272E | |
| Cytomap | Xp11.22 | |
| Gene Type | protein-coding | GO ID | GO:0006139 | UniProtAcc | P41229 |
Top |
Malignant transformation analysis |
| Identification of the aberrant gene expression in precancerous and cancerous lesions by comparing the gene expression of stem-like cells in diseased tissues with normal stem cells |
| Entrez ID | Symbol | Replicates | Species | Organ | Tissue | Adj P-value | Log2FC | Malignancy |
| 8242 | KDM5C | EOLP-1 | Human | Oral cavity | EOLP | 4.19e-04 | 1.09e-01 | -0.0202 |
| 8242 | KDM5C | NEOLP-3 | Human | Oral cavity | NEOLP | 7.32e-03 | 7.26e-02 | -0.0191 |
| 8242 | KDM5C | SYSMH1 | Human | Oral cavity | OSCC | 5.47e-08 | 2.21e-01 | 0.1127 |
| 8242 | KDM5C | SYSMH2 | Human | Oral cavity | OSCC | 5.02e-10 | 2.15e-01 | 0.2326 |
| 8242 | KDM5C | SYSMH3 | Human | Oral cavity | OSCC | 2.95e-28 | 5.41e-01 | 0.2442 |
| 8242 | KDM5C | SYSMH6 | Human | Oral cavity | OSCC | 4.51e-06 | 1.59e-01 | 0.1275 |
| 8242 | KDM5C | male-WTA | Human | Thyroid | PTC | 9.41e-44 | 3.45e-01 | 0.1037 |
| 8242 | KDM5C | PTC01 | Human | Thyroid | PTC | 2.06e-06 | 6.89e-02 | 0.1899 |
| 8242 | KDM5C | PTC03 | Human | Thyroid | PTC | 4.21e-02 | 8.19e-02 | 0.1784 |
| 8242 | KDM5C | PTC04 | Human | Thyroid | PTC | 7.60e-22 | 2.98e-01 | 0.1927 |
| 8242 | KDM5C | PTC05 | Human | Thyroid | PTC | 1.37e-13 | 5.53e-01 | 0.2065 |
| 8242 | KDM5C | PTC06 | Human | Thyroid | PTC | 8.89e-14 | 3.31e-01 | 0.2057 |
| 8242 | KDM5C | PTC07 | Human | Thyroid | PTC | 4.77e-28 | 3.51e-01 | 0.2044 |
| 8242 | KDM5C | ATC09 | Human | Thyroid | ATC | 9.92e-12 | 3.34e-01 | 0.2871 |
| 8242 | KDM5C | ATC11 | Human | Thyroid | ATC | 5.72e-04 | 2.99e-01 | 0.3386 |
| 8242 | KDM5C | ATC12 | Human | Thyroid | ATC | 5.93e-07 | 5.33e-02 | 0.34 |
| 8242 | KDM5C | ATC13 | Human | Thyroid | ATC | 9.46e-23 | 4.11e-01 | 0.34 |
| 8242 | KDM5C | ATC1 | Human | Thyroid | ATC | 1.00e-10 | 3.60e-01 | 0.2878 |
| 8242 | KDM5C | ATC2 | Human | Thyroid | ATC | 2.03e-09 | 1.11e+00 | 0.34 |
| 8242 | KDM5C | ATC3 | Human | Thyroid | ATC | 1.28e-05 | 2.69e-01 | 0.338 |
| Page: 1 2 3 4 5 6 |
| Tissue | Expression Dynamics | Abbreviation |
| Esophagus | 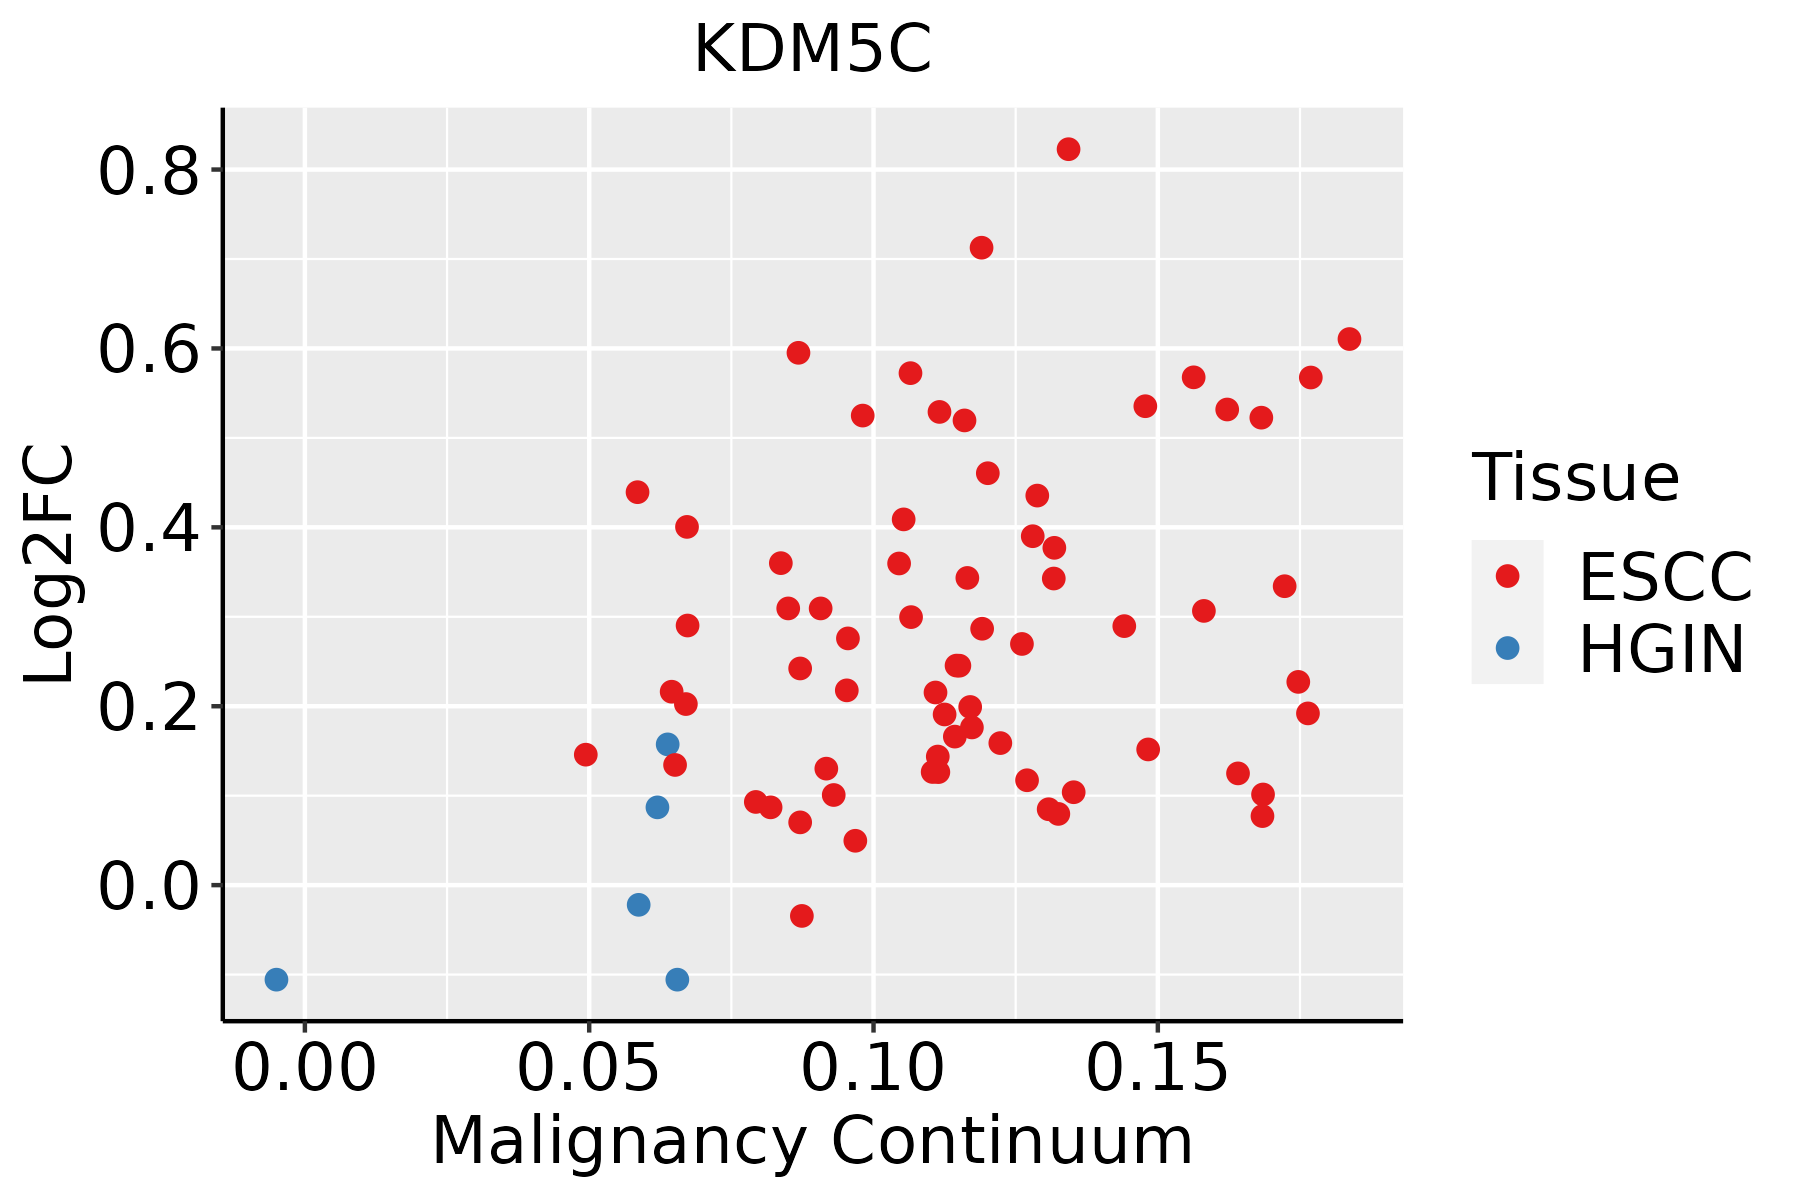 | ESCC: Esophageal squamous cell carcinoma |
| HGIN: High-grade intraepithelial neoplasias | ||
| LGIN: Low-grade intraepithelial neoplasias | ||
| Liver | 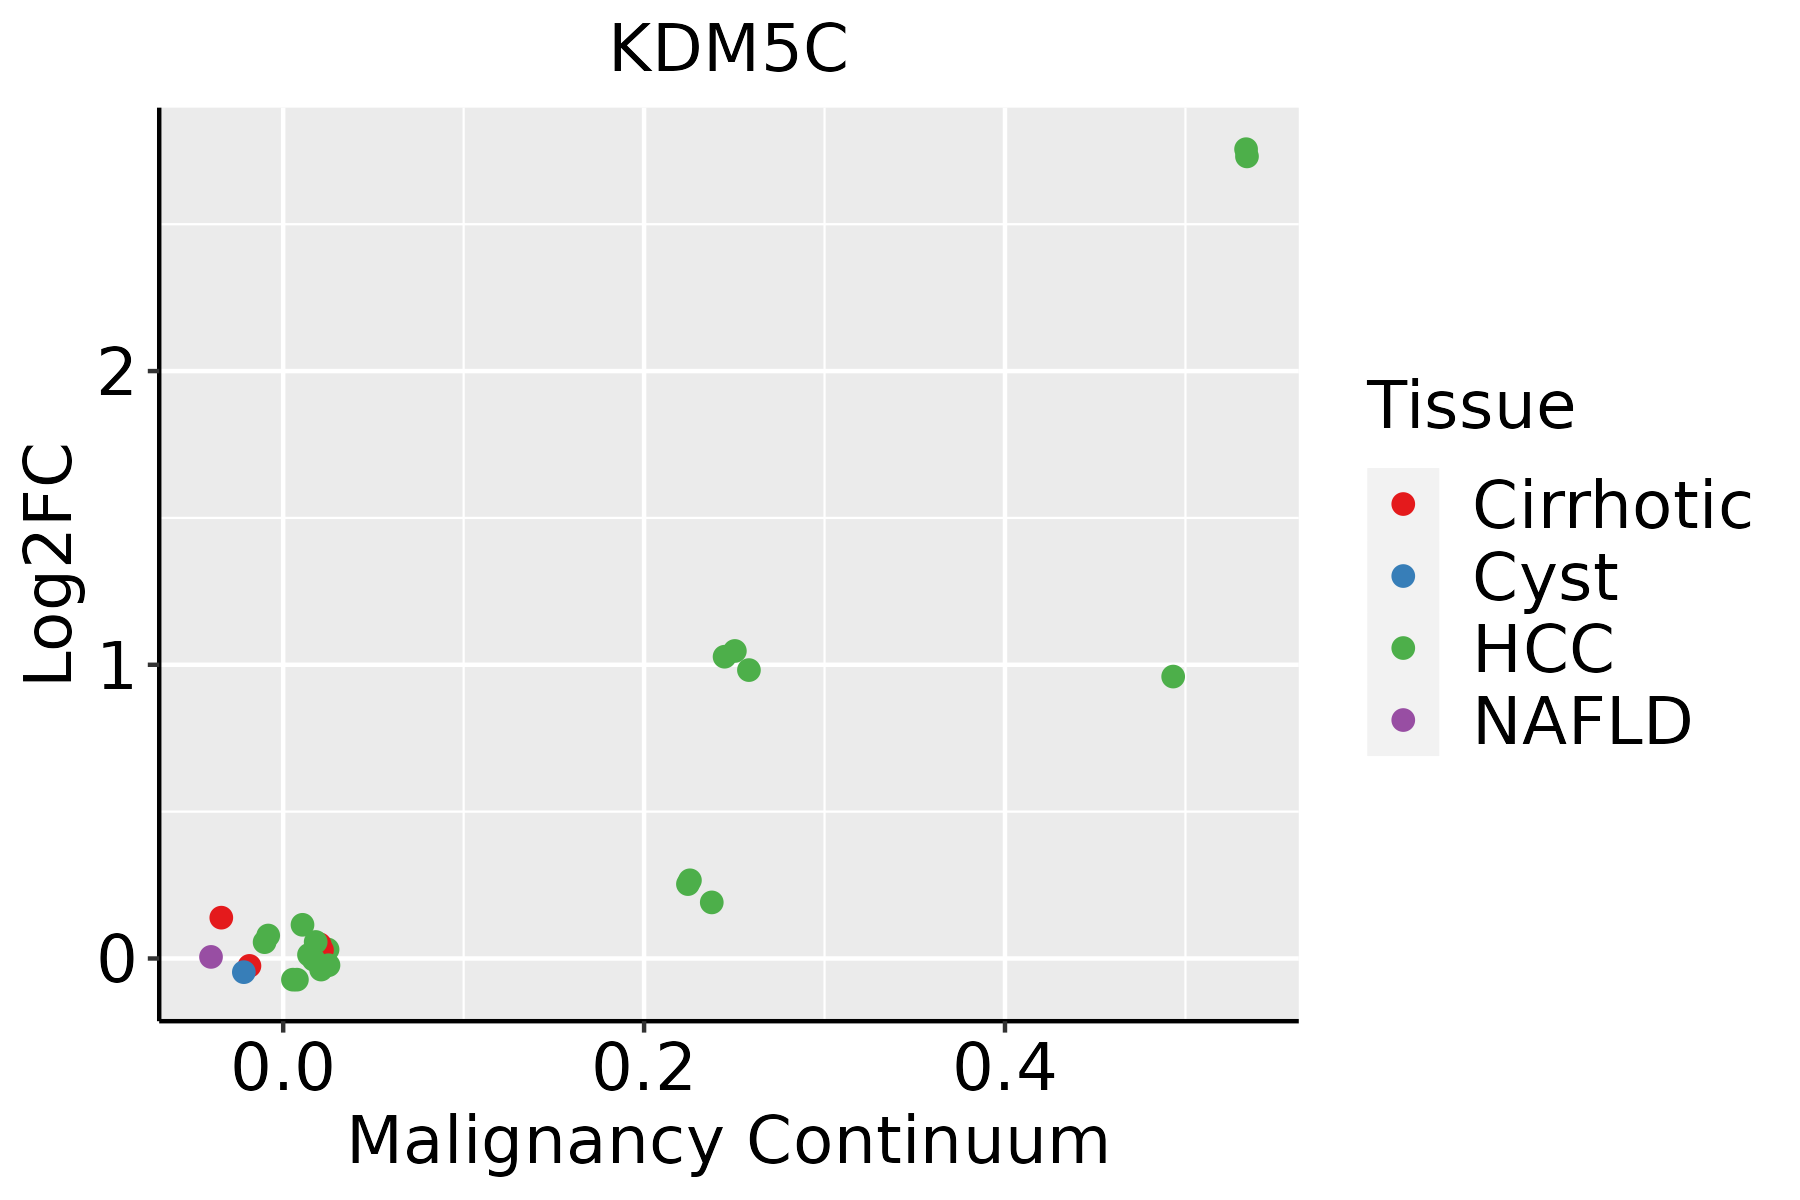 | HCC: Hepatocellular carcinoma |
| NAFLD: Non-alcoholic fatty liver disease | ||
| Oral Cavity | 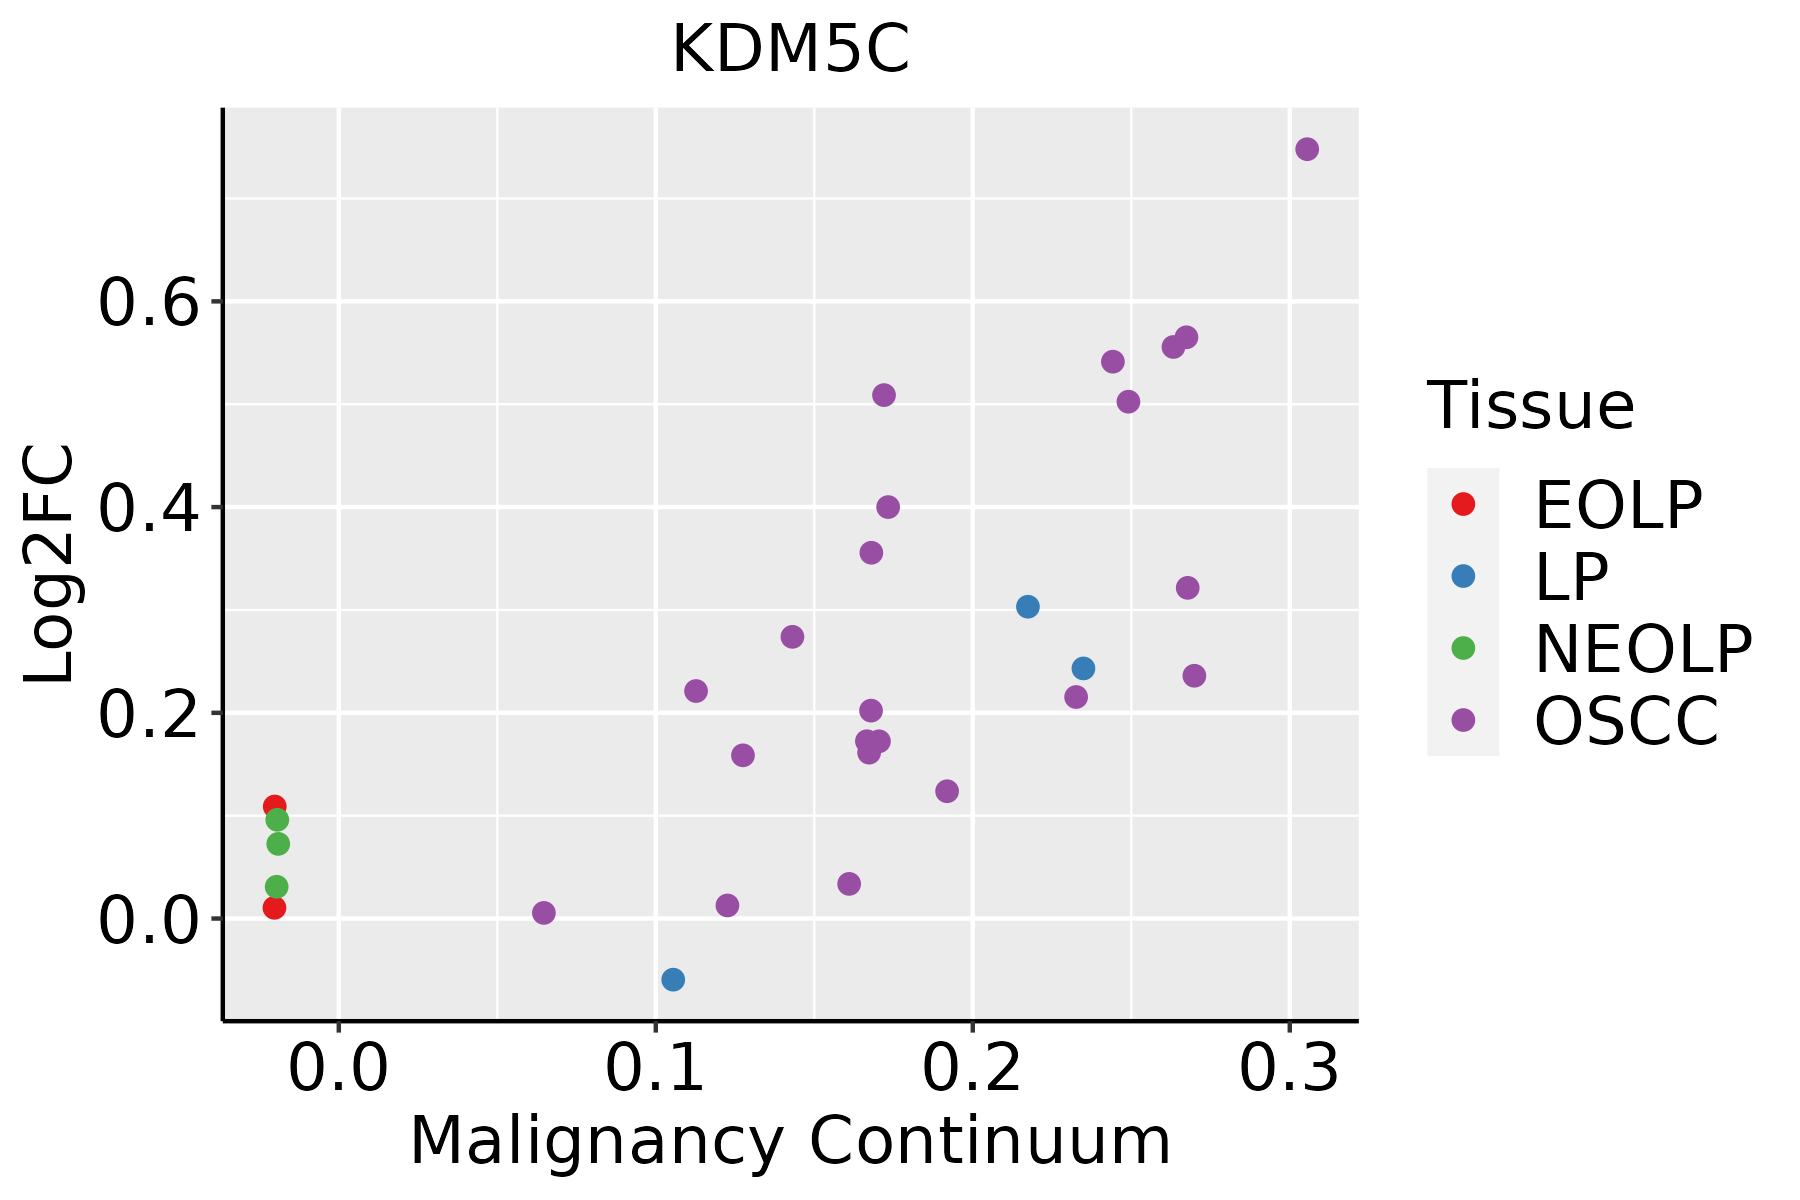 | EOLP: Erosive Oral lichen planus |
| LP: leukoplakia | ||
| NEOLP: Non-erosive oral lichen planus | ||
| OSCC: Oral squamous cell carcinoma | ||
| Thyroid | 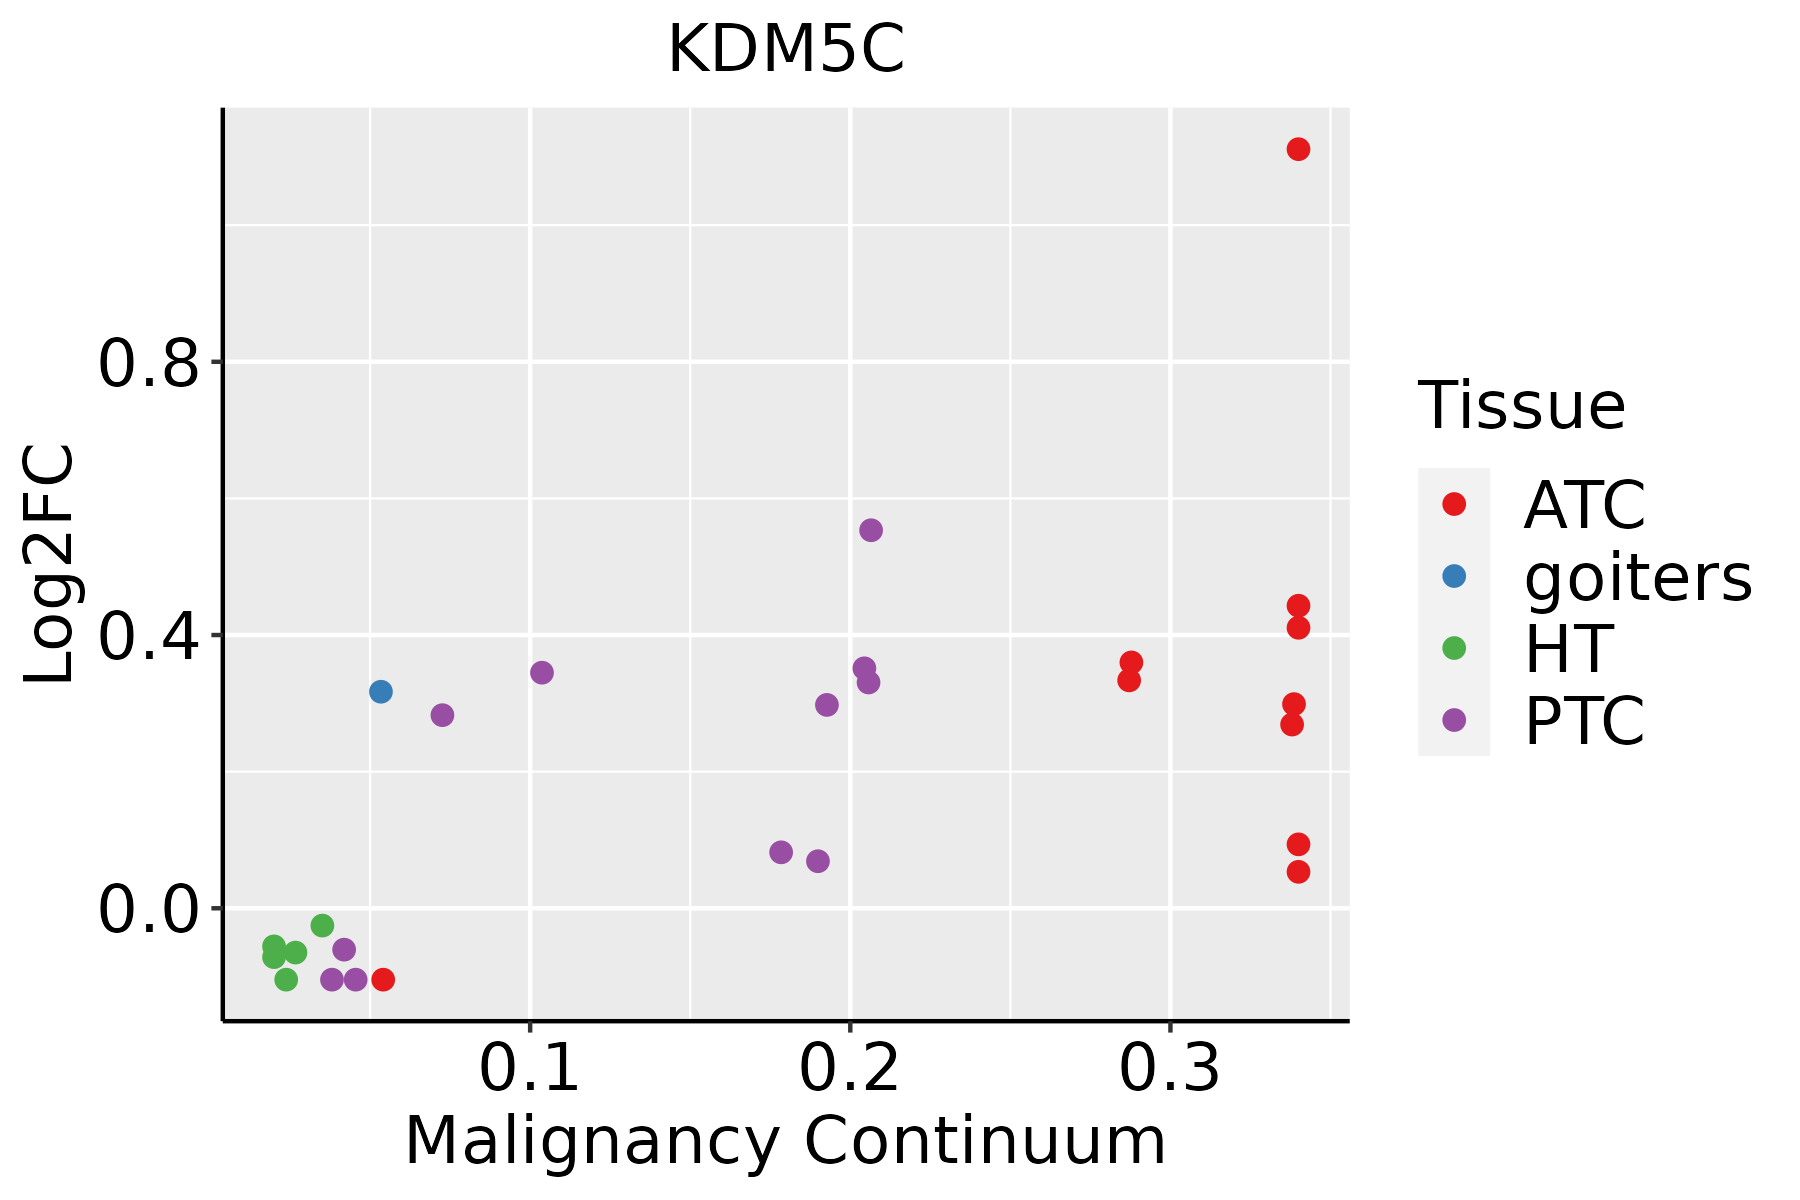 | ATC: Anaplastic thyroid cancer |
| HT: Hashimoto's thyroiditis | ||
| PTC: Papillary thyroid cancer |
| ∗log2FC in expression of this searched gene in stem-like cells from each diseased tissue sample relative to stem-like cells in normal samples in each tissue plotted against the malignancy continuum. Samples are colored based on if they are from different disease stage. |
Top |
Malignant transformation related pathway analysis |
| Find out the enriched GO biological processes and KEGG pathways involved in transition from healthy to precancer to cancer |
| Tissue | Disease Stage | Enriched GO biological Processes |
| Colorectum | AD |  |
| Colorectum | SER |  |
| Colorectum | MSS |  |
| Colorectum | MSI-H |  |
| Colorectum | FAP |  |
| ∗Top 15 enriched GO BP terms are showed in the bar plot of each disease state in each tissue. Each row represents a significant GO biological process which is colored according to the -log10(p.adjust). |
| Page: 1 2 3 4 5 6 7 8 9 |
| GO ID | Tissue | Disease Stage | Description | Gene Ratio | Bg Ratio | pvalue | p.adjust | Count |
| GO:001657015 | Esophagus | ESCC | histone modification | 323/8552 | 463/18723 | 2.61e-26 | 7.88e-24 | 323 |
| GO:000632517 | Esophagus | ESCC | chromatin organization | 240/8552 | 409/18723 | 6.52e-08 | 1.14e-06 | 240 |
| GO:000963620 | Esophagus | ESCC | response to toxic substance | 150/8552 | 262/18723 | 1.00e-04 | 7.12e-04 | 150 |
| GO:004851118 | Esophagus | ESCC | rhythmic process | 164/8552 | 298/18723 | 6.80e-04 | 3.57e-03 | 164 |
| GO:00064824 | Esophagus | ESCC | protein demethylation | 24/8552 | 33/18723 | 1.50e-03 | 7.06e-03 | 24 |
| GO:00082144 | Esophagus | ESCC | protein dealkylation | 24/8552 | 33/18723 | 1.50e-03 | 7.06e-03 | 24 |
| GO:00165773 | Esophagus | ESCC | histone demethylation | 22/8552 | 31/18723 | 3.90e-03 | 1.58e-02 | 22 |
| GO:00700763 | Esophagus | ESCC | histone lysine demethylation | 20/8552 | 28/18723 | 5.23e-03 | 1.97e-02 | 20 |
| GO:001657021 | Liver | HCC | histone modification | 283/7958 | 463/18723 | 2.68e-16 | 2.33e-14 | 283 |
| GO:000963622 | Liver | HCC | response to toxic substance | 153/7958 | 262/18723 | 1.37e-07 | 2.58e-06 | 153 |
| GO:004851121 | Liver | HCC | rhythmic process | 156/7958 | 298/18723 | 3.54e-04 | 2.46e-03 | 156 |
| GO:000632511 | Liver | HCC | chromatin organization | 206/7958 | 409/18723 | 7.23e-04 | 4.41e-03 | 206 |
| GO:00165707 | Oral cavity | OSCC | histone modification | 270/7305 | 463/18723 | 1.59e-17 | 1.50e-15 | 270 |
| GO:004851116 | Oral cavity | OSCC | rhythmic process | 157/7305 | 298/18723 | 1.00e-06 | 1.36e-05 | 157 |
| GO:000963618 | Oral cavity | OSCC | response to toxic substance | 137/7305 | 262/18723 | 7.94e-06 | 8.52e-05 | 137 |
| GO:000632510 | Oral cavity | OSCC | chromatin organization | 190/7305 | 409/18723 | 1.17e-03 | 5.97e-03 | 190 |
| GO:001657023 | Oral cavity | EOLP | histone modification | 98/2218 | 463/18723 | 5.58e-09 | 2.96e-07 | 98 |
| GO:004851117 | Oral cavity | EOLP | rhythmic process | 69/2218 | 298/18723 | 2.68e-08 | 1.11e-06 | 69 |
| GO:000632515 | Oral cavity | EOLP | chromatin organization | 84/2218 | 409/18723 | 2.68e-07 | 8.16e-06 | 84 |
| GO:000963625 | Oral cavity | EOLP | response to toxic substance | 48/2218 | 262/18723 | 1.37e-03 | 9.49e-03 | 48 |
| Page: 1 2 |
| Pathway ID | Tissue | Disease Stage | Description | Gene Ratio | Bg Ratio | pvalue | p.adjust | qvalue | Count |
| Page: 1 |
Top |
Cell-cell communication analysis |
| Identification of potential cell-cell interactions between two cell types and their ligand-receptor pairs for different disease states |
| Ligand | Receptor | LRpair | Pathway | Tissue | Disease Stage |
| Page: 1 |
Top |
Single-cell gene regulatory network inference analysis |
| Find out the significant the regulons (TFs) and the target genes of each regulon across cell types for different disease states |
| TF | Cell Type | Tissue | Disease Stage | Target Gene | RSS | Regulon Activity |
| ∗The dot plots of a searched regulon are shown for all cell subpopulations in each disease state of each tissue based on the regulon specific score inferred using pySCENIC and by calculating the average expression. |
| Page: 1 |
Top |
Somatic mutation of malignant transformation related genes |
| Annotation of somatic variants for genes involved in malignant transformation |
| Hugo Symbol | Variant Class | Variant Classification | dbSNP RS | HGVSc | HGVSp | HGVSp Short | SWISSPROT | BIOTYPE | SIFT | PolyPhen | Tumor Sample Barcode | Tissue | Histology | Sex | Age | Stage | Therapy Types | Drugs | Outcome |
| KDM5C | SNV | Missense_Mutation | c.2941G>A | p.Glu981Lys | p.E981K | P41229 | protein_coding | deleterious(0.01) | possibly_damaging(0.902) | TCGA-A2-A0CX-01 | Breast | breast invasive carcinoma | Female | <65 | I/II | Chemotherapy | adriamycin | SD | |
| KDM5C | SNV | Missense_Mutation | novel | c.1377A>C | p.Lys459Asn | p.K459N | P41229 | protein_coding | deleterious(0.02) | benign(0.382) | TCGA-A8-A094-01 | Breast | breast invasive carcinoma | Female | >=65 | I/II | Unknown | Unknown | SD |
| KDM5C | SNV | Missense_Mutation | c.3820N>A | p.Glu1274Lys | p.E1274K | P41229 | protein_coding | deleterious(0) | probably_damaging(0.999) | TCGA-A8-A0A7-01 | Breast | breast invasive carcinoma | Female | <65 | I/II | Unknown | Unknown | SD | |
| KDM5C | SNV | Missense_Mutation | c.1988N>T | p.Ala663Val | p.A663V | P41229 | protein_coding | deleterious(0) | possibly_damaging(0.659) | TCGA-AN-A0AK-01 | Breast | breast invasive carcinoma | Female | >=65 | I/II | Unknown | Unknown | SD | |
| KDM5C | SNV | Missense_Mutation | c.3883N>C | p.Ala1295Pro | p.A1295P | P41229 | protein_coding | deleterious(0.01) | possibly_damaging(0.701) | TCGA-BH-A18G-01 | Breast | breast invasive carcinoma | Female | >=65 | I/II | Unknown | Unknown | SD | |
| KDM5C | SNV | Missense_Mutation | c.3881N>T | p.Gln1294Leu | p.Q1294L | P41229 | protein_coding | deleterious(0) | possibly_damaging(0.548) | TCGA-BH-A18G-01 | Breast | breast invasive carcinoma | Female | >=65 | I/II | Unknown | Unknown | SD | |
| KDM5C | SNV | Missense_Mutation | c.3319N>C | p.Asp1107His | p.D1107H | P41229 | protein_coding | deleterious(0.02) | benign(0.053) | TCGA-D8-A1J8-01 | Breast | breast invasive carcinoma | Female | >=65 | I/II | Hormone Therapy | nolvadex | SD | |
| KDM5C | insertion | In_Frame_Ins | novel | c.3227_3228insACC | p.Leu1076_Thr1077insPro | p.L1076_T1077insP | P41229 | protein_coding | TCGA-A7-A26E-01 | Breast | breast invasive carcinoma | Female | >=65 | III/IV | Chemotherapy | cytoxan | SD | ||
| KDM5C | insertion | Frame_Shift_Ins | novel | c.3226_3227insCGACAGG | p.Leu1076ProfsTer56 | p.L1076Pfs*56 | P41229 | protein_coding | TCGA-A7-A26E-01 | Breast | breast invasive carcinoma | Female | >=65 | III/IV | Chemotherapy | cytoxan | SD | ||
| KDM5C | insertion | Nonsense_Mutation | novel | c.1625_1626insCAATTA | p.Ala542_Glu543insAsnTer | p.A542_E543insN* | P41229 | protein_coding | TCGA-A7-A26I-01 | Breast | breast invasive carcinoma | Female | >=65 | I/II | Chemotherapy | cytoxan | SD |
| Page: 1 2 3 4 5 6 7 8 9 10 11 12 13 14 15 16 |
Top |
Related drugs of malignant transformation related genes |
| Identification of chemicals and drugs interact with genes involved in malignant transfromation |
| (DGIdb 4.0) |
| Entrez ID | Symbol | Category | Interaction Types | Drug Claim Name | Drug Name | PMIDs |
| 8242 | KDM5C | DRUGGABLE GENOME, ENZYME, CLINICALLY ACTIONABLE | inhibitor | 310264759 | ||
| 8242 | KDM5C | DRUGGABLE GENOME, ENZYME, CLINICALLY ACTIONABLE | inhibitor | 178103605 | ||
| 8242 | KDM5C | DRUGGABLE GENOME, ENZYME, CLINICALLY ACTIONABLE | EVEROLIMUS | EVEROLIMUS | 27751729 | |
| 8242 | KDM5C | DRUGGABLE GENOME, ENZYME, CLINICALLY ACTIONABLE | inhibitor | 249565909 | ||
| 8242 | KDM5C | DRUGGABLE GENOME, ENZYME, CLINICALLY ACTIONABLE | inhibitor | 178103606 | ||
| 8242 | KDM5C | DRUGGABLE GENOME, ENZYME, CLINICALLY ACTIONABLE | SUNITINIB | SUNITINIB | 27751729 |
| Page: 1 |

Copyright 2023-Present -The University of Texas Health Science Center at Houston |