
|
|||||
|
 | |
| |
| |
| |
| |
| |
|
Gene: HELLS |
Gene summary for HELLS |
| Gene information | Species | Human | Gene symbol | HELLS | Gene ID | 3070 |
| Gene name | helicase, lymphoid specific | |
| Gene Alias | ICF4 | |
| Cytomap | 10q23.33 | |
| Gene Type | protein-coding | GO ID | GO:0001655 | UniProtAcc | A0A0B4J1V9 |
Top |
Malignant transformation analysis |
| Identification of the aberrant gene expression in precancerous and cancerous lesions by comparing the gene expression of stem-like cells in diseased tissues with normal stem cells |
| Entrez ID | Symbol | Replicates | Species | Organ | Tissue | Adj P-value | Log2FC | Malignancy |
| 3070 | HELLS | P10_cSCC | Human | Skin | cSCC | 8.94e-11 | 6.10e-01 | 0.1017 |
| 3070 | HELLS | PTC01 | Human | Thyroid | PTC | 3.61e-06 | 1.32e-01 | 0.1899 |
| 3070 | HELLS | PTC05 | Human | Thyroid | PTC | 4.86e-03 | 4.62e-01 | 0.2065 |
| 3070 | HELLS | PTC06 | Human | Thyroid | PTC | 1.69e-06 | 3.06e-01 | 0.2057 |
| 3070 | HELLS | PTC07 | Human | Thyroid | PTC | 2.84e-05 | 1.54e-01 | 0.2044 |
| 3070 | HELLS | ATC11 | Human | Thyroid | ATC | 3.91e-02 | 6.07e-01 | 0.3386 |
| 3070 | HELLS | ATC12 | Human | Thyroid | ATC | 3.88e-14 | 4.68e-01 | 0.34 |
| 3070 | HELLS | ATC13 | Human | Thyroid | ATC | 1.18e-16 | 4.15e-01 | 0.34 |
| 3070 | HELLS | ATC2 | Human | Thyroid | ATC | 5.77e-09 | 9.29e-01 | 0.34 |
| 3070 | HELLS | ATC3 | Human | Thyroid | ATC | 7.19e-04 | 6.04e-01 | 0.338 |
| 3070 | HELLS | ATC4 | Human | Thyroid | ATC | 4.00e-20 | 5.92e-01 | 0.34 |
| 3070 | HELLS | ATC5 | Human | Thyroid | ATC | 6.50e-21 | 5.47e-01 | 0.34 |
| Page: 1 2 3 4 5 |
| Tissue | Expression Dynamics | Abbreviation |
| Esophagus | 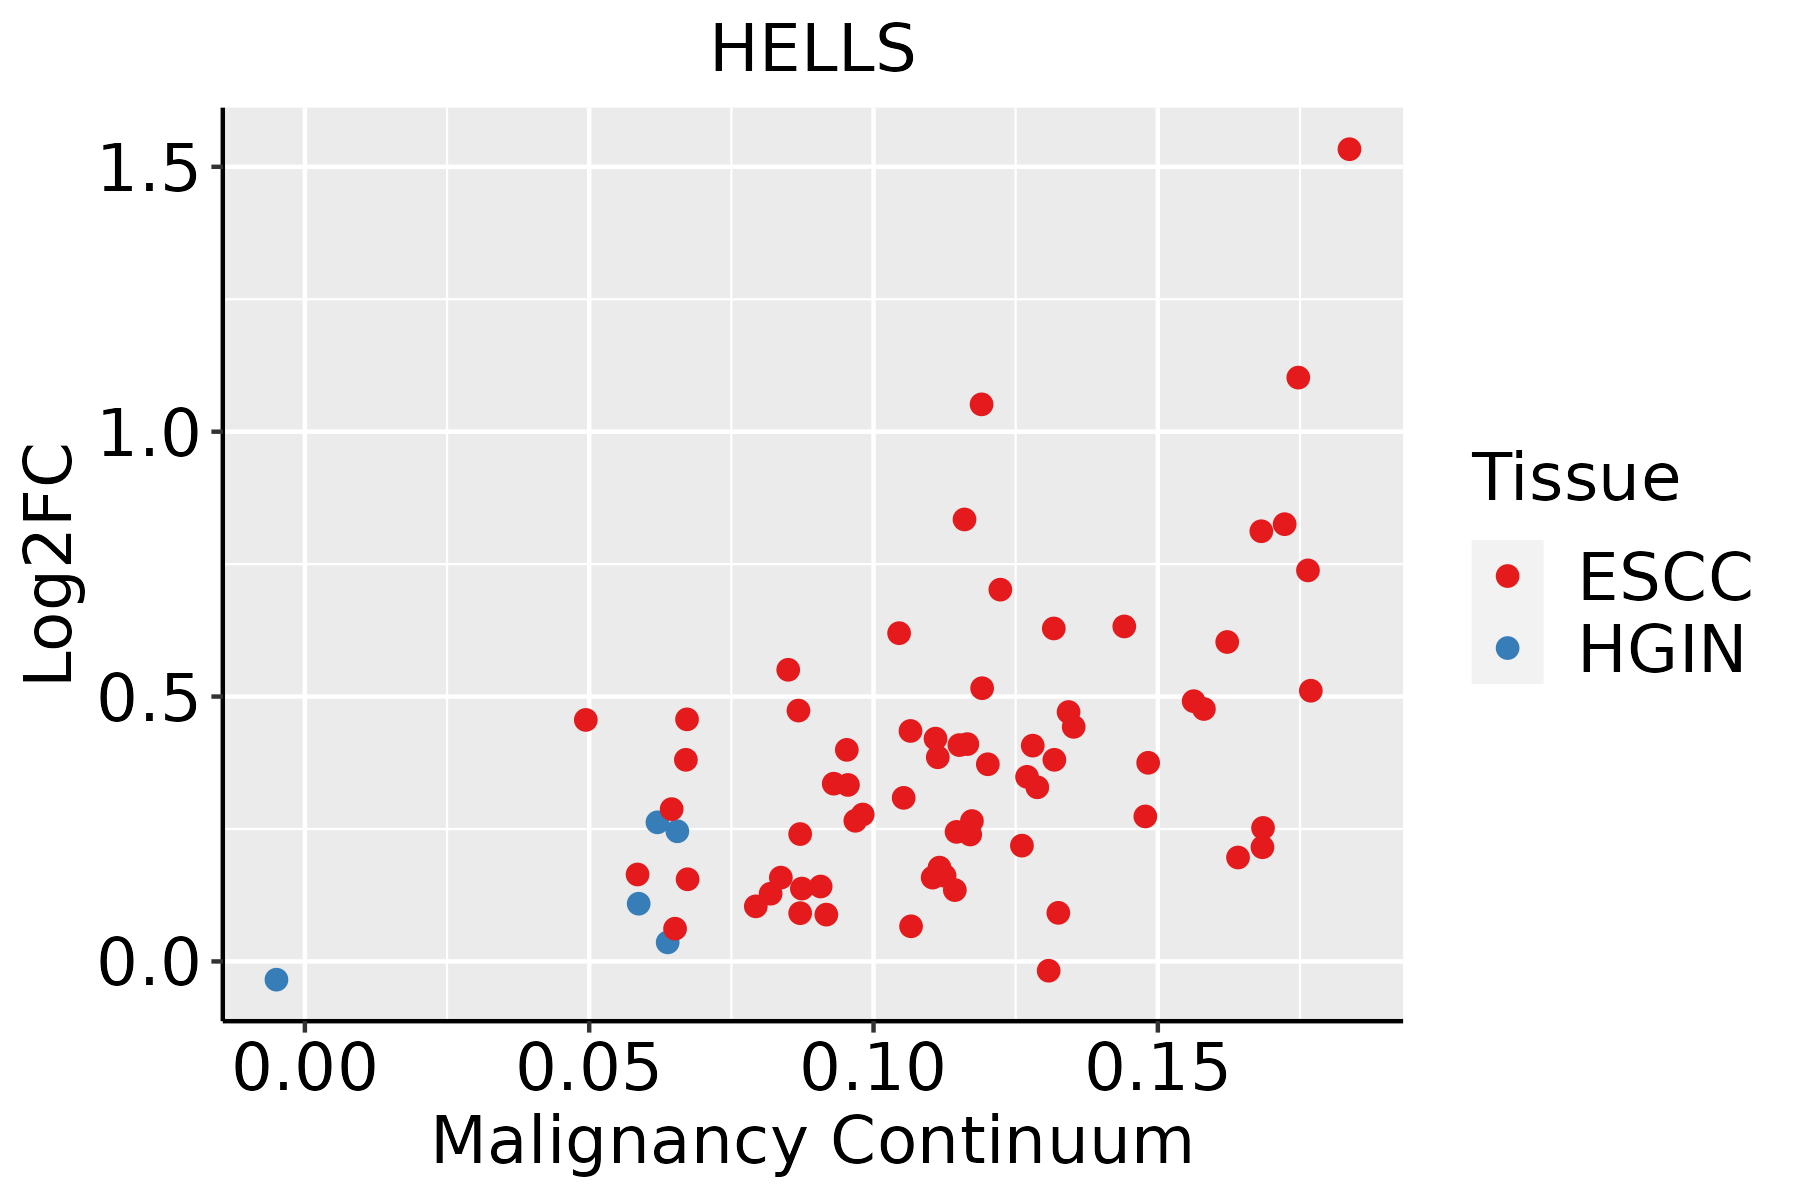 | ESCC: Esophageal squamous cell carcinoma |
| HGIN: High-grade intraepithelial neoplasias | ||
| LGIN: Low-grade intraepithelial neoplasias | ||
| Liver | 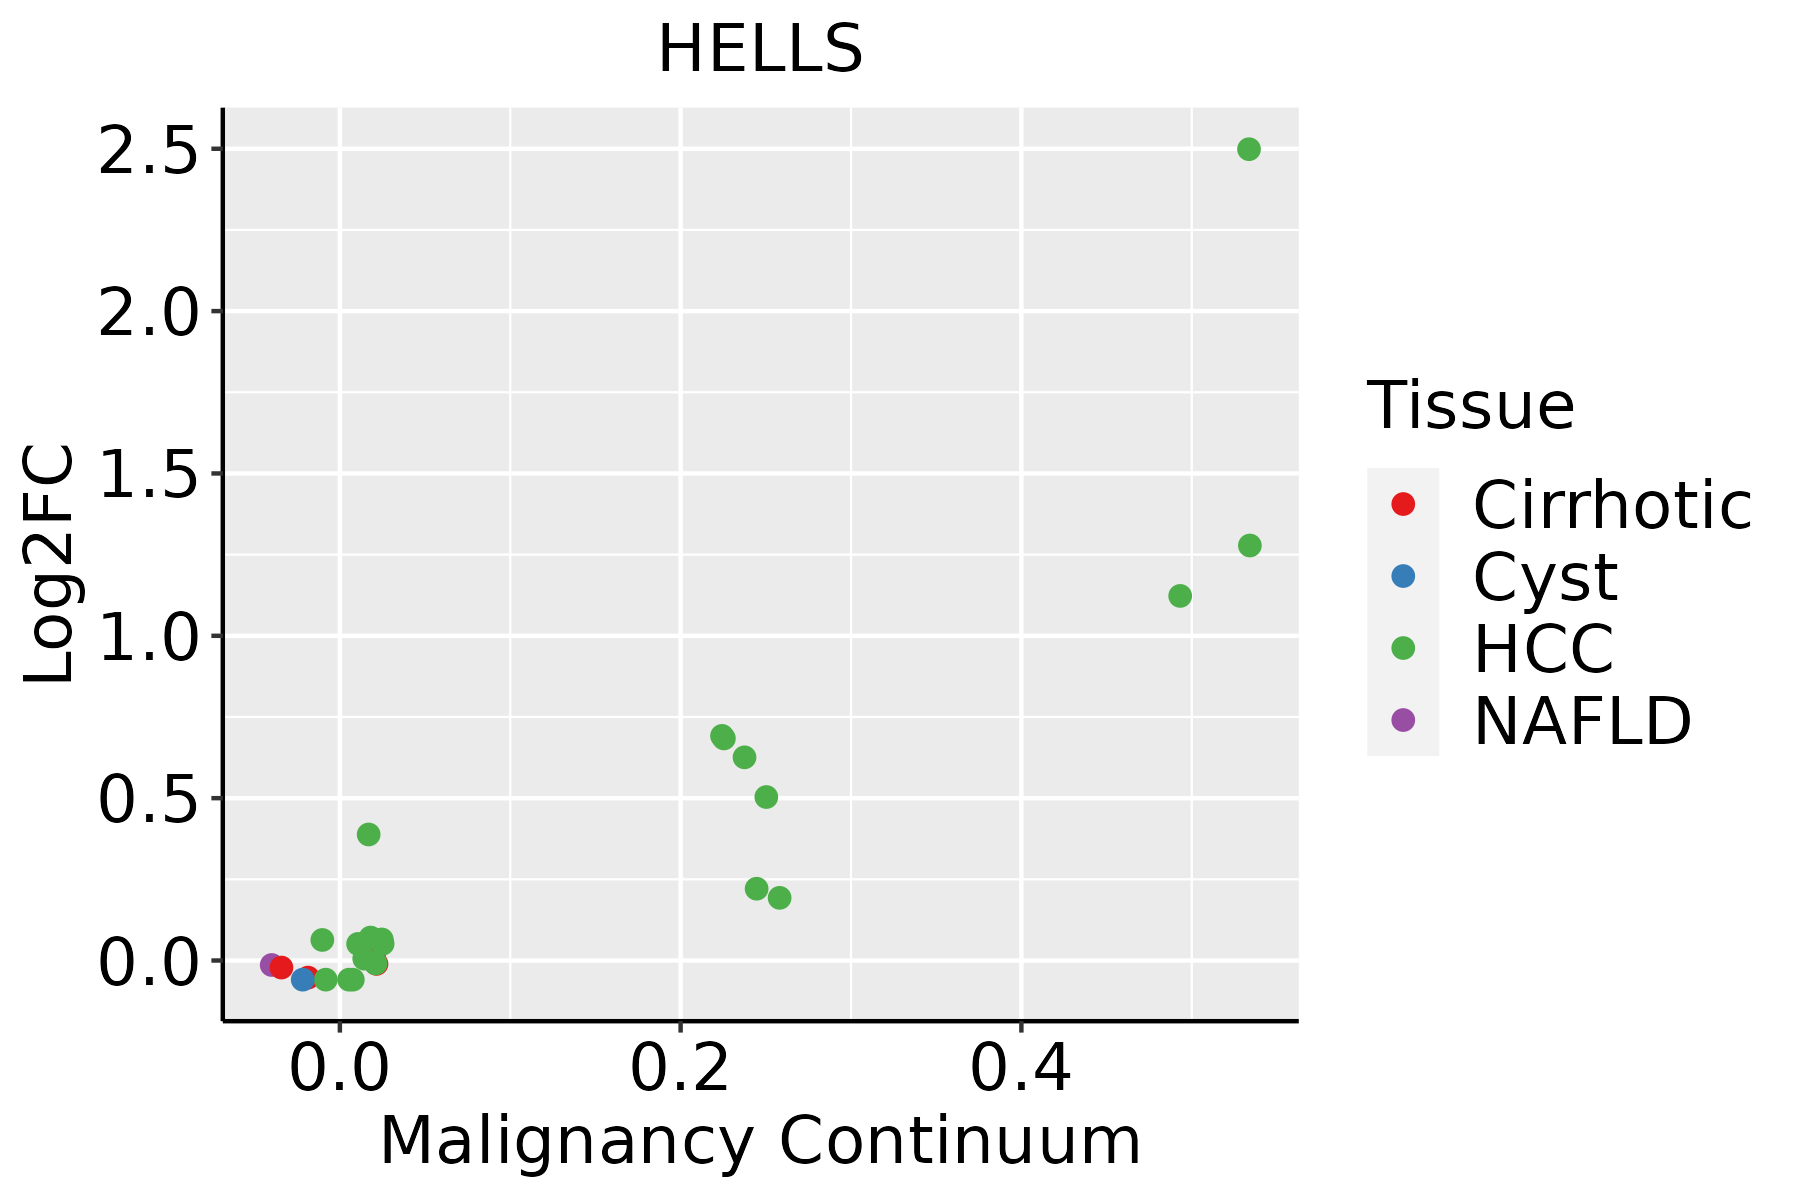 | HCC: Hepatocellular carcinoma |
| NAFLD: Non-alcoholic fatty liver disease | ||
| Oral Cavity | 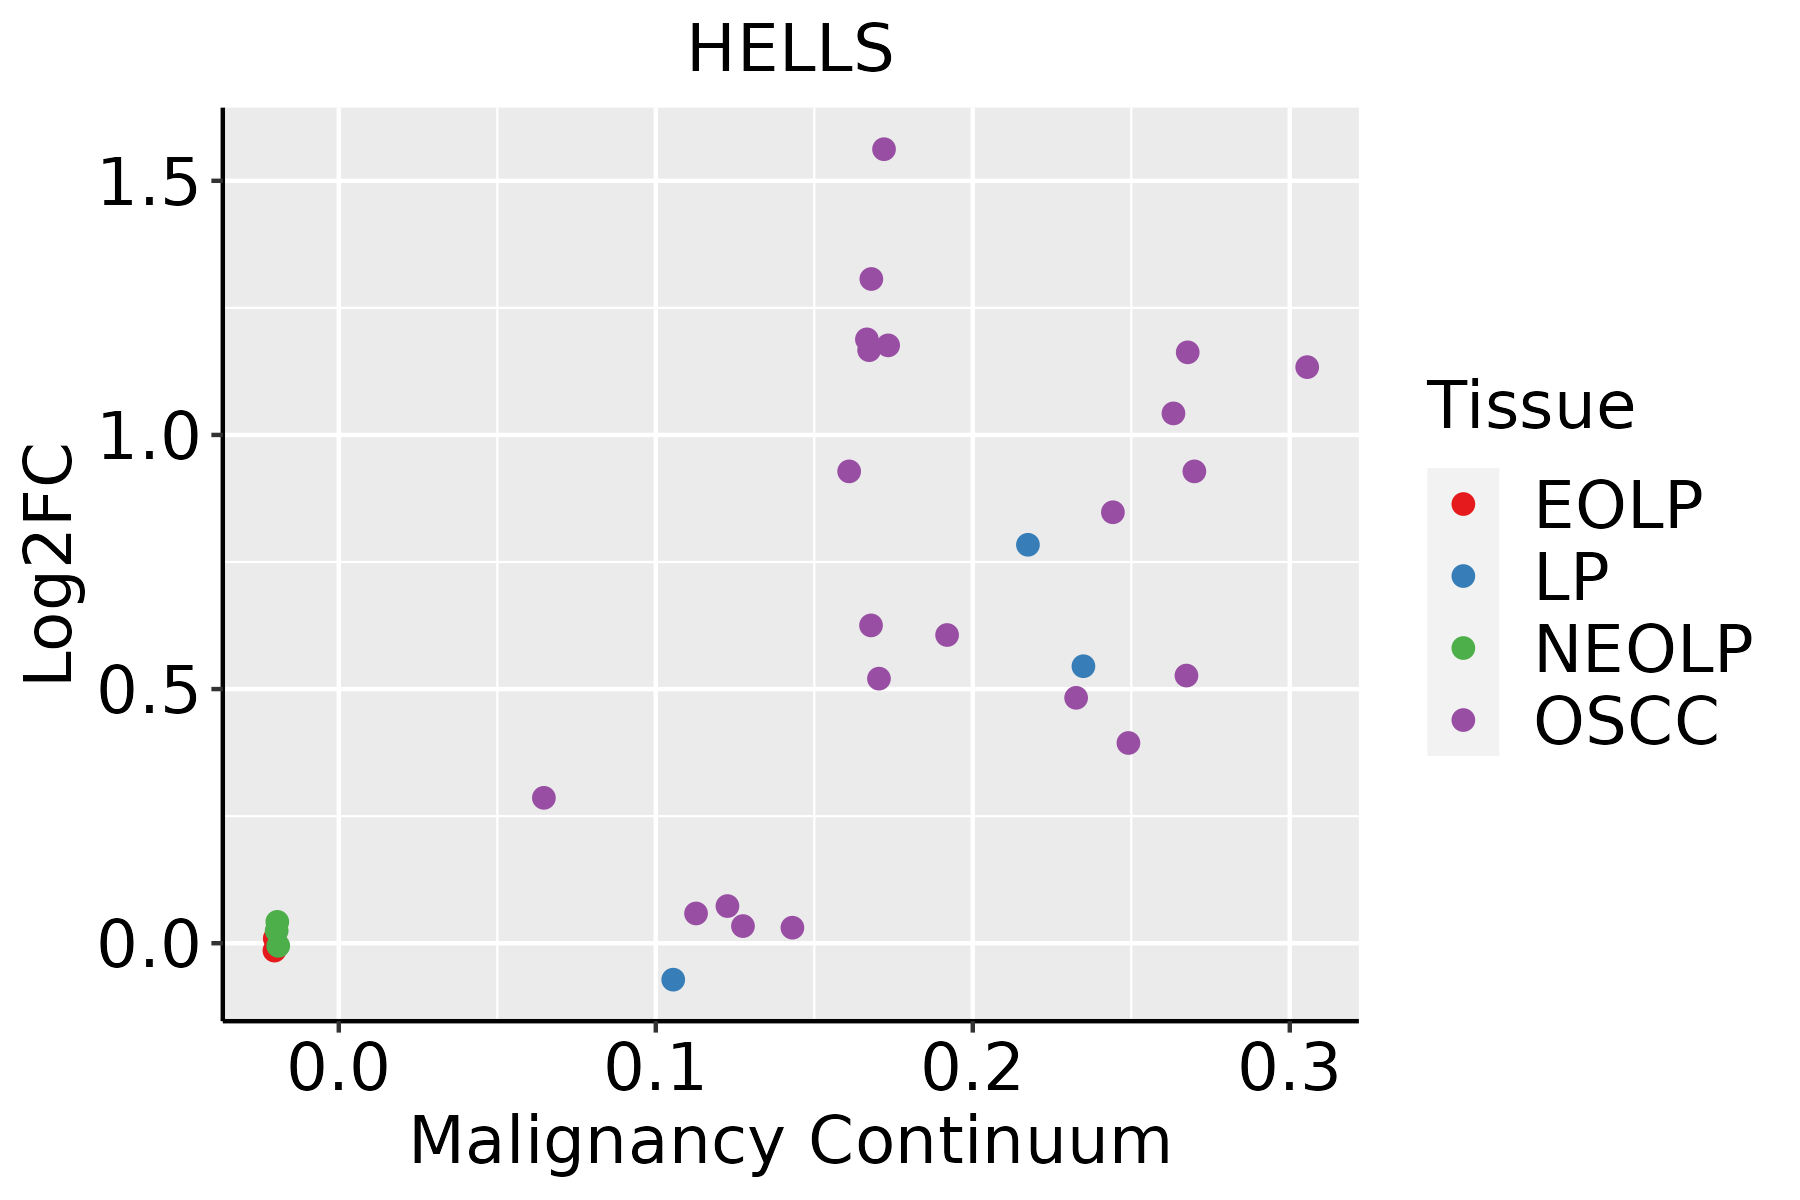 | EOLP: Erosive Oral lichen planus |
| LP: leukoplakia | ||
| NEOLP: Non-erosive oral lichen planus | ||
| OSCC: Oral squamous cell carcinoma | ||
| Skin | 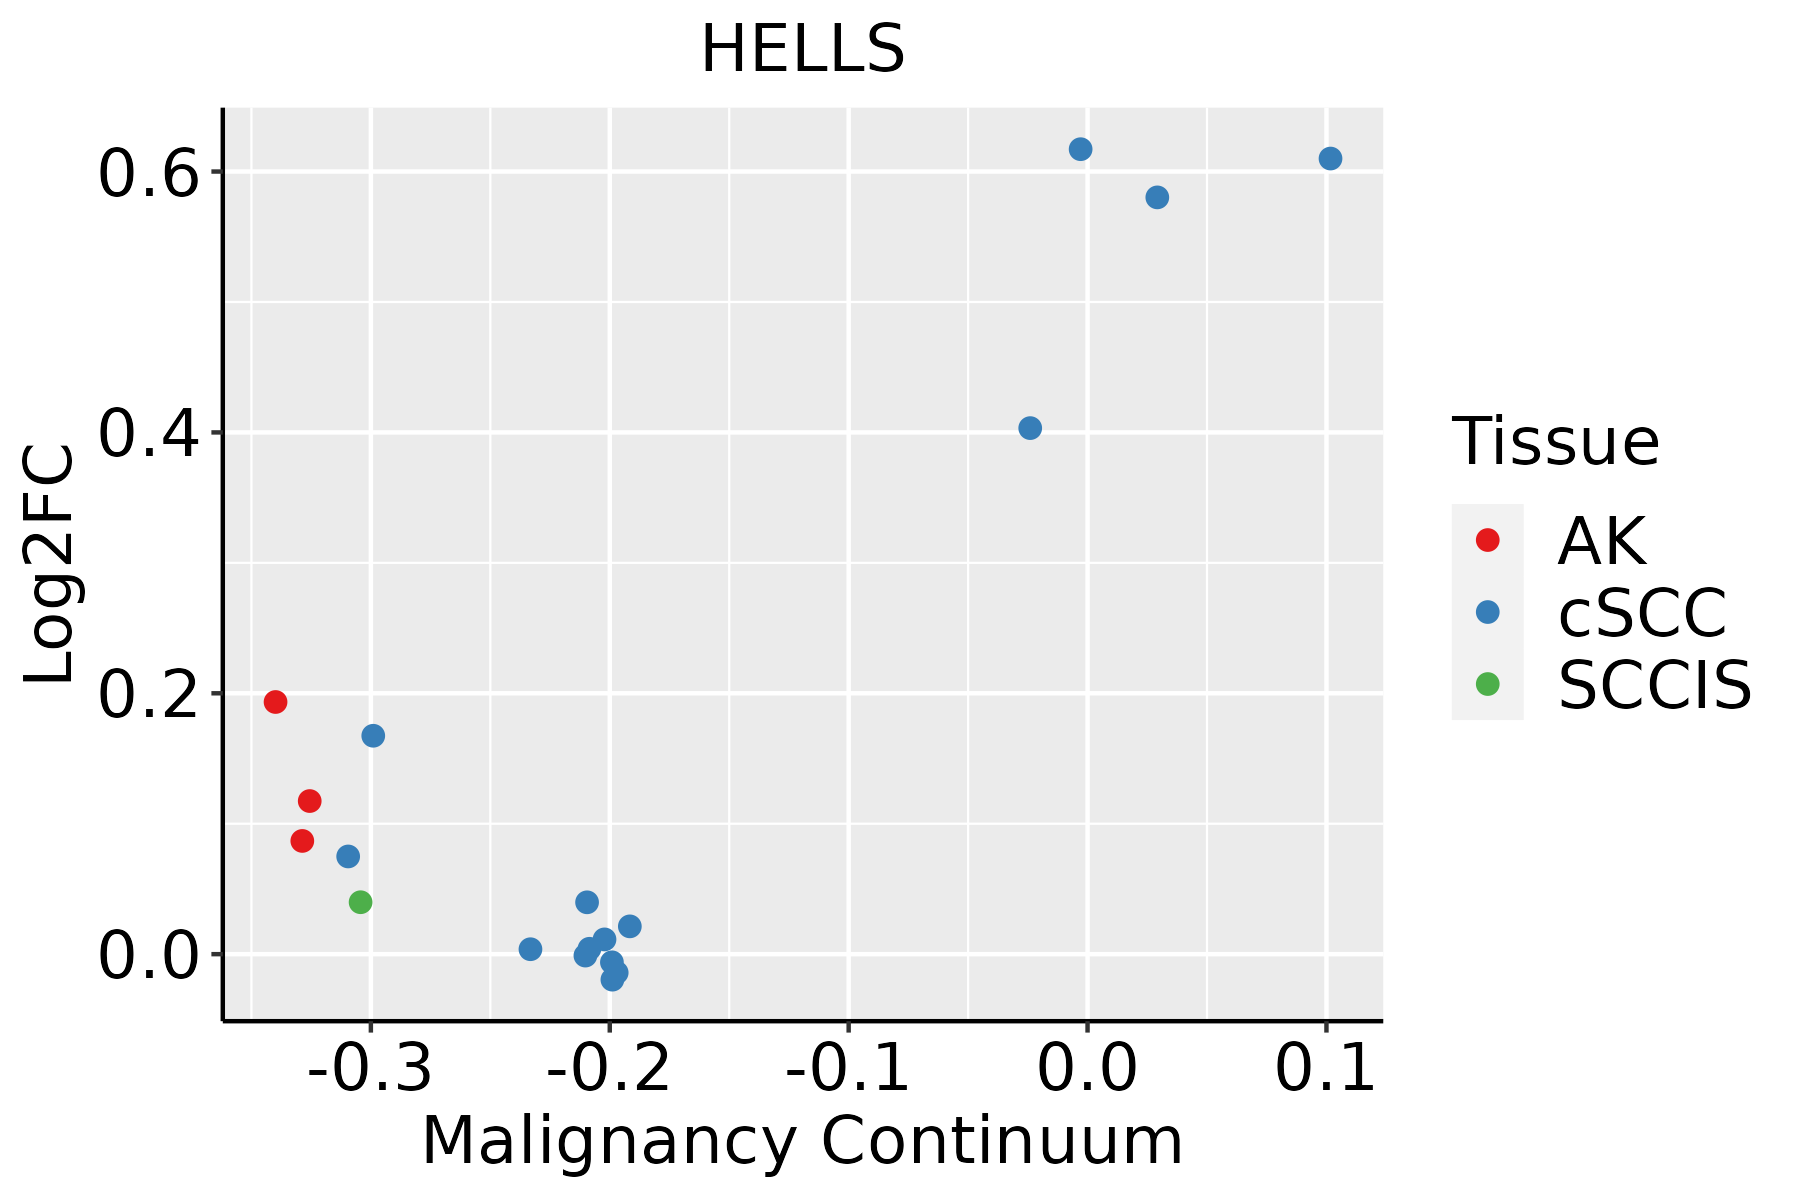 | AK: Actinic keratosis |
| cSCC: Cutaneous squamous cell carcinoma | ||
| SCCIS:squamous cell carcinoma in situ | ||
| Thyroid | 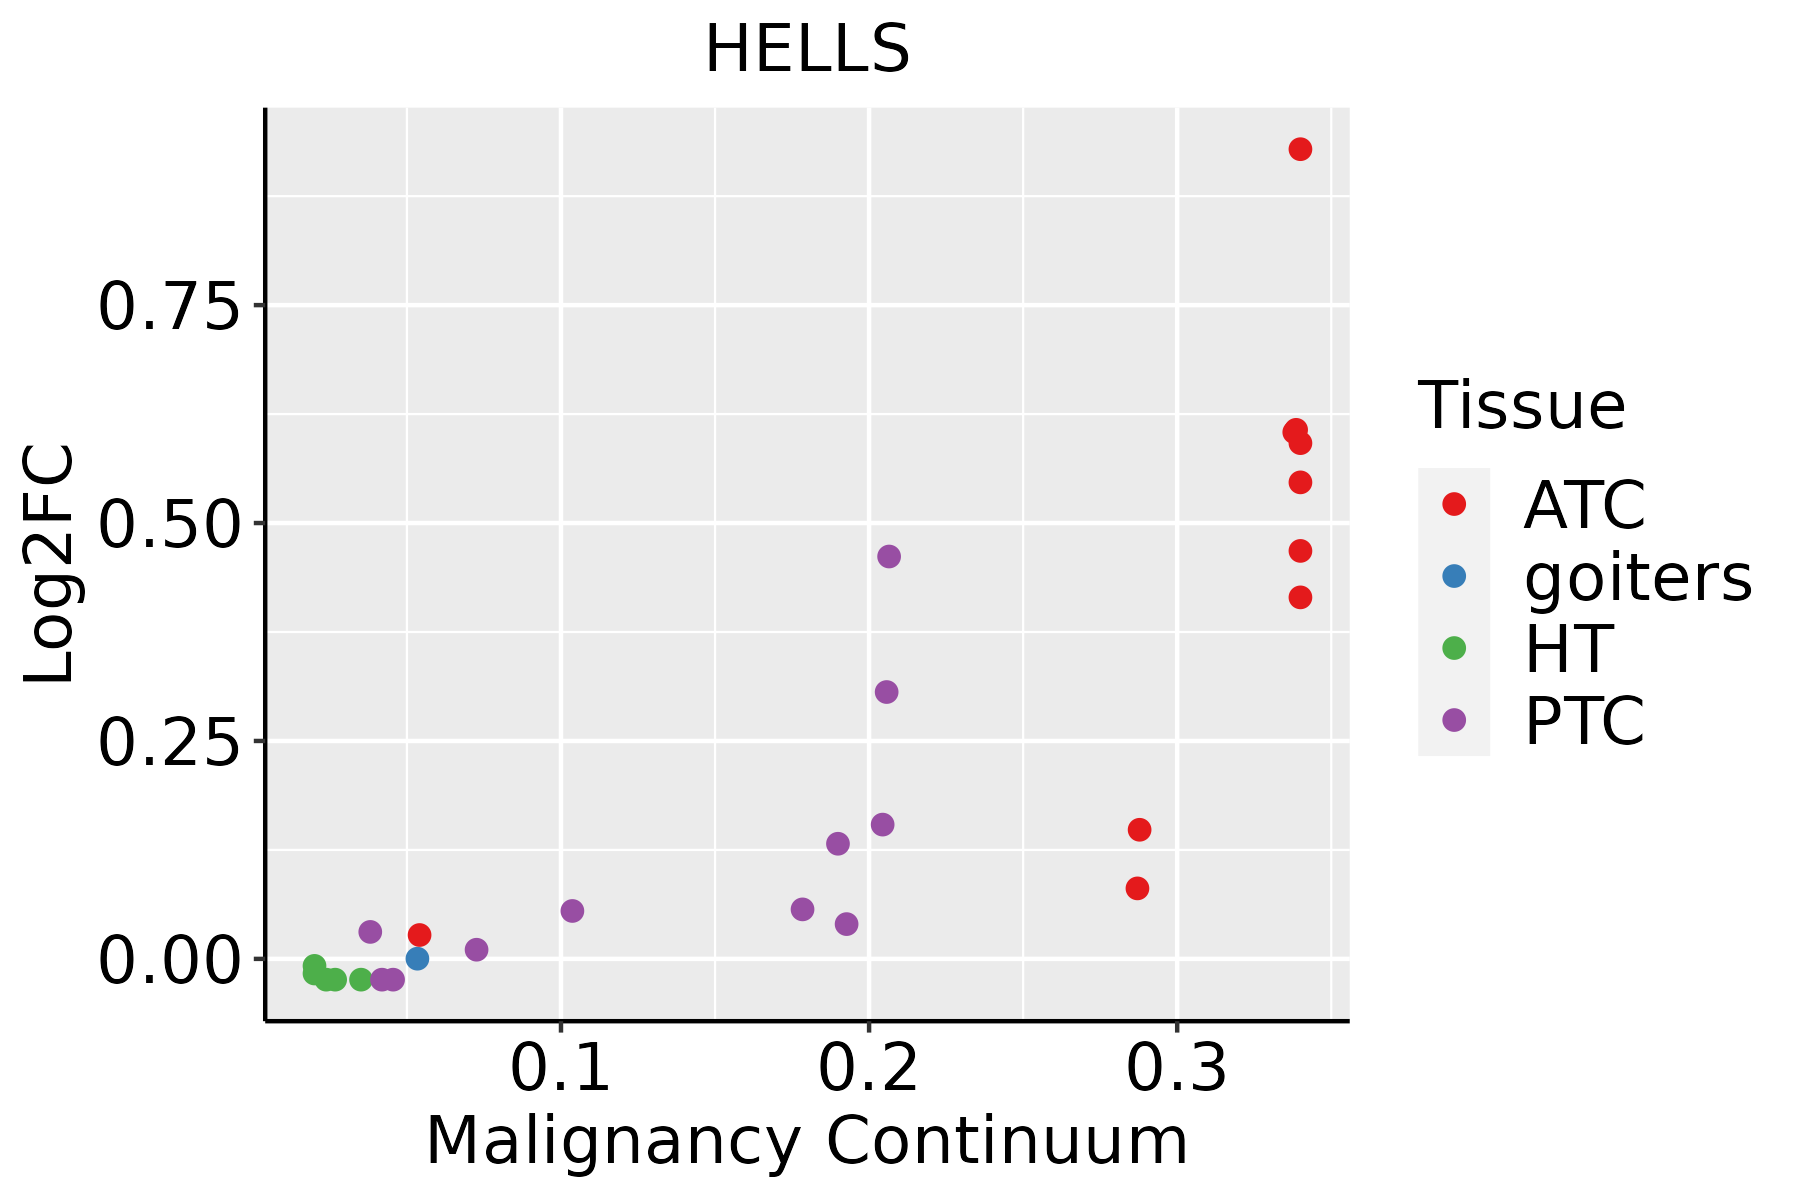 | ATC: Anaplastic thyroid cancer |
| HT: Hashimoto's thyroiditis | ||
| PTC: Papillary thyroid cancer |
| ∗log2FC in expression of this searched gene in stem-like cells from each diseased tissue sample relative to stem-like cells in normal samples in each tissue plotted against the malignancy continuum. Samples are colored based on if they are from different disease stage. |
Top |
Malignant transformation related pathway analysis |
| Find out the enriched GO biological processes and KEGG pathways involved in transition from healthy to precancer to cancer |
| Tissue | Disease Stage | Enriched GO biological Processes |
| Colorectum | AD |  |
| Colorectum | SER |  |
| Colorectum | MSS |  |
| Colorectum | MSI-H |  |
| Colorectum | FAP |  |
| ∗Top 15 enriched GO BP terms are showed in the bar plot of each disease state in each tissue. Each row represents a significant GO biological process which is colored according to the -log10(p.adjust). |
| Page: 1 2 3 4 5 6 7 8 9 |
| GO ID | Tissue | Disease Stage | Description | Gene Ratio | Bg Ratio | pvalue | p.adjust | Count |
| GO:0097193111 | Esophagus | ESCC | intrinsic apoptotic signaling pathway | 222/8552 | 288/18723 | 5.87e-28 | 2.02e-25 | 222 |
| GO:2001233111 | Esophagus | ESCC | regulation of apoptotic signaling pathway | 256/8552 | 356/18723 | 4.11e-24 | 1.04e-21 | 256 |
| GO:2001242111 | Esophagus | ESCC | regulation of intrinsic apoptotic signaling pathway | 128/8552 | 164/18723 | 1.75e-17 | 1.50e-15 | 128 |
| GO:2001234111 | Esophagus | ESCC | negative regulation of apoptotic signaling pathway | 161/8552 | 224/18723 | 1.24e-15 | 8.09e-14 | 161 |
| GO:2001243111 | Esophagus | ESCC | negative regulation of intrinsic apoptotic signaling pathway | 78/8552 | 98/18723 | 5.50e-12 | 2.10e-10 | 78 |
| GO:00434143 | Esophagus | ESCC | macromolecule methylation | 199/8552 | 316/18723 | 3.44e-10 | 9.57e-09 | 199 |
| GO:00322592 | Esophagus | ESCC | methylation | 222/8552 | 364/18723 | 2.26e-09 | 5.09e-08 | 222 |
| GO:000632517 | Esophagus | ESCC | chromatin organization | 240/8552 | 409/18723 | 6.52e-08 | 1.14e-06 | 240 |
| GO:00400295 | Esophagus | ESCC | regulation of gene expression, epigenetic | 74/8552 | 105/18723 | 2.24e-07 | 3.42e-06 | 74 |
| GO:00345081 | Esophagus | ESCC | centromere complex assembly | 25/8552 | 30/18723 | 2.45e-05 | 2.09e-04 | 25 |
| GO:199082316 | Esophagus | ESCC | response to leukemia inhibitory factor | 60/8552 | 95/18723 | 4.41e-04 | 2.48e-03 | 60 |
| GO:199083015 | Esophagus | ESCC | cellular response to leukemia inhibitory factor | 59/8552 | 94/18723 | 6.19e-04 | 3.32e-03 | 59 |
| GO:00708281 | Esophagus | ESCC | heterochromatin organization | 31/8552 | 46/18723 | 2.42e-03 | 1.06e-02 | 31 |
| GO:0031055 | Esophagus | ESCC | chromatin remodeling at centromere | 9/8552 | 10/18723 | 5.09e-03 | 1.92e-02 | 9 |
| GO:0045814 | Esophagus | ESCC | negative regulation of gene expression, epigenetic | 32/8552 | 50/18723 | 6.90e-03 | 2.52e-02 | 32 |
| GO:00016559 | Esophagus | ESCC | urogenital system development | 177/8552 | 338/18723 | 7.51e-03 | 2.69e-02 | 177 |
| GO:0006304 | Esophagus | ESCC | DNA modification | 68/8552 | 120/18723 | 9.95e-03 | 3.42e-02 | 68 |
| GO:200123322 | Liver | HCC | regulation of apoptotic signaling pathway | 226/7958 | 356/18723 | 7.26e-16 | 5.68e-14 | 226 |
| GO:009719322 | Liver | HCC | intrinsic apoptotic signaling pathway | 184/7958 | 288/18723 | 1.50e-13 | 8.32e-12 | 184 |
| GO:200123412 | Liver | HCC | negative regulation of apoptotic signaling pathway | 145/7958 | 224/18723 | 1.33e-11 | 5.36e-10 | 145 |
| Page: 1 2 3 4 5 6 |
| Pathway ID | Tissue | Disease Stage | Description | Gene Ratio | Bg Ratio | pvalue | p.adjust | qvalue | Count |
| Page: 1 |
Top |
Cell-cell communication analysis |
| Identification of potential cell-cell interactions between two cell types and their ligand-receptor pairs for different disease states |
| Ligand | Receptor | LRpair | Pathway | Tissue | Disease Stage |
| Page: 1 |
Top |
Single-cell gene regulatory network inference analysis |
| Find out the significant the regulons (TFs) and the target genes of each regulon across cell types for different disease states |
| TF | Cell Type | Tissue | Disease Stage | Target Gene | RSS | Regulon Activity |
| ∗The dot plots of a searched regulon are shown for all cell subpopulations in each disease state of each tissue based on the regulon specific score inferred using pySCENIC and by calculating the average expression. |
| Page: 1 |
Top |
Somatic mutation of malignant transformation related genes |
| Annotation of somatic variants for genes involved in malignant transformation |
| Hugo Symbol | Variant Class | Variant Classification | dbSNP RS | HGVSc | HGVSp | HGVSp Short | SWISSPROT | BIOTYPE | SIFT | PolyPhen | Tumor Sample Barcode | Tissue | Histology | Sex | Age | Stage | Therapy Types | Drugs | Outcome |
| HELLS | SNV | Missense_Mutation | c.671N>A | p.Arg224Gln | p.R224Q | protein_coding | deleterious(0) | possibly_damaging(0.834) | TCGA-A8-A09Z-01 | Breast | breast invasive carcinoma | Female | >=65 | I/II | Unknown | Unknown | SD | ||
| HELLS | SNV | Missense_Mutation | c.2345N>T | p.Ala782Val | p.A782V | protein_coding | deleterious(0) | probably_damaging(0.995) | TCGA-A8-A09Z-01 | Breast | breast invasive carcinoma | Female | >=65 | I/II | Unknown | Unknown | SD | ||
| HELLS | SNV | Missense_Mutation | novel | c.151N>C | p.Lys51Gln | p.K51Q | protein_coding | tolerated(0.15) | benign(0.031) | TCGA-AN-A046-01 | Breast | breast invasive carcinoma | Female | >=65 | I/II | Unknown | Unknown | SD | |
| HELLS | SNV | Missense_Mutation | novel | c.1084N>G | p.Met362Val | p.M362V | protein_coding | deleterious(0.02) | benign(0.09) | TCGA-AN-A046-01 | Breast | breast invasive carcinoma | Female | >=65 | I/II | Unknown | Unknown | SD | |
| HELLS | SNV | Missense_Mutation | novel | c.1801N>A | p.Glu601Lys | p.E601K | protein_coding | tolerated(0.4) | benign(0.389) | TCGA-OL-A5RW-01 | Breast | breast invasive carcinoma | Female | <65 | I/II | Chemotherapy | adriamycin | CR | |
| HELLS | SNV | Missense_Mutation | c.2546N>A | p.Arg849Gln | p.R849Q | protein_coding | deleterious(0) | benign(0.292) | TCGA-Q1-A5R2-01 | Cervix | cervical & endocervical cancer | Female | <65 | I/II | Chemotherapy | cisplatin | PR | ||
| HELLS | SNV | Missense_Mutation | novel | c.288N>C | p.Lys96Asn | p.K96N | protein_coding | deleterious(0.02) | possibly_damaging(0.877) | TCGA-ZJ-AAXI-01 | Cervix | cervical & endocervical cancer | Female | >=65 | I/II | Unknown | Unknown | SD | |
| HELLS | SNV | Missense_Mutation | c.2300N>A | p.Arg767His | p.R767H | protein_coding | deleterious(0) | probably_damaging(1) | TCGA-AA-A010-01 | Colorectum | colon adenocarcinoma | Female | <65 | I/II | Chemotherapy | folinic | CR | ||
| HELLS | SNV | Missense_Mutation | rs772237527 | c.2126N>T | p.Thr709Met | p.T709M | protein_coding | tolerated(0.12) | benign(0.02) | TCGA-AA-A022-01 | Colorectum | colon adenocarcinoma | Female | >=65 | I/II | Unknown | Unknown | SD | |
| HELLS | SNV | Missense_Mutation | novel | c.295N>C | p.Lys99Gln | p.K99Q | protein_coding | tolerated(0.17) | possibly_damaging(0.691) | TCGA-CA-6717-01 | Colorectum | colon adenocarcinoma | Male | <65 | I/II | Chemotherapy | oxaliplatin | CR |
| Page: 1 2 3 4 5 6 7 8 9 |
Top |
Related drugs of malignant transformation related genes |
| Identification of chemicals and drugs interact with genes involved in malignant transfromation |
| (DGIdb 4.0) |
| Entrez ID | Symbol | Category | Interaction Types | Drug Claim Name | Drug Name | PMIDs |
| Page: 1 |

Copyright 2023-Present -The University of Texas Health Science Center at Houston |