
|
|||||
|
 | |
| |
| |
| |
| |
| |
|
Gene: HCFC1R1 |
Gene summary for HCFC1R1 |
| Gene information | Species | Human | Gene symbol | HCFC1R1 | Gene ID | 54985 |
| Gene name | host cell factor C1 regulator 1 | |
| Gene Alias | HPIP | |
| Cytomap | 16p13.3 | |
| Gene Type | protein-coding | GO ID | GO:0005575 | UniProtAcc | Q9NWW0 |
Top |
Malignant transformation analysis |
| Identification of the aberrant gene expression in precancerous and cancerous lesions by comparing the gene expression of stem-like cells in diseased tissues with normal stem cells |
| Entrez ID | Symbol | Replicates | Species | Organ | Tissue | Adj P-value | Log2FC | Malignancy |
| 54985 | HCFC1R1 | P104T-E | Human | Esophagus | ESCC | 1.44e-02 | 6.28e-01 | 0.0931 |
| 54985 | HCFC1R1 | P107T-E | Human | Esophagus | ESCC | 5.24e-70 | 1.56e+00 | 0.171 |
| 54985 | HCFC1R1 | P126T-E | Human | Esophagus | ESCC | 3.90e-15 | 1.57e+00 | 0.1125 |
| 54985 | HCFC1R1 | P127T-E | Human | Esophagus | ESCC | 2.28e-27 | 4.52e-01 | 0.0826 |
| 54985 | HCFC1R1 | P128T-E | Human | Esophagus | ESCC | 4.74e-41 | 1.36e+00 | 0.1241 |
| 54985 | HCFC1R1 | P130T-E | Human | Esophagus | ESCC | 1.43e-70 | 1.68e+00 | 0.1676 |
| 54985 | HCFC1R1 | S43 | Human | Liver | Cirrhotic | 4.93e-12 | -3.16e-01 | -0.0187 |
| 54985 | HCFC1R1 | HCC1_Meng | Human | Liver | HCC | 1.82e-29 | -2.72e-01 | 0.0246 |
| 54985 | HCFC1R1 | HCC2_Meng | Human | Liver | HCC | 2.29e-31 | 5.03e-02 | 0.0107 |
| 54985 | HCFC1R1 | cirrhotic1 | Human | Liver | Cirrhotic | 5.04e-12 | 2.49e-01 | 0.0202 |
| 54985 | HCFC1R1 | cirrhotic2 | Human | Liver | Cirrhotic | 5.41e-09 | 1.13e-01 | 0.0201 |
| 54985 | HCFC1R1 | cirrhotic3 | Human | Liver | Cirrhotic | 9.07e-20 | 3.30e-01 | 0.0215 |
| 54985 | HCFC1R1 | Pt13.b | Human | Liver | HCC | 2.29e-10 | -2.38e-03 | 0.0251 |
| 54985 | HCFC1R1 | Pt14.b | Human | Liver | HCC | 6.21e-05 | 1.39e-01 | 0.018 |
| 54985 | HCFC1R1 | S014 | Human | Liver | HCC | 2.13e-11 | 6.76e-01 | 0.2254 |
| 54985 | HCFC1R1 | S015 | Human | Liver | HCC | 4.91e-11 | 8.03e-01 | 0.2375 |
| 54985 | HCFC1R1 | S016 | Human | Liver | HCC | 9.17e-16 | 7.38e-01 | 0.2243 |
| 54985 | HCFC1R1 | C04 | Human | Oral cavity | OSCC | 4.76e-25 | 1.60e+00 | 0.2633 |
| 54985 | HCFC1R1 | C21 | Human | Oral cavity | OSCC | 3.74e-52 | 2.46e+00 | 0.2678 |
| 54985 | HCFC1R1 | C30 | Human | Oral cavity | OSCC | 1.03e-39 | 2.18e+00 | 0.3055 |
| Page: 1 2 3 4 5 6 7 |
| Tissue | Expression Dynamics | Abbreviation |
| Endometrium | 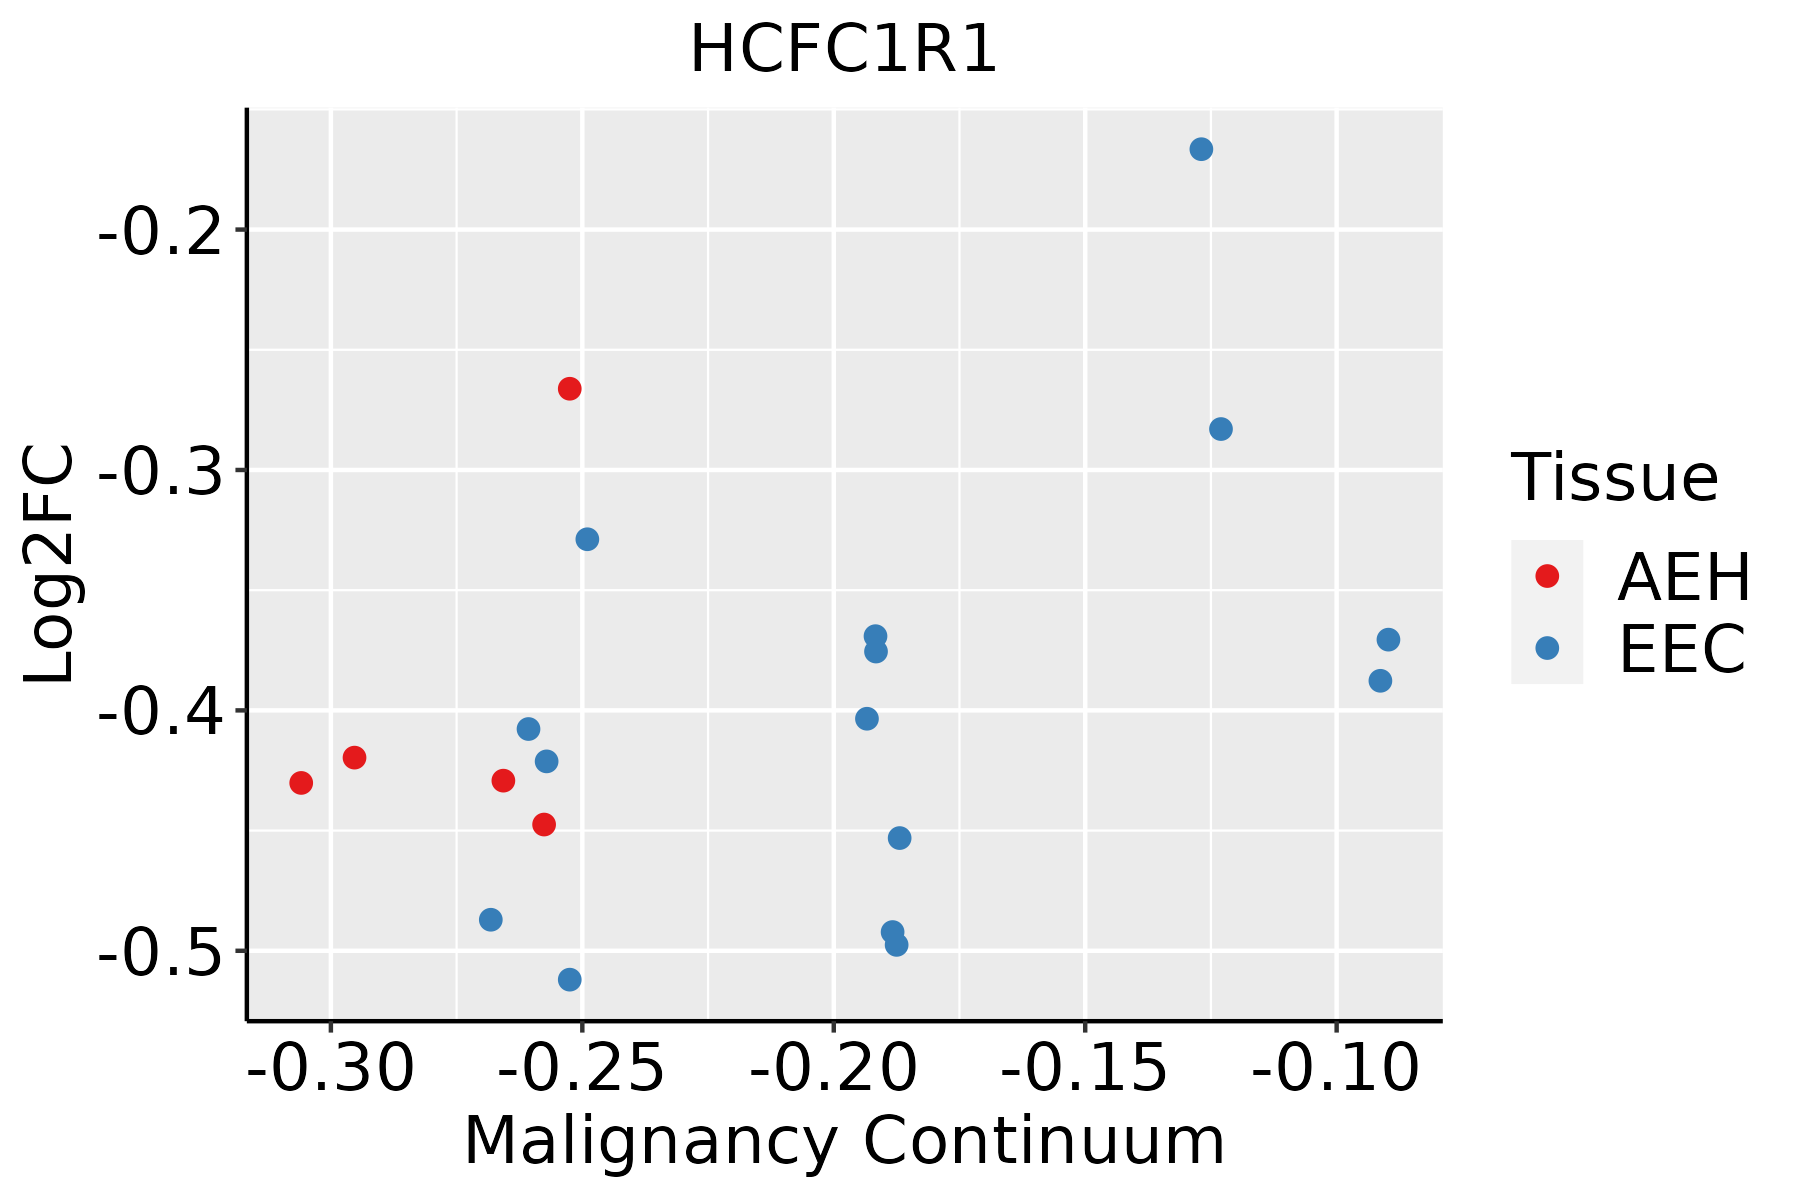 | AEH: Atypical endometrial hyperplasia |
| EEC: Endometrioid Cancer | ||
| Esophagus | 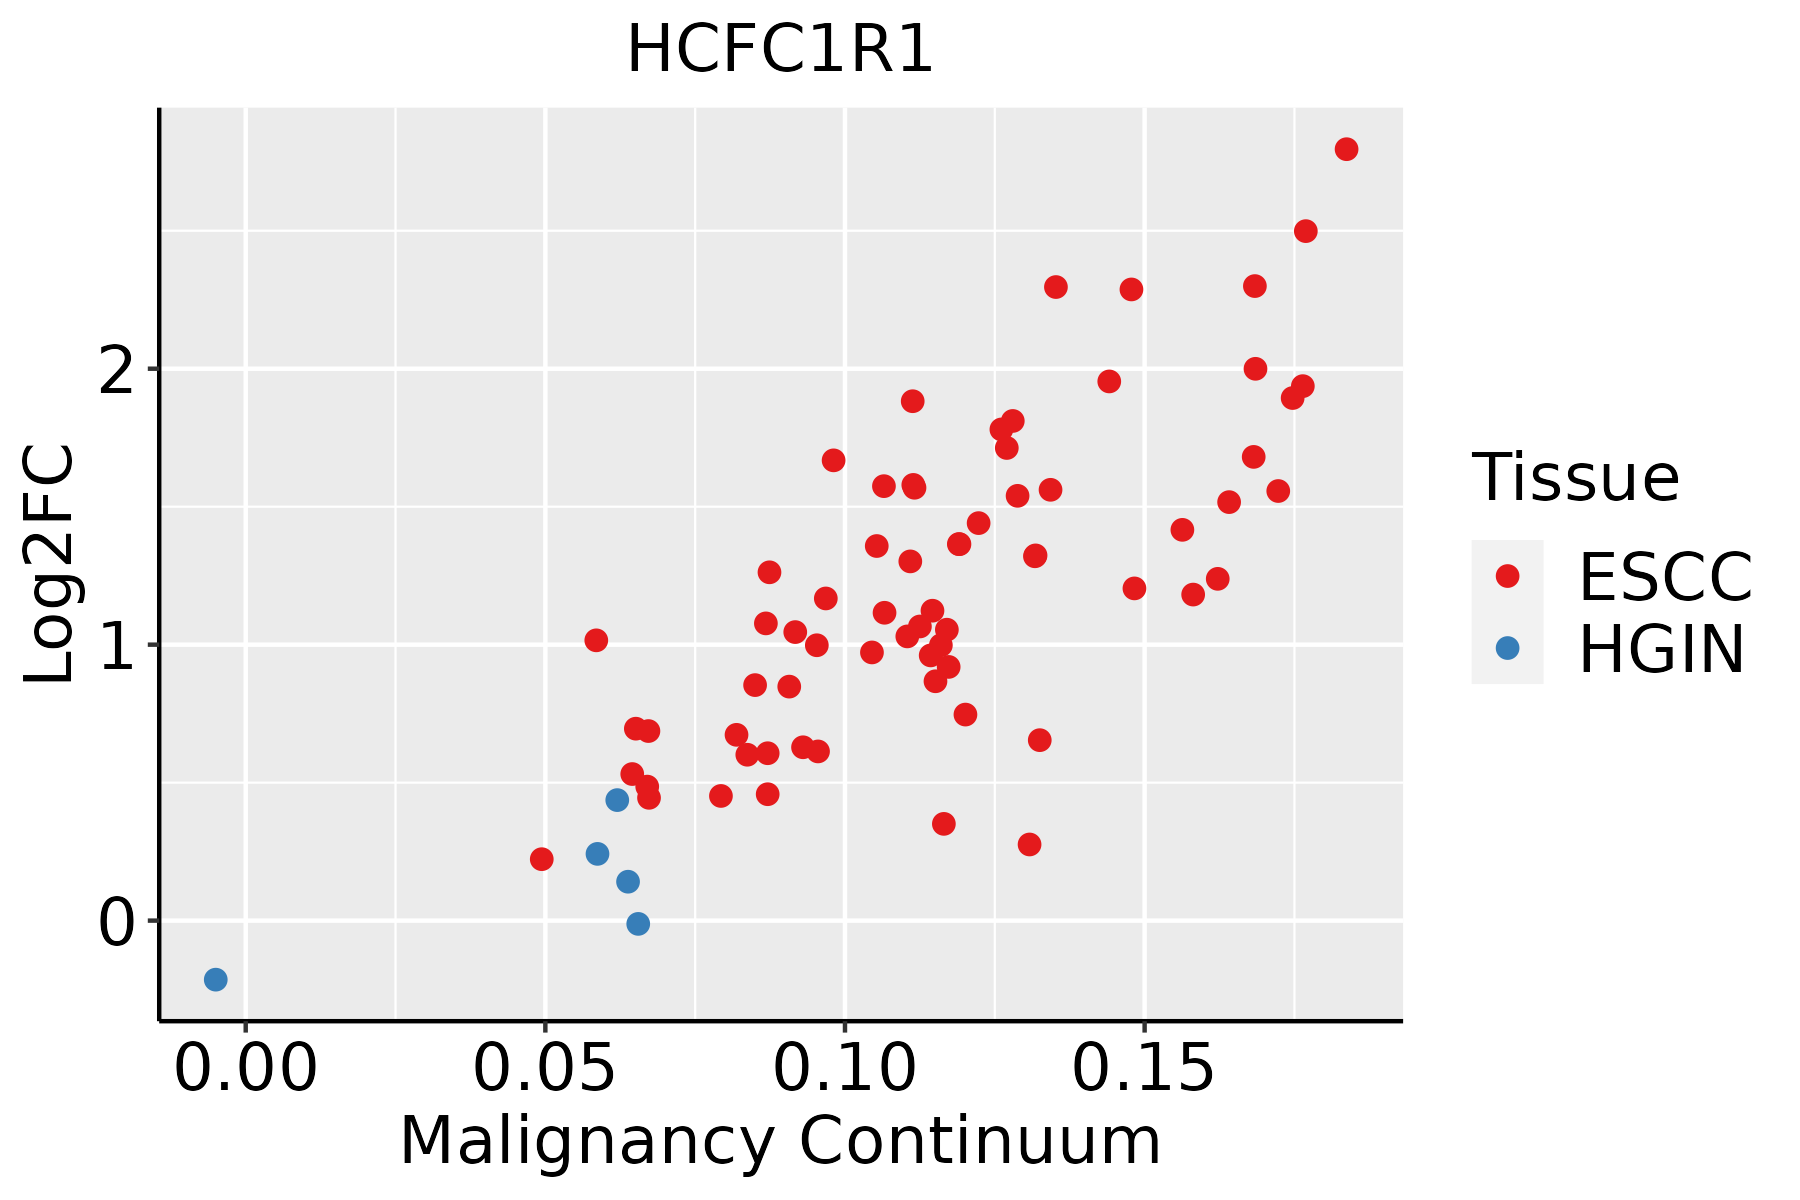 | ESCC: Esophageal squamous cell carcinoma |
| HGIN: High-grade intraepithelial neoplasias | ||
| LGIN: Low-grade intraepithelial neoplasias | ||
| Liver | 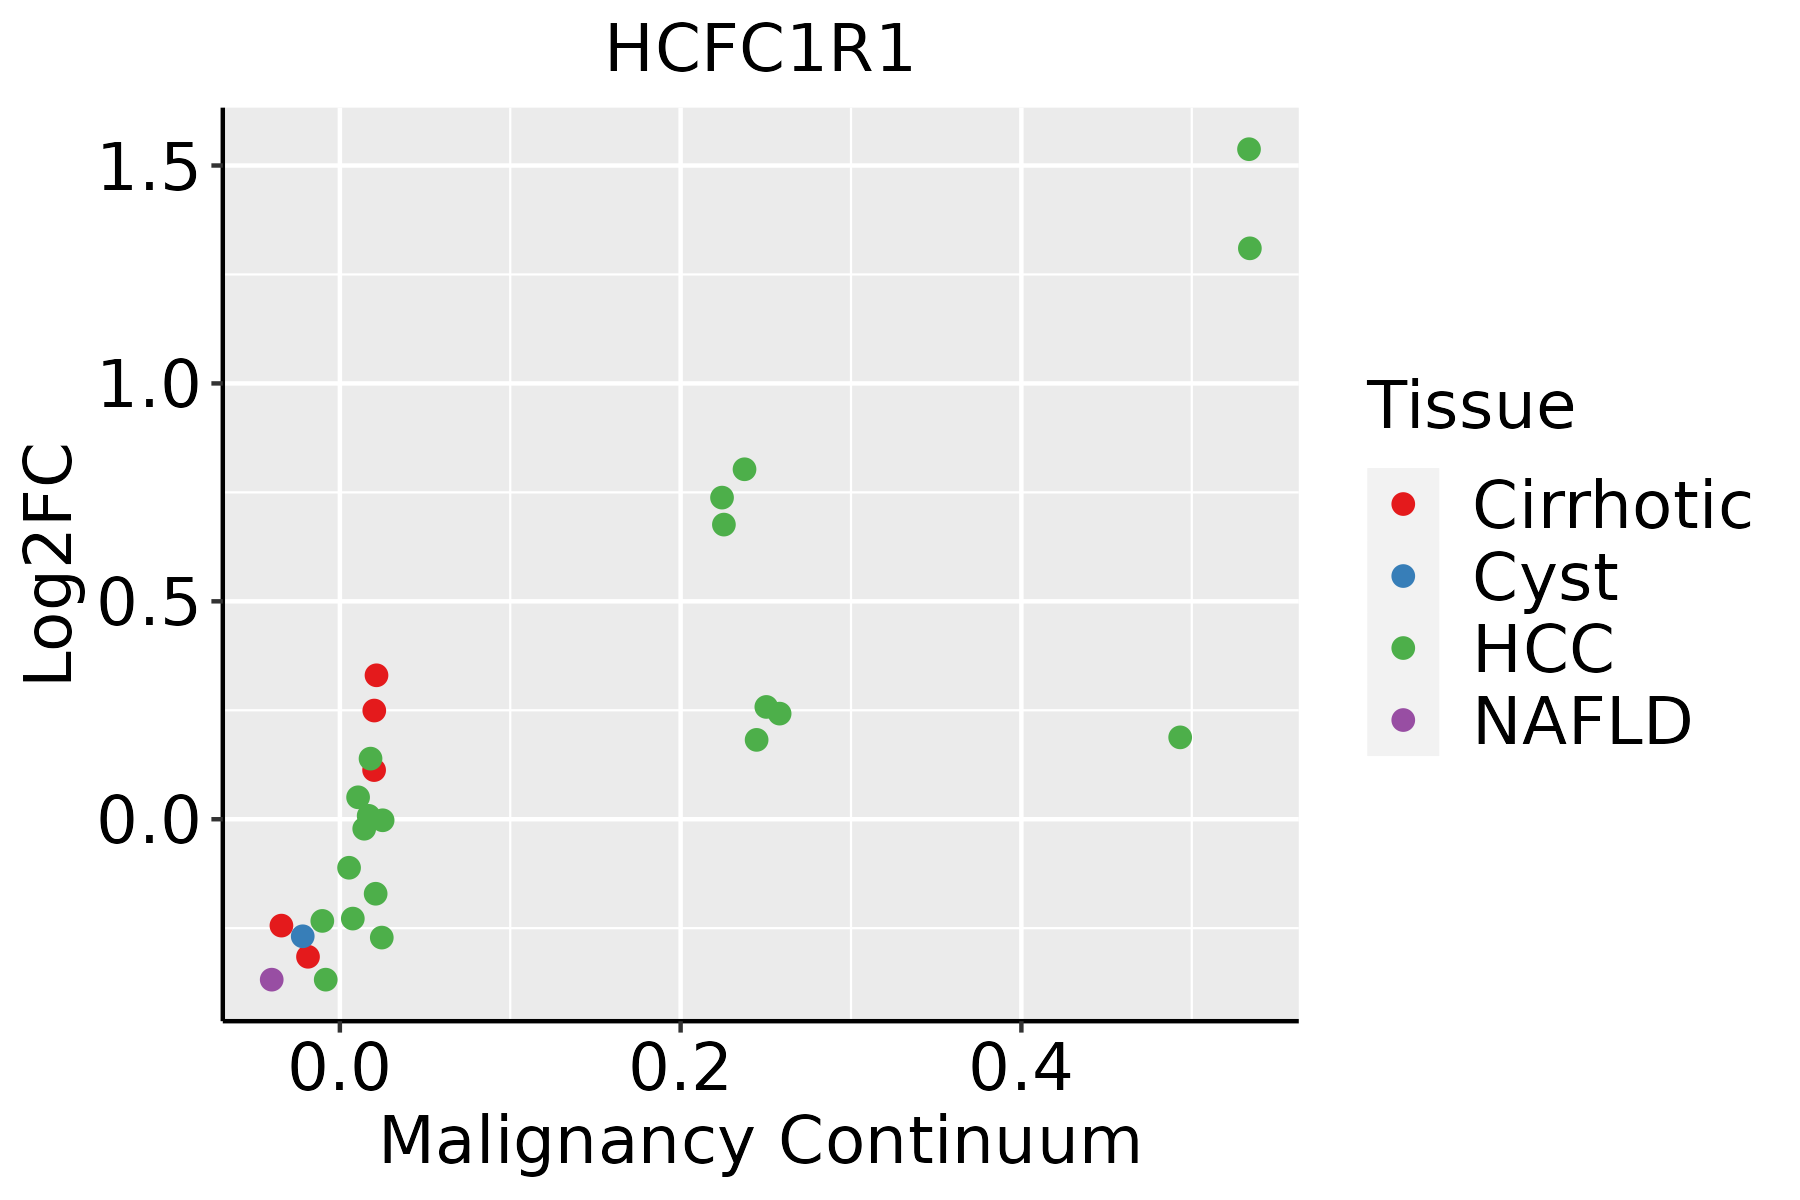 | HCC: Hepatocellular carcinoma |
| NAFLD: Non-alcoholic fatty liver disease | ||
| Oral Cavity |  | EOLP: Erosive Oral lichen planus |
| LP: leukoplakia | ||
| NEOLP: Non-erosive oral lichen planus | ||
| OSCC: Oral squamous cell carcinoma | ||
| Skin | 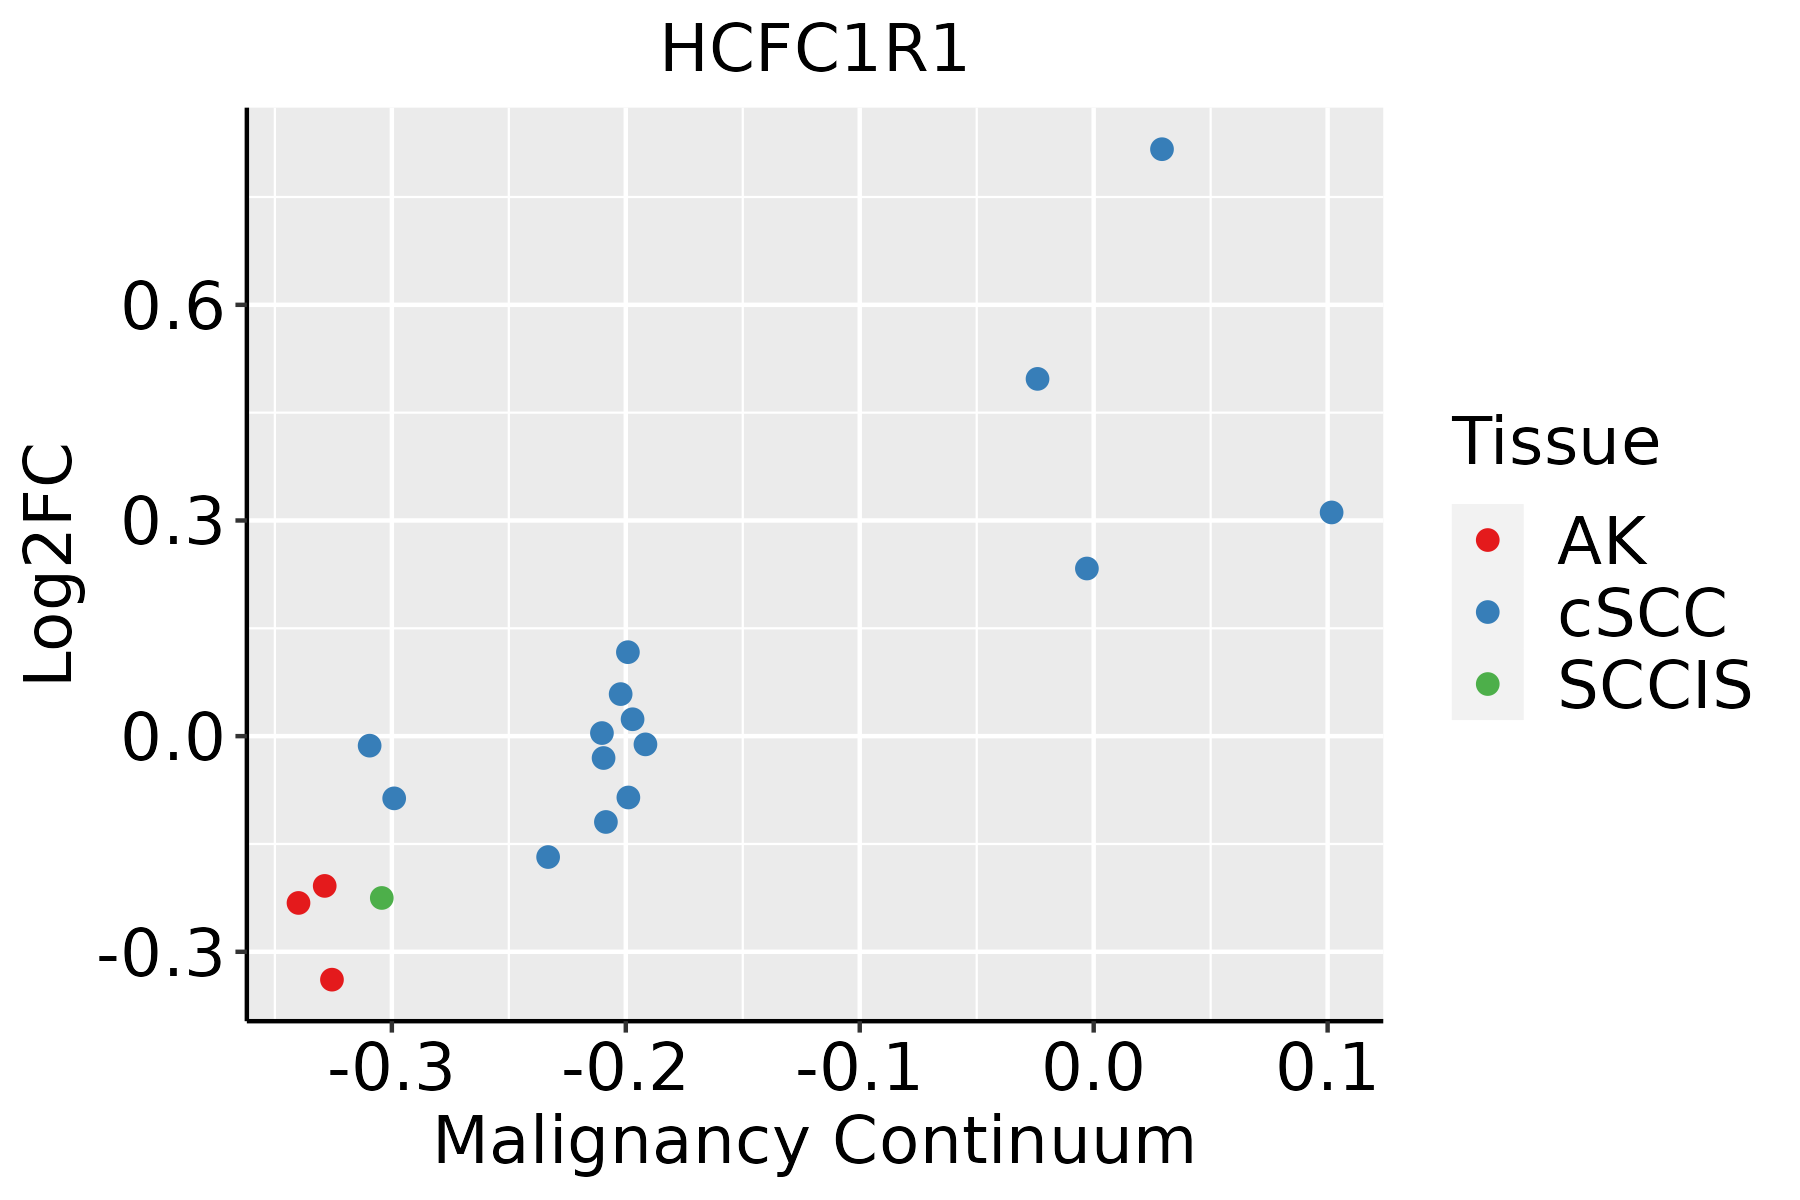 | AK: Actinic keratosis |
| cSCC: Cutaneous squamous cell carcinoma | ||
| SCCIS:squamous cell carcinoma in situ | ||
| Thyroid | 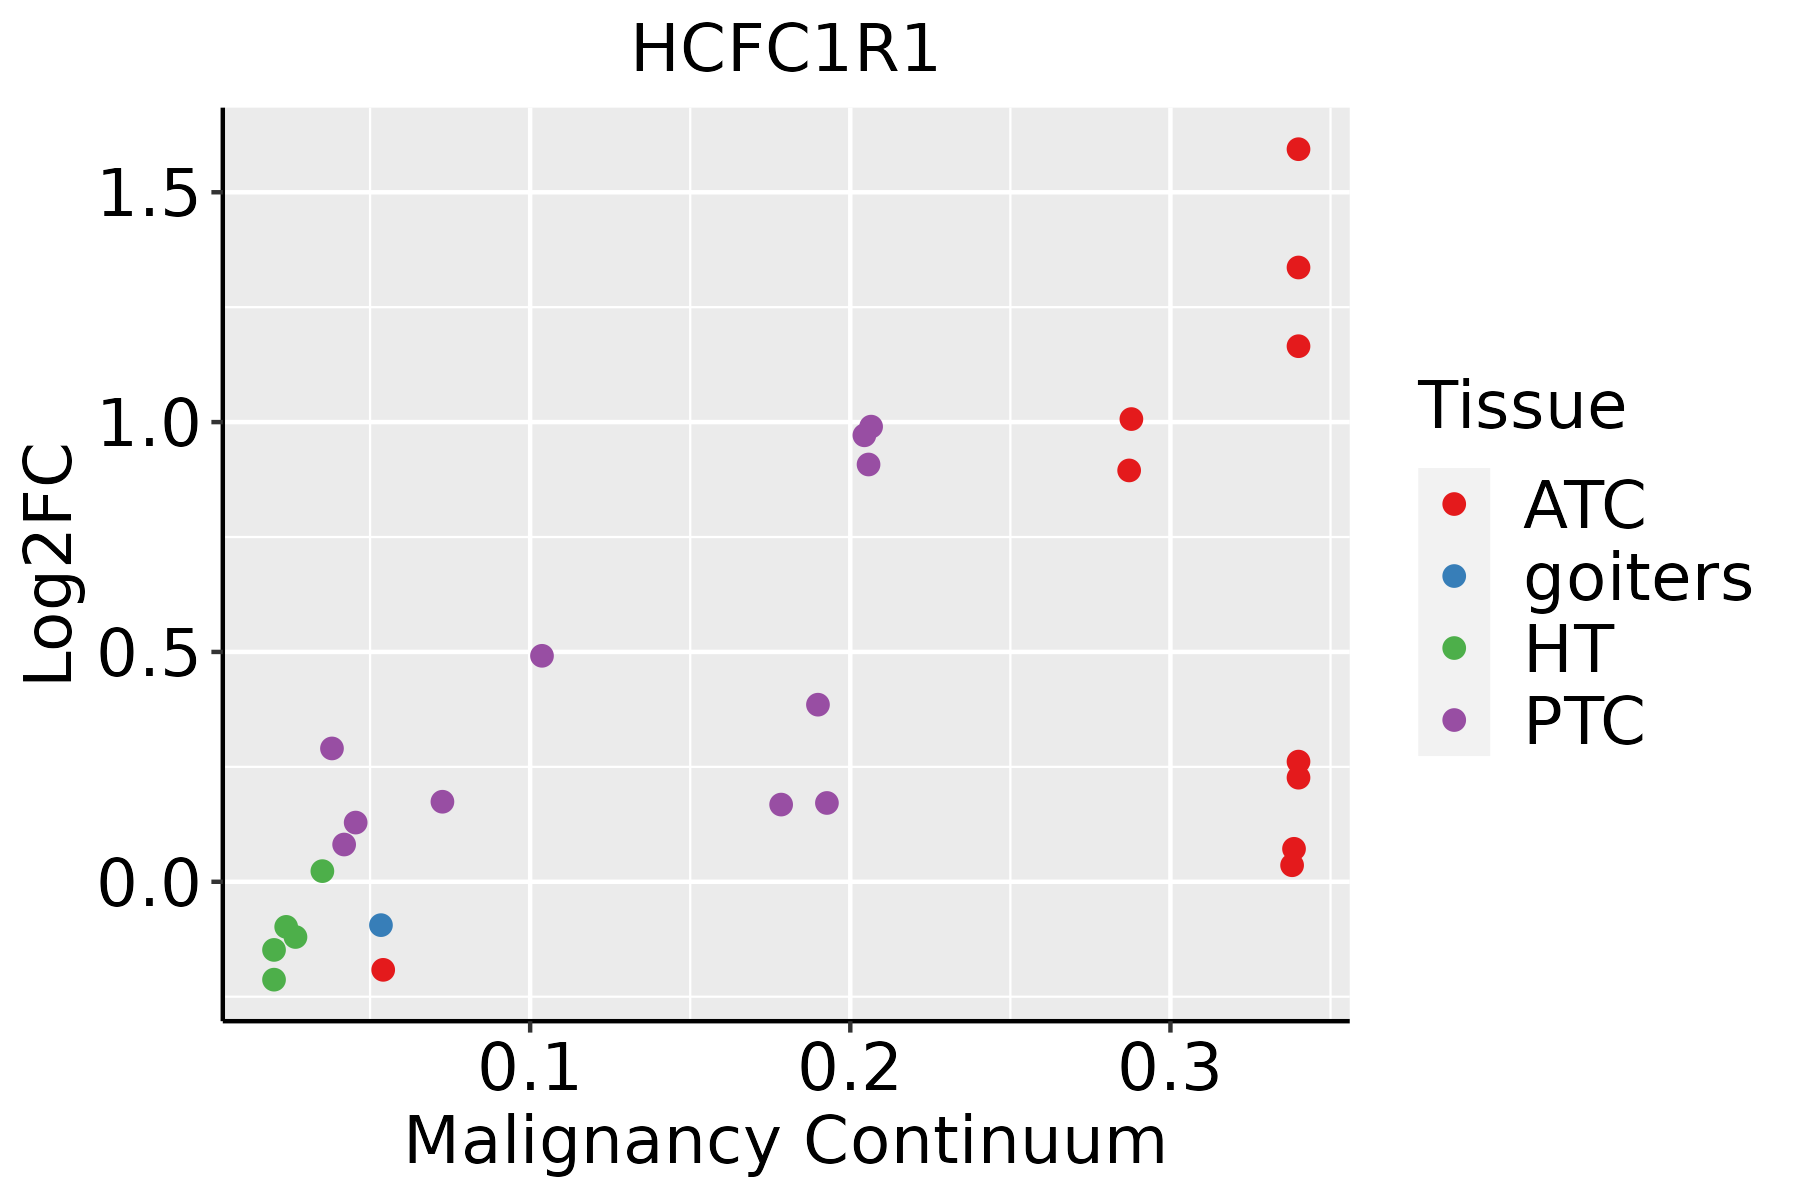 | ATC: Anaplastic thyroid cancer |
| HT: Hashimoto's thyroiditis | ||
| PTC: Papillary thyroid cancer |
| ∗log2FC in expression of this searched gene in stem-like cells from each diseased tissue sample relative to stem-like cells in normal samples in each tissue plotted against the malignancy continuum. Samples are colored based on if they are from different disease stage. |
Top |
Malignant transformation related pathway analysis |
| Find out the enriched GO biological processes and KEGG pathways involved in transition from healthy to precancer to cancer |
| Tissue | Disease Stage | Enriched GO biological Processes |
| Colorectum | AD |  |
| Colorectum | SER |  |
| Colorectum | MSS |  |
| Colorectum | MSI-H |  |
| Colorectum | FAP |  |
| ∗Top 15 enriched GO BP terms are showed in the bar plot of each disease state in each tissue. Each row represents a significant GO biological process which is colored according to the -log10(p.adjust). |
| Page: 1 2 3 4 5 6 7 8 9 |
| GO ID | Tissue | Disease Stage | Description | Gene Ratio | Bg Ratio | pvalue | p.adjust | Count |
| Page: 1 |
| Pathway ID | Tissue | Disease Stage | Description | Gene Ratio | Bg Ratio | pvalue | p.adjust | qvalue | Count |
| Page: 1 |
Top |
Cell-cell communication analysis |
| Identification of potential cell-cell interactions between two cell types and their ligand-receptor pairs for different disease states |
| Ligand | Receptor | LRpair | Pathway | Tissue | Disease Stage |
| Page: 1 |
Top |
Single-cell gene regulatory network inference analysis |
| Find out the significant the regulons (TFs) and the target genes of each regulon across cell types for different disease states |
| TF | Cell Type | Tissue | Disease Stage | Target Gene | RSS | Regulon Activity |
| ∗The dot plots of a searched regulon are shown for all cell subpopulations in each disease state of each tissue based on the regulon specific score inferred using pySCENIC and by calculating the average expression. |
| Page: 1 |
Top |
Somatic mutation of malignant transformation related genes |
| Annotation of somatic variants for genes involved in malignant transformation |
| Hugo Symbol | Variant Class | Variant Classification | dbSNP RS | HGVSc | HGVSp | HGVSp Short | SWISSPROT | BIOTYPE | SIFT | PolyPhen | Tumor Sample Barcode | Tissue | Histology | Sex | Age | Stage | Therapy Types | Drugs | Outcome |
| HCFC1R1 | SNV | Missense_Mutation | novel | c.145N>C | p.Glu49Gln | p.E49Q | Q9NWW0 | protein_coding | tolerated_low_confidence(0.06) | benign(0.342) | TCGA-5L-AAT1-01 | Breast | breast invasive carcinoma | Female | <65 | III/IV | Hormone Therapy | letrozol | SD |
| HCFC1R1 | SNV | Missense_Mutation | novel | c.362A>G | p.Asp121Gly | p.D121G | Q9NWW0 | protein_coding | tolerated_low_confidence(0.18) | benign(0.011) | TCGA-A7-A0DA-01 | Breast | breast invasive carcinoma | Female | <65 | I/II | Chemotherapy | adriamycin | SD |
| HCFC1R1 | SNV | Missense_Mutation | rs762463939 | c.26N>A | p.Arg9Gln | p.R9Q | Q9NWW0 | protein_coding | tolerated_low_confidence(0.07) | benign(0.124) | TCGA-AC-A23H-01 | Breast | breast invasive carcinoma | Female | >=65 | I/II | Unknown | Unknown | PD |
| HCFC1R1 | SNV | Missense_Mutation | c.374C>G | p.Pro125Arg | p.P125R | Q9NWW0 | protein_coding | deleterious_low_confidence(0.01) | possibly_damaging(0.79) | TCGA-DM-A1D7-01 | Colorectum | colon adenocarcinoma | Male | >=65 | I/II | Unknown | Unknown | PD | |
| HCFC1R1 | deletion | Frame_Shift_Del | rs768523777 | c.249delC | p.Met84Ter | p.M84* | Q9NWW0 | protein_coding | TCGA-AA-3845-01 | Colorectum | colon adenocarcinoma | Female | >=65 | I/II | Unknown | Unknown | PD | ||
| HCFC1R1 | deletion | Frame_Shift_Del | rs768523777 | c.249delC | p.Met84Ter | p.M84* | Q9NWW0 | protein_coding | TCGA-AD-A5EJ-01 | Colorectum | colon adenocarcinoma | Female | >=65 | I/II | Unknown | Unknown | SD | ||
| HCFC1R1 | deletion | Frame_Shift_Del | rs768523777 | c.249delN | p.Met84Ter | p.M84* | Q9NWW0 | protein_coding | TCGA-G4-6304-01 | Colorectum | colon adenocarcinoma | Female | >=65 | I/II | Chemotherapy | fluorouracil | PD | ||
| HCFC1R1 | deletion | Frame_Shift_Del | rs768523777 | c.249delN | p.Met84Ter | p.M84* | Q9NWW0 | protein_coding | TCGA-G4-6586-01 | Colorectum | colon adenocarcinoma | Female | >=65 | I/II | Unknown | Unknown | SD | ||
| HCFC1R1 | SNV | Missense_Mutation | novel | c.85N>A | p.Leu29Met | p.L29M | Q9NWW0 | protein_coding | deleterious_low_confidence(0.02) | possibly_damaging(0.839) | TCGA-A5-A0G1-01 | Endometrium | uterine corpus endometrioid carcinoma | Female | >=65 | I/II | Unknown | Unknown | SD |
| HCFC1R1 | SNV | Missense_Mutation | rs558116524 | c.134N>A | p.Arg45Gln | p.R45Q | Q9NWW0 | protein_coding | tolerated_low_confidence(0.25) | benign(0.124) | TCGA-AX-A2HD-01 | Endometrium | uterine corpus endometrioid carcinoma | Female | >=65 | III/IV | Unknown | Unknown | SD |
| Page: 1 2 3 |
Top |
Related drugs of malignant transformation related genes |
| Identification of chemicals and drugs interact with genes involved in malignant transfromation |
| (DGIdb 4.0) |
| Entrez ID | Symbol | Category | Interaction Types | Drug Claim Name | Drug Name | PMIDs |
| Page: 1 |

Copyright 2023-Present -The University of Texas Health Science Center at Houston |