
|
|||||
|
 | |
| |
| |
| |
| |
| |
|
Gene: GRSF1 |
Gene summary for GRSF1 |
| Gene information | Species | Human | Gene symbol | GRSF1 | Gene ID | 2926 |
| Gene name | G-rich RNA sequence binding factor 1 | |
| Gene Alias | GRSF1 | |
| Cytomap | 4q13.3 | |
| Gene Type | protein-coding | GO ID | GO:0000957 | UniProtAcc | A0A024RD99 |
Top |
Malignant transformation analysis |
| Identification of the aberrant gene expression in precancerous and cancerous lesions by comparing the gene expression of stem-like cells in diseased tissues with normal stem cells |
| Entrez ID | Symbol | Replicates | Species | Organ | Tissue | Adj P-value | Log2FC | Malignancy |
| 2926 | GRSF1 | P128T-E | Human | Esophagus | ESCC | 3.52e-49 | 1.97e+00 | 0.1241 |
| 2926 | GRSF1 | P130T-E | Human | Esophagus | ESCC | 5.76e-48 | 1.31e+00 | 0.1676 |
| 2926 | GRSF1 | S43 | Human | Liver | Cirrhotic | 3.67e-03 | -1.83e-01 | -0.0187 |
| 2926 | GRSF1 | HCC1_Meng | Human | Liver | HCC | 1.60e-82 | 1.04e-01 | 0.0246 |
| 2926 | GRSF1 | HCC2_Meng | Human | Liver | HCC | 6.90e-35 | 1.68e-01 | 0.0107 |
| 2926 | GRSF1 | cirrhotic1 | Human | Liver | Cirrhotic | 2.48e-02 | 1.55e-02 | 0.0202 |
| 2926 | GRSF1 | cirrhotic2 | Human | Liver | Cirrhotic | 1.47e-09 | 1.35e-01 | 0.0201 |
| 2926 | GRSF1 | HCC2 | Human | Liver | HCC | 2.24e-12 | 4.04e+00 | 0.5341 |
| 2926 | GRSF1 | Pt13.b | Human | Liver | HCC | 5.25e-07 | 1.03e-01 | 0.0251 |
| 2926 | GRSF1 | S014 | Human | Liver | HCC | 4.13e-26 | 1.13e+00 | 0.2254 |
| 2926 | GRSF1 | S015 | Human | Liver | HCC | 3.49e-22 | 1.39e+00 | 0.2375 |
| 2926 | GRSF1 | S016 | Human | Liver | HCC | 1.19e-25 | 1.16e+00 | 0.2243 |
| 2926 | GRSF1 | S027 | Human | Liver | HCC | 1.21e-10 | 1.31e+00 | 0.2446 |
| 2926 | GRSF1 | S028 | Human | Liver | HCC | 1.64e-21 | 1.44e+00 | 0.2503 |
| 2926 | GRSF1 | S029 | Human | Liver | HCC | 6.21e-22 | 1.63e+00 | 0.2581 |
| 2926 | GRSF1 | C04 | Human | Oral cavity | OSCC | 6.66e-30 | 1.60e+00 | 0.2633 |
| 2926 | GRSF1 | C21 | Human | Oral cavity | OSCC | 3.35e-51 | 1.77e+00 | 0.2678 |
| 2926 | GRSF1 | C30 | Human | Oral cavity | OSCC | 3.85e-39 | 1.94e+00 | 0.3055 |
| 2926 | GRSF1 | C38 | Human | Oral cavity | OSCC | 1.42e-08 | 9.94e-01 | 0.172 |
| 2926 | GRSF1 | C43 | Human | Oral cavity | OSCC | 2.03e-46 | 8.74e-01 | 0.1704 |
| Page: 1 2 3 4 5 6 7 |
| Tissue | Expression Dynamics | Abbreviation |
| Colorectum (GSE201348) |  | FAP: Familial adenomatous polyposis |
| CRC: Colorectal cancer | ||
| Colorectum (HTA11) |  | AD: Adenomas |
| SER: Sessile serrated lesions | ||
| MSI-H: Microsatellite-high colorectal cancer | ||
| MSS: Microsatellite stable colorectal cancer | ||
| Esophagus | 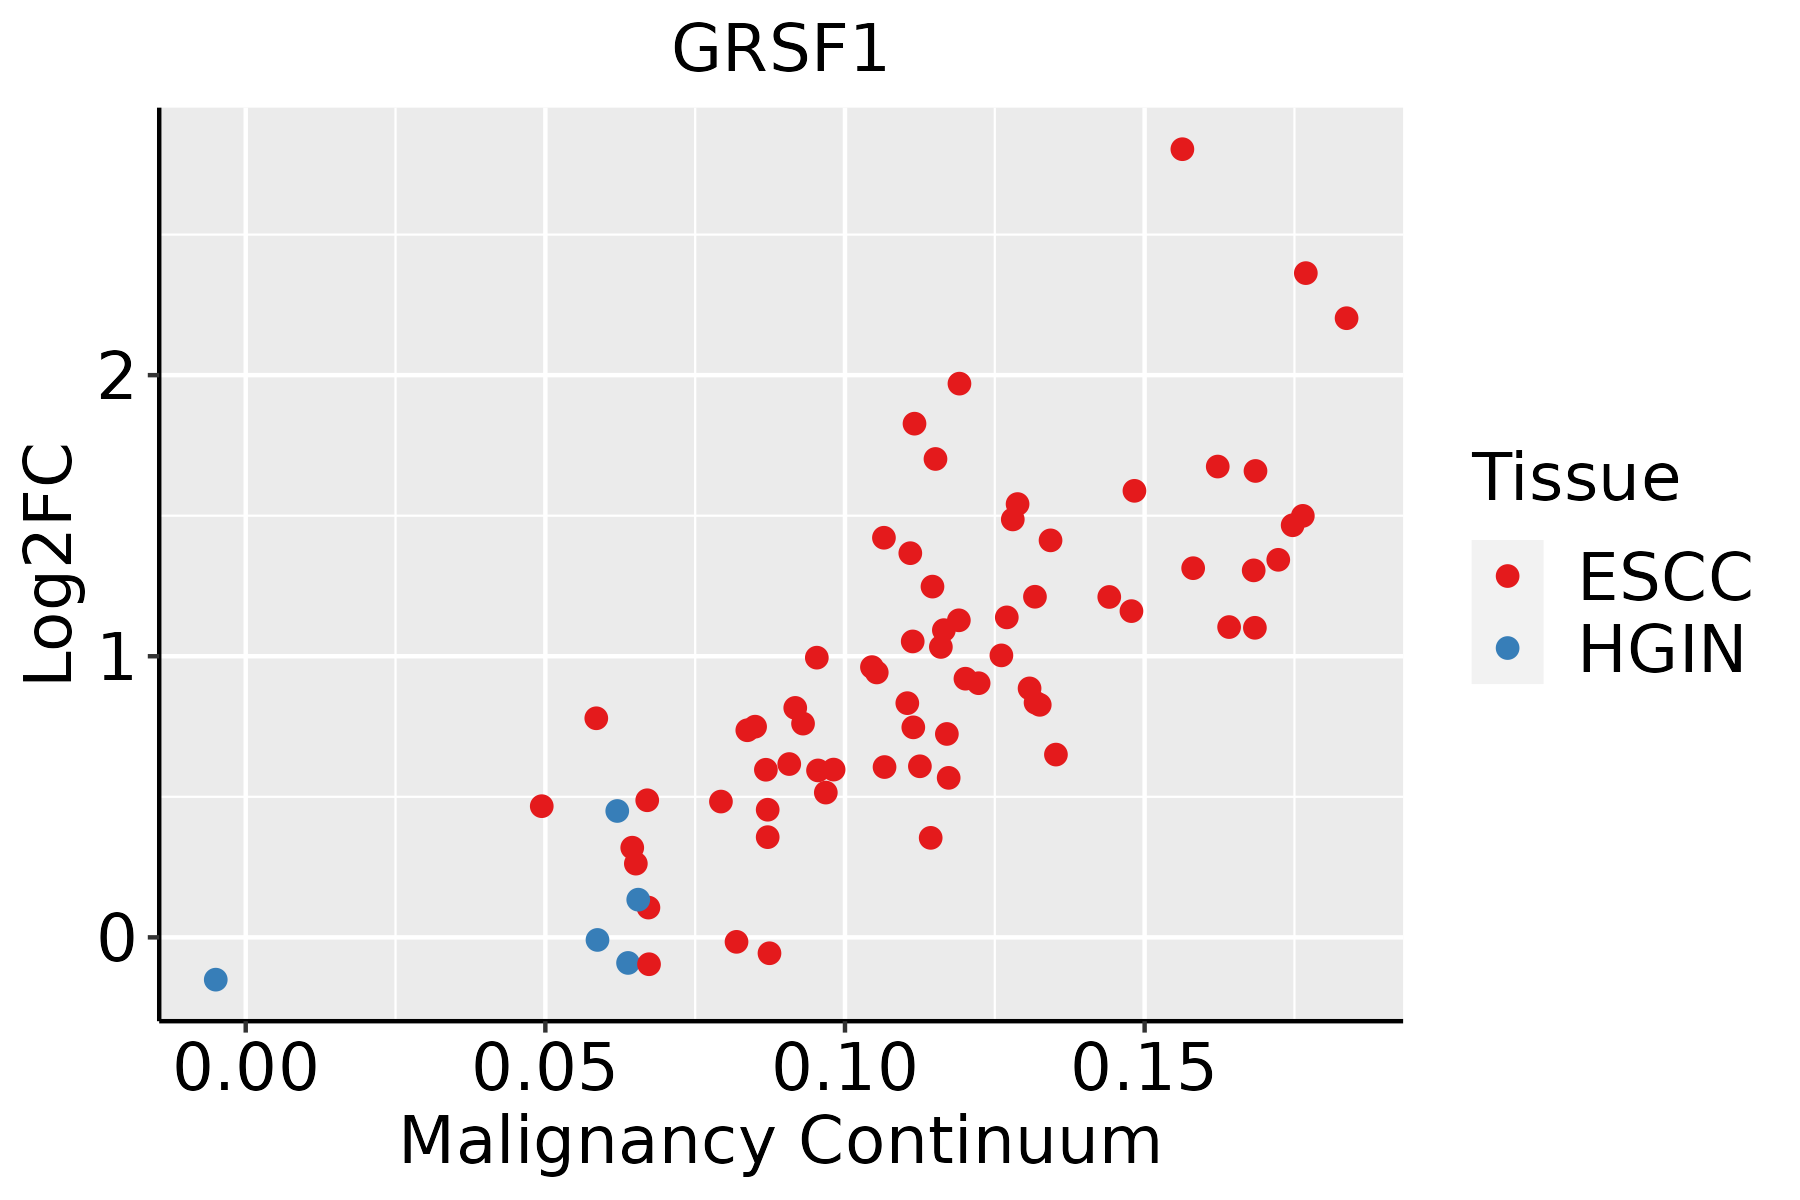 | ESCC: Esophageal squamous cell carcinoma |
| HGIN: High-grade intraepithelial neoplasias | ||
| LGIN: Low-grade intraepithelial neoplasias | ||
| Liver | 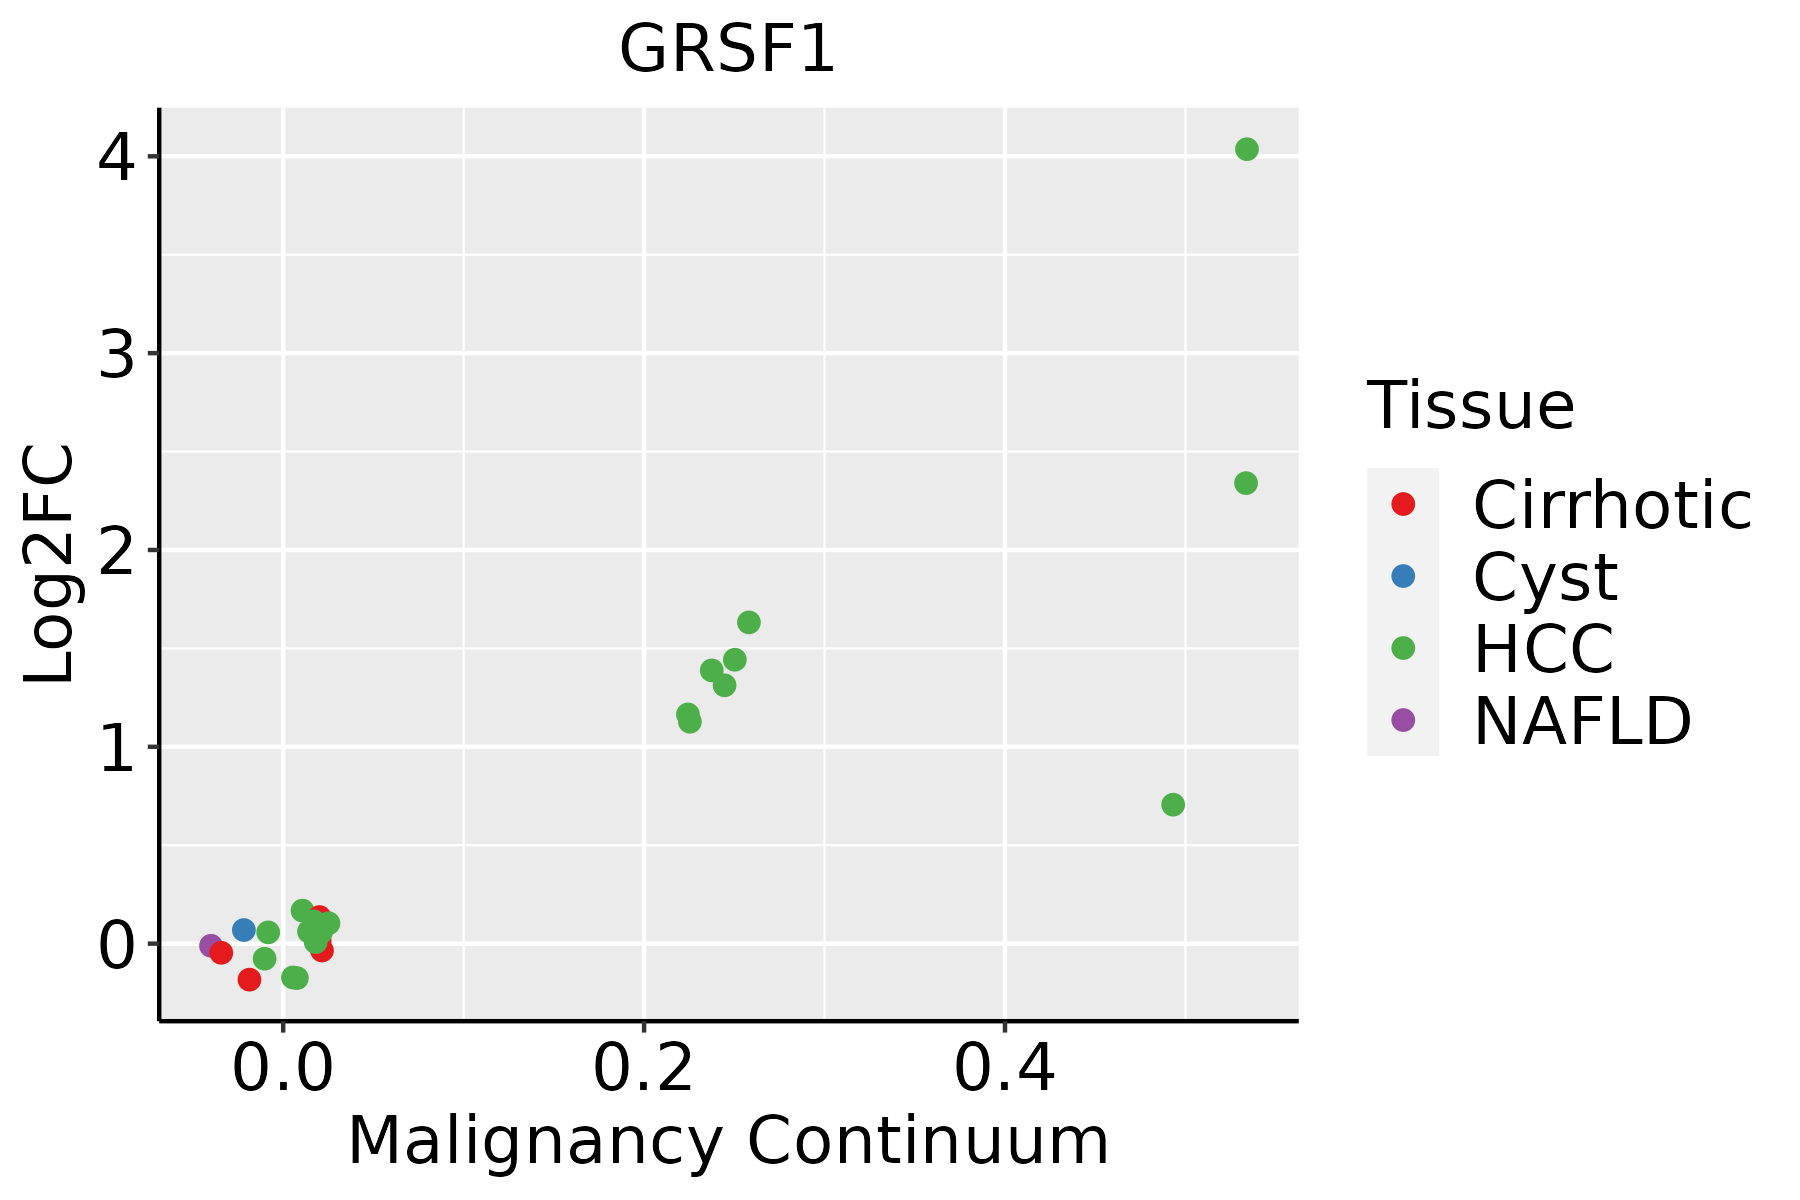 | HCC: Hepatocellular carcinoma |
| NAFLD: Non-alcoholic fatty liver disease | ||
| Oral Cavity | 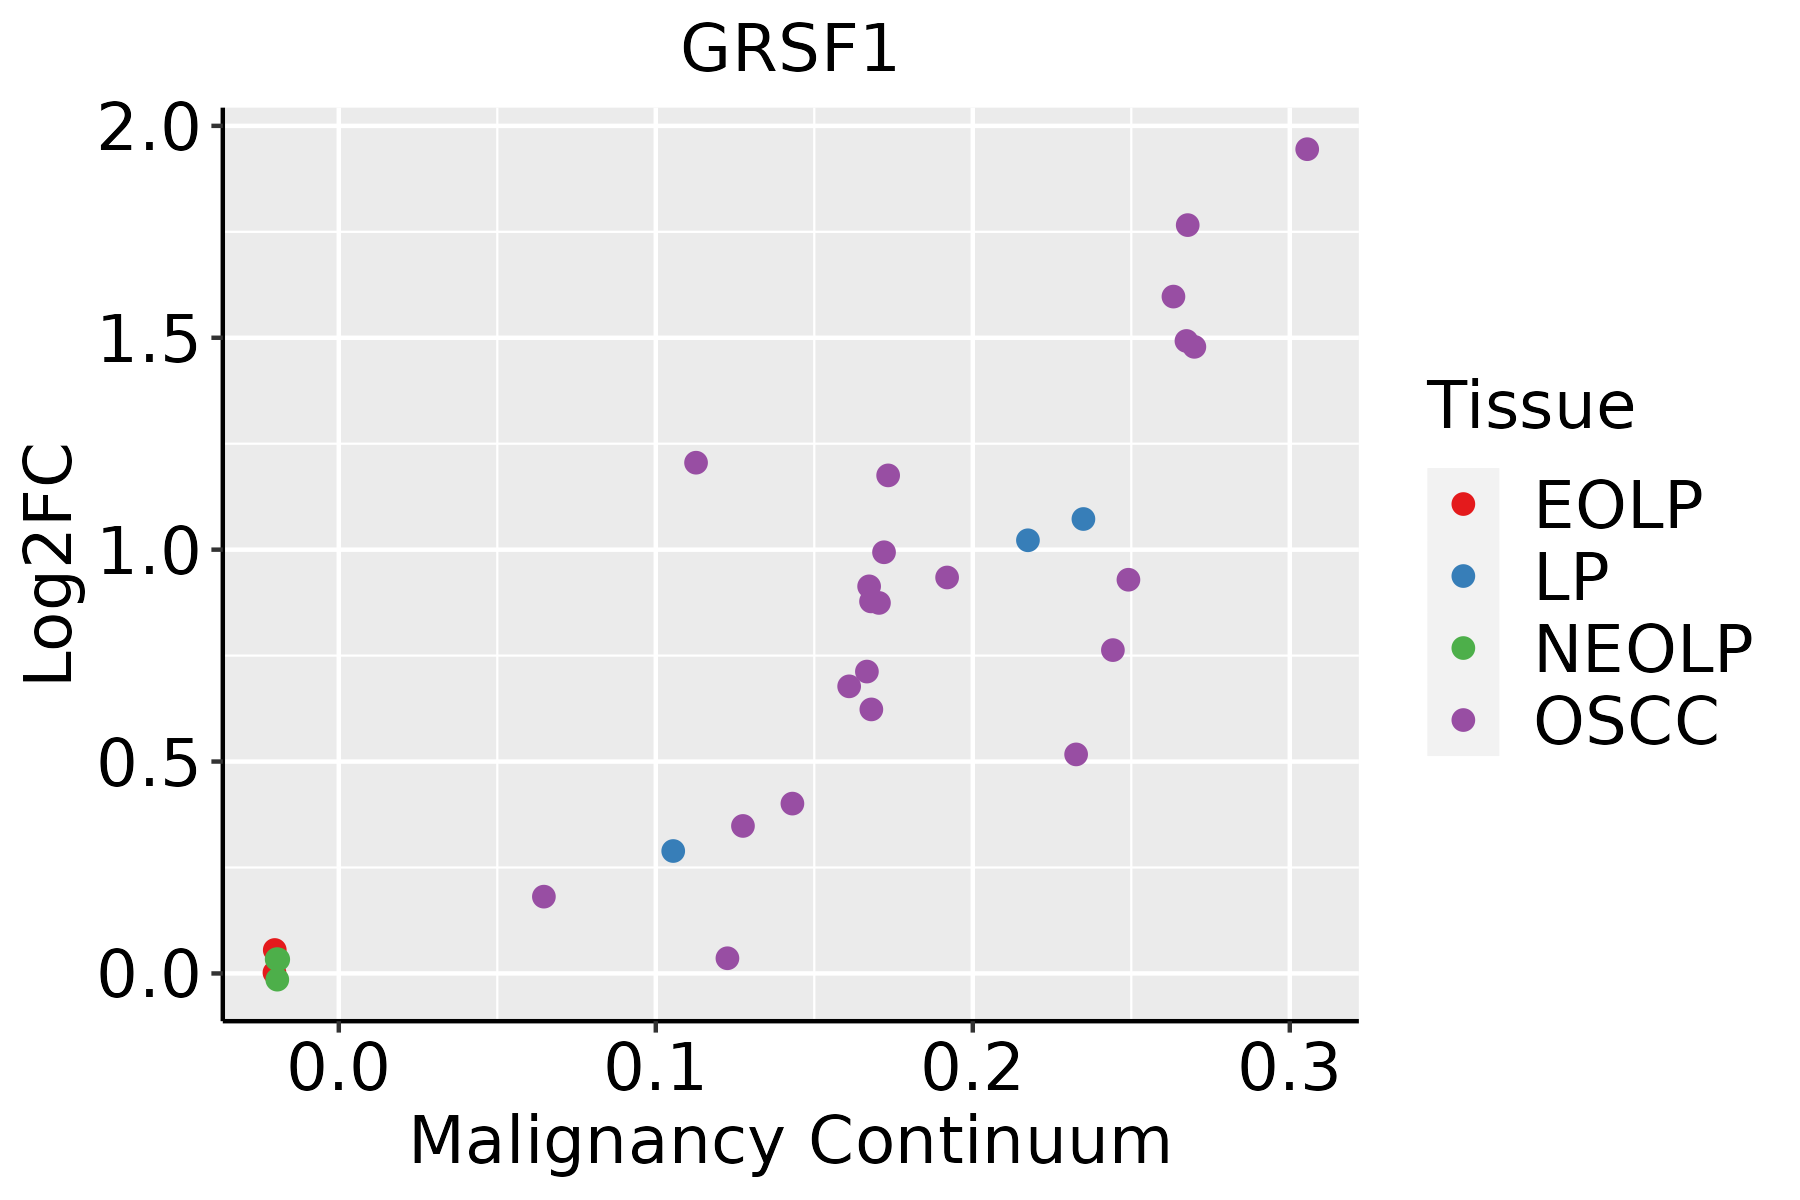 | EOLP: Erosive Oral lichen planus |
| LP: leukoplakia | ||
| NEOLP: Non-erosive oral lichen planus | ||
| OSCC: Oral squamous cell carcinoma | ||
| Skin |  | AK: Actinic keratosis |
| cSCC: Cutaneous squamous cell carcinoma | ||
| SCCIS:squamous cell carcinoma in situ | ||
| Thyroid | 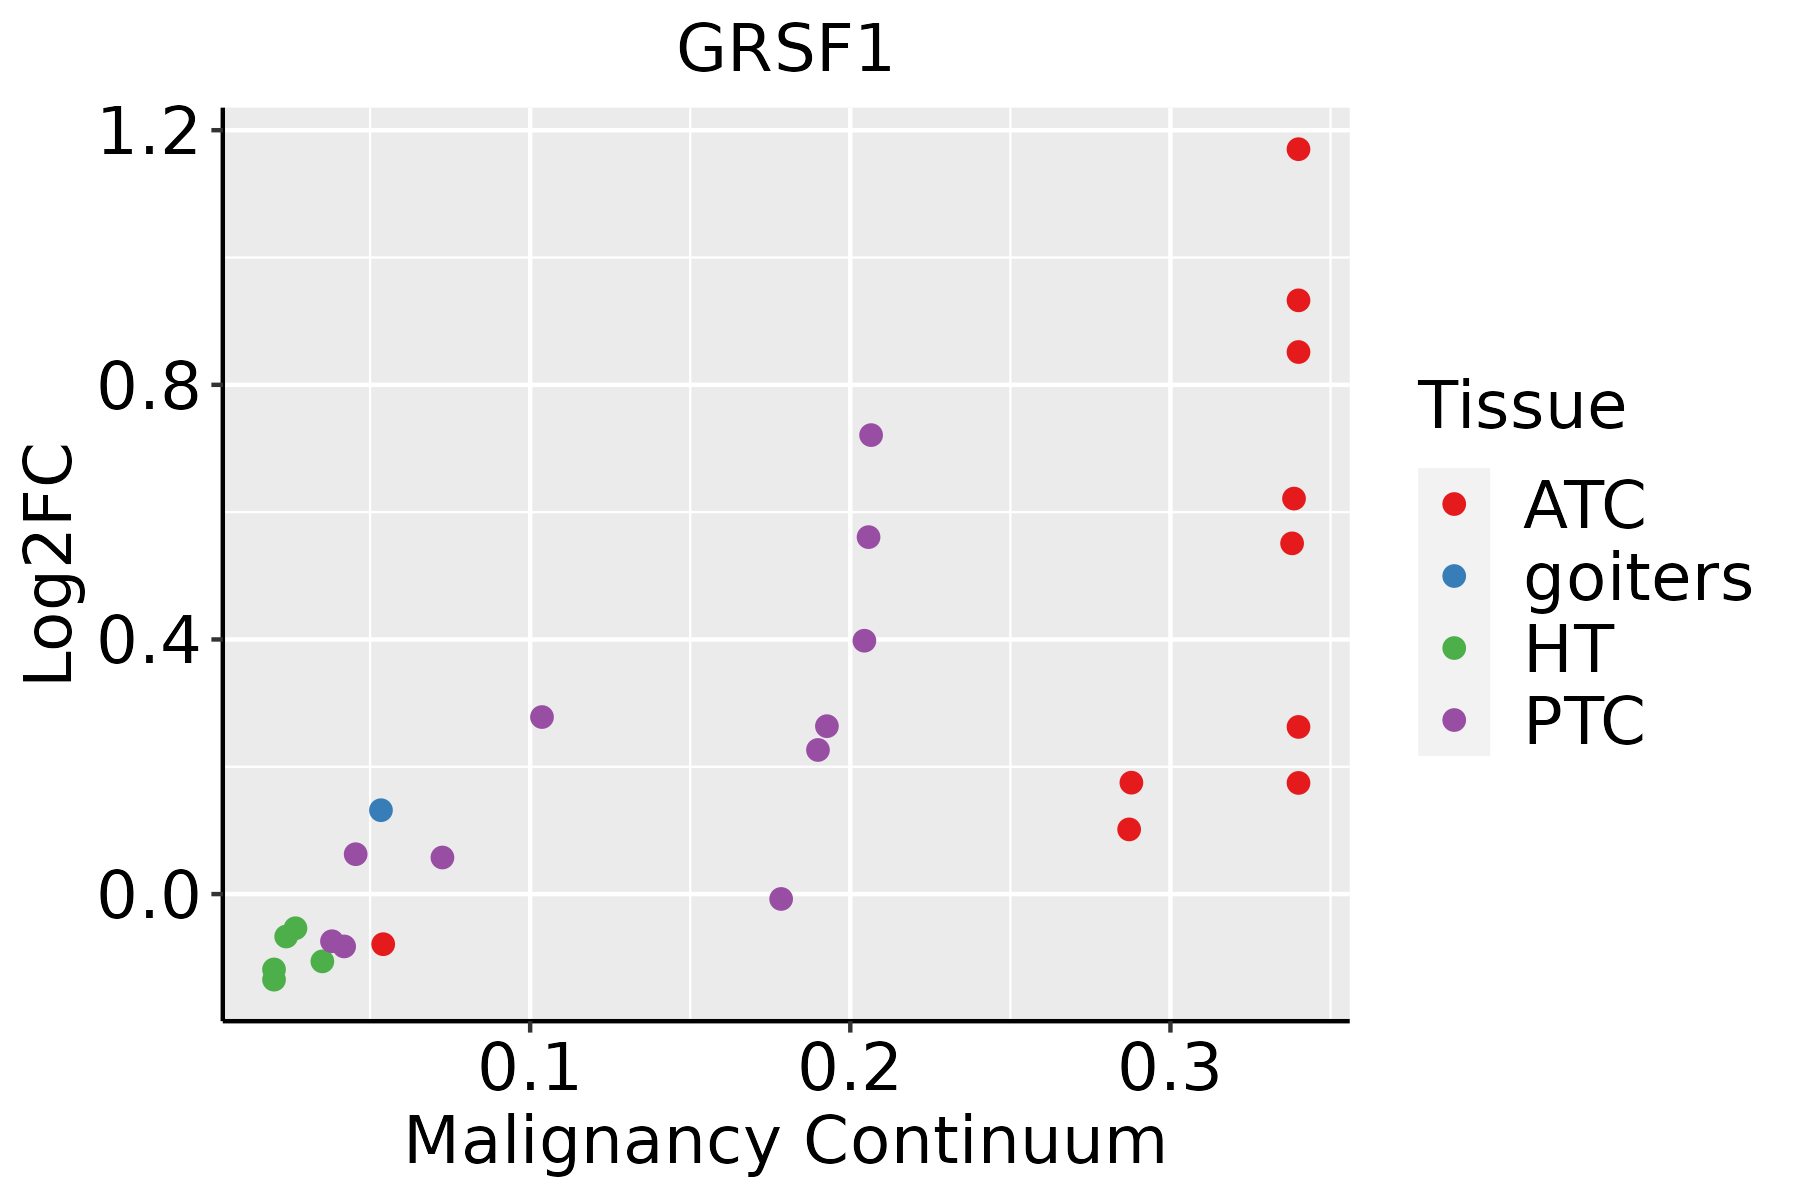 | ATC: Anaplastic thyroid cancer |
| HT: Hashimoto's thyroiditis | ||
| PTC: Papillary thyroid cancer |
| ∗log2FC in expression of this searched gene in stem-like cells from each diseased tissue sample relative to stem-like cells in normal samples in each tissue plotted against the malignancy continuum. Samples are colored based on if they are from different disease stage. |
Top |
Malignant transformation related pathway analysis |
| Find out the enriched GO biological processes and KEGG pathways involved in transition from healthy to precancer to cancer |
| Tissue | Disease Stage | Enriched GO biological Processes |
| Colorectum | AD |  |
| Colorectum | SER |  |
| Colorectum | MSS |  |
| Colorectum | MSI-H |  |
| Colorectum | FAP |  |
| ∗Top 15 enriched GO BP terms are showed in the bar plot of each disease state in each tissue. Each row represents a significant GO biological process which is colored according to the -log10(p.adjust). |
| Page: 1 2 3 4 5 6 7 8 9 |
| GO ID | Tissue | Disease Stage | Description | Gene Ratio | Bg Ratio | pvalue | p.adjust | Count |
| GO:0008380 | Colorectum | AD | RNA splicing | 169/3918 | 434/18723 | 3.59e-18 | 2.04e-15 | 169 |
| GO:0009896 | Colorectum | AD | positive regulation of catabolic process | 180/3918 | 492/18723 | 4.33e-16 | 1.94e-13 | 180 |
| GO:0031331 | Colorectum | AD | positive regulation of cellular catabolic process | 156/3918 | 427/18723 | 4.68e-14 | 1.05e-11 | 156 |
| GO:0043484 | Colorectum | AD | regulation of RNA splicing | 70/3918 | 148/18723 | 6.47e-13 | 1.16e-10 | 70 |
| GO:0006401 | Colorectum | AD | RNA catabolic process | 102/3918 | 278/18723 | 8.64e-10 | 6.76e-08 | 102 |
| GO:0044270 | Colorectum | AD | cellular nitrogen compound catabolic process | 147/3918 | 451/18723 | 3.35e-09 | 2.23e-07 | 147 |
| GO:0046700 | Colorectum | AD | heterocycle catabolic process | 145/3918 | 445/18723 | 4.37e-09 | 2.84e-07 | 145 |
| GO:0034655 | Colorectum | AD | nucleobase-containing compound catabolic process | 133/3918 | 407/18723 | 1.56e-08 | 9.12e-07 | 133 |
| GO:0019439 | Colorectum | AD | aromatic compound catabolic process | 146/3918 | 467/18723 | 7.48e-08 | 3.84e-06 | 146 |
| GO:1901361 | Colorectum | AD | organic cyclic compound catabolic process | 153/3918 | 495/18723 | 8.23e-08 | 4.18e-06 | 153 |
| GO:00083802 | Colorectum | MSS | RNA splicing | 159/3467 | 434/18723 | 1.75e-19 | 1.22e-16 | 159 |
| GO:00098962 | Colorectum | MSS | positive regulation of catabolic process | 163/3467 | 492/18723 | 3.10e-15 | 9.22e-13 | 163 |
| GO:00434842 | Colorectum | MSS | regulation of RNA splicing | 66/3467 | 148/18723 | 2.44e-13 | 5.25e-11 | 66 |
| GO:00064012 | Colorectum | MSS | RNA catabolic process | 102/3467 | 278/18723 | 5.07e-13 | 1.02e-10 | 102 |
| GO:00313312 | Colorectum | MSS | positive regulation of cellular catabolic process | 140/3467 | 427/18723 | 7.02e-13 | 1.33e-10 | 140 |
| GO:00442702 | Colorectum | MSS | cellular nitrogen compound catabolic process | 141/3467 | 451/18723 | 2.95e-11 | 3.83e-09 | 141 |
| GO:00467002 | Colorectum | MSS | heterocycle catabolic process | 139/3467 | 445/18723 | 4.37e-11 | 5.05e-09 | 139 |
| GO:00346552 | Colorectum | MSS | nucleobase-containing compound catabolic process | 129/3467 | 407/18723 | 7.48e-11 | 8.18e-09 | 129 |
| GO:19013612 | Colorectum | MSS | organic cyclic compound catabolic process | 148/3467 | 495/18723 | 3.47e-10 | 3.18e-08 | 148 |
| GO:00194392 | Colorectum | MSS | aromatic compound catabolic process | 140/3467 | 467/18723 | 8.56e-10 | 6.85e-08 | 140 |
| Page: 1 2 3 4 5 6 7 8 9 10 |
| Pathway ID | Tissue | Disease Stage | Description | Gene Ratio | Bg Ratio | pvalue | p.adjust | qvalue | Count |
| Page: 1 |
Top |
Cell-cell communication analysis |
| Identification of potential cell-cell interactions between two cell types and their ligand-receptor pairs for different disease states |
| Ligand | Receptor | LRpair | Pathway | Tissue | Disease Stage |
| Page: 1 |
Top |
Single-cell gene regulatory network inference analysis |
| Find out the significant the regulons (TFs) and the target genes of each regulon across cell types for different disease states |
| TF | Cell Type | Tissue | Disease Stage | Target Gene | RSS | Regulon Activity |
| ∗The dot plots of a searched regulon are shown for all cell subpopulations in each disease state of each tissue based on the regulon specific score inferred using pySCENIC and by calculating the average expression. |
| Page: 1 |
Top |
Somatic mutation of malignant transformation related genes |
| Annotation of somatic variants for genes involved in malignant transformation |
| Hugo Symbol | Variant Class | Variant Classification | dbSNP RS | HGVSc | HGVSp | HGVSp Short | SWISSPROT | BIOTYPE | SIFT | PolyPhen | Tumor Sample Barcode | Tissue | Histology | Sex | Age | Stage | Therapy Types | Drugs | Outcome |
| GRSF1 | SNV | Missense_Mutation | rs779804453 | c.1229N>C | p.Phe410Ser | p.F410S | Q12849 | protein_coding | tolerated(0.07) | probably_damaging(0.965) | TCGA-A2-A0YE-01 | Breast | breast invasive carcinoma | Female | <65 | I/II | Unspecific | Taxotere | SD |
| GRSF1 | SNV | Missense_Mutation | novel | c.1224N>C | p.Leu408Phe | p.L408F | Q12849 | protein_coding | tolerated(0.28) | probably_damaging(0.998) | TCGA-A8-A09V-01 | Breast | breast invasive carcinoma | Female | <65 | I/II | Hormone Therapy | tamoxiphen | SD |
| GRSF1 | SNV | Missense_Mutation | rs779804453 | c.1229N>C | p.Phe410Ser | p.F410S | Q12849 | protein_coding | tolerated(0.07) | probably_damaging(0.965) | TCGA-EW-A1PH-01 | Breast | breast invasive carcinoma | Female | <65 | I/II | Chemotherapy | cyclophosphamide | SD |
| GRSF1 | deletion | Frame_Shift_Del | novel | c.904delN | p.Met302TrpfsTer7 | p.M302Wfs*7 | Q12849 | protein_coding | TCGA-D8-A27V-01 | Breast | breast invasive carcinoma | Female | <65 | I/II | Hormone Therapy | tamoxiphen | SD | ||
| GRSF1 | SNV | Missense_Mutation | novel | c.1388A>G | p.His463Arg | p.H463R | Q12849 | protein_coding | tolerated(0.13) | probably_damaging(0.929) | TCGA-2W-A8YY-01 | Cervix | cervical & endocervical cancer | Female | <65 | I/II | Chemotherapy | cisplatin | CR |
| GRSF1 | SNV | Missense_Mutation | novel | c.478T>C | p.Ser160Pro | p.S160P | Q12849 | protein_coding | deleterious(0) | probably_damaging(0.997) | TCGA-2W-A8YY-01 | Cervix | cervical & endocervical cancer | Female | <65 | I/II | Chemotherapy | cisplatin | CR |
| GRSF1 | SNV | Missense_Mutation | c.482N>A | p.Cys161Tyr | p.C161Y | Q12849 | protein_coding | deleterious(0.04) | possibly_damaging(0.9) | TCGA-C5-A7X3-01 | Cervix | cervical & endocervical cancer | Female | >=65 | III/IV | Chemotherapy | cisplatin | SD | |
| GRSF1 | SNV | Missense_Mutation | rs775900058 | c.892N>A | p.Glu298Lys | p.E298K | Q12849 | protein_coding | tolerated(0.36) | possibly_damaging(0.446) | TCGA-EK-A3GK-01 | Cervix | cervical & endocervical cancer | Female | <65 | I/II | Unknown | Unknown | SD |
| GRSF1 | SNV | Missense_Mutation | rs368531595 | c.641N>A | p.Arg214His | p.R214H | Q12849 | protein_coding | tolerated(0.16) | benign(0.003) | TCGA-AZ-6598-01 | Colorectum | colon adenocarcinoma | Female | >=65 | I/II | Unknown | Unknown | SD |
| GRSF1 | SNV | Missense_Mutation | c.1040N>T | p.Ala347Val | p.A347V | Q12849 | protein_coding | tolerated(0.12) | benign(0.049) | TCGA-CK-6751-01 | Colorectum | colon adenocarcinoma | Female | >=65 | I/II | Unknown | Unknown | SD |
| Page: 1 2 3 4 5 |
Top |
Related drugs of malignant transformation related genes |
| Identification of chemicals and drugs interact with genes involved in malignant transfromation |
| (DGIdb 4.0) |
| Entrez ID | Symbol | Category | Interaction Types | Drug Claim Name | Drug Name | PMIDs |
| Page: 1 |

Copyright 2023-Present -The University of Texas Health Science Center at Houston |