| Tissue | Expression Dynamics | Abbreviation |
| Breast |  | IDC: Invasive ductal carcinoma |
| DCIS: Ductal carcinoma in situ |
| Precancer(BRCA1-mut): Precancerous lesion from BRCA1 mutation carriers |
| Colorectum (GSE201348) |  | FAP: Familial adenomatous polyposis |
| CRC: Colorectal cancer |
| Colorectum (HTA11) | 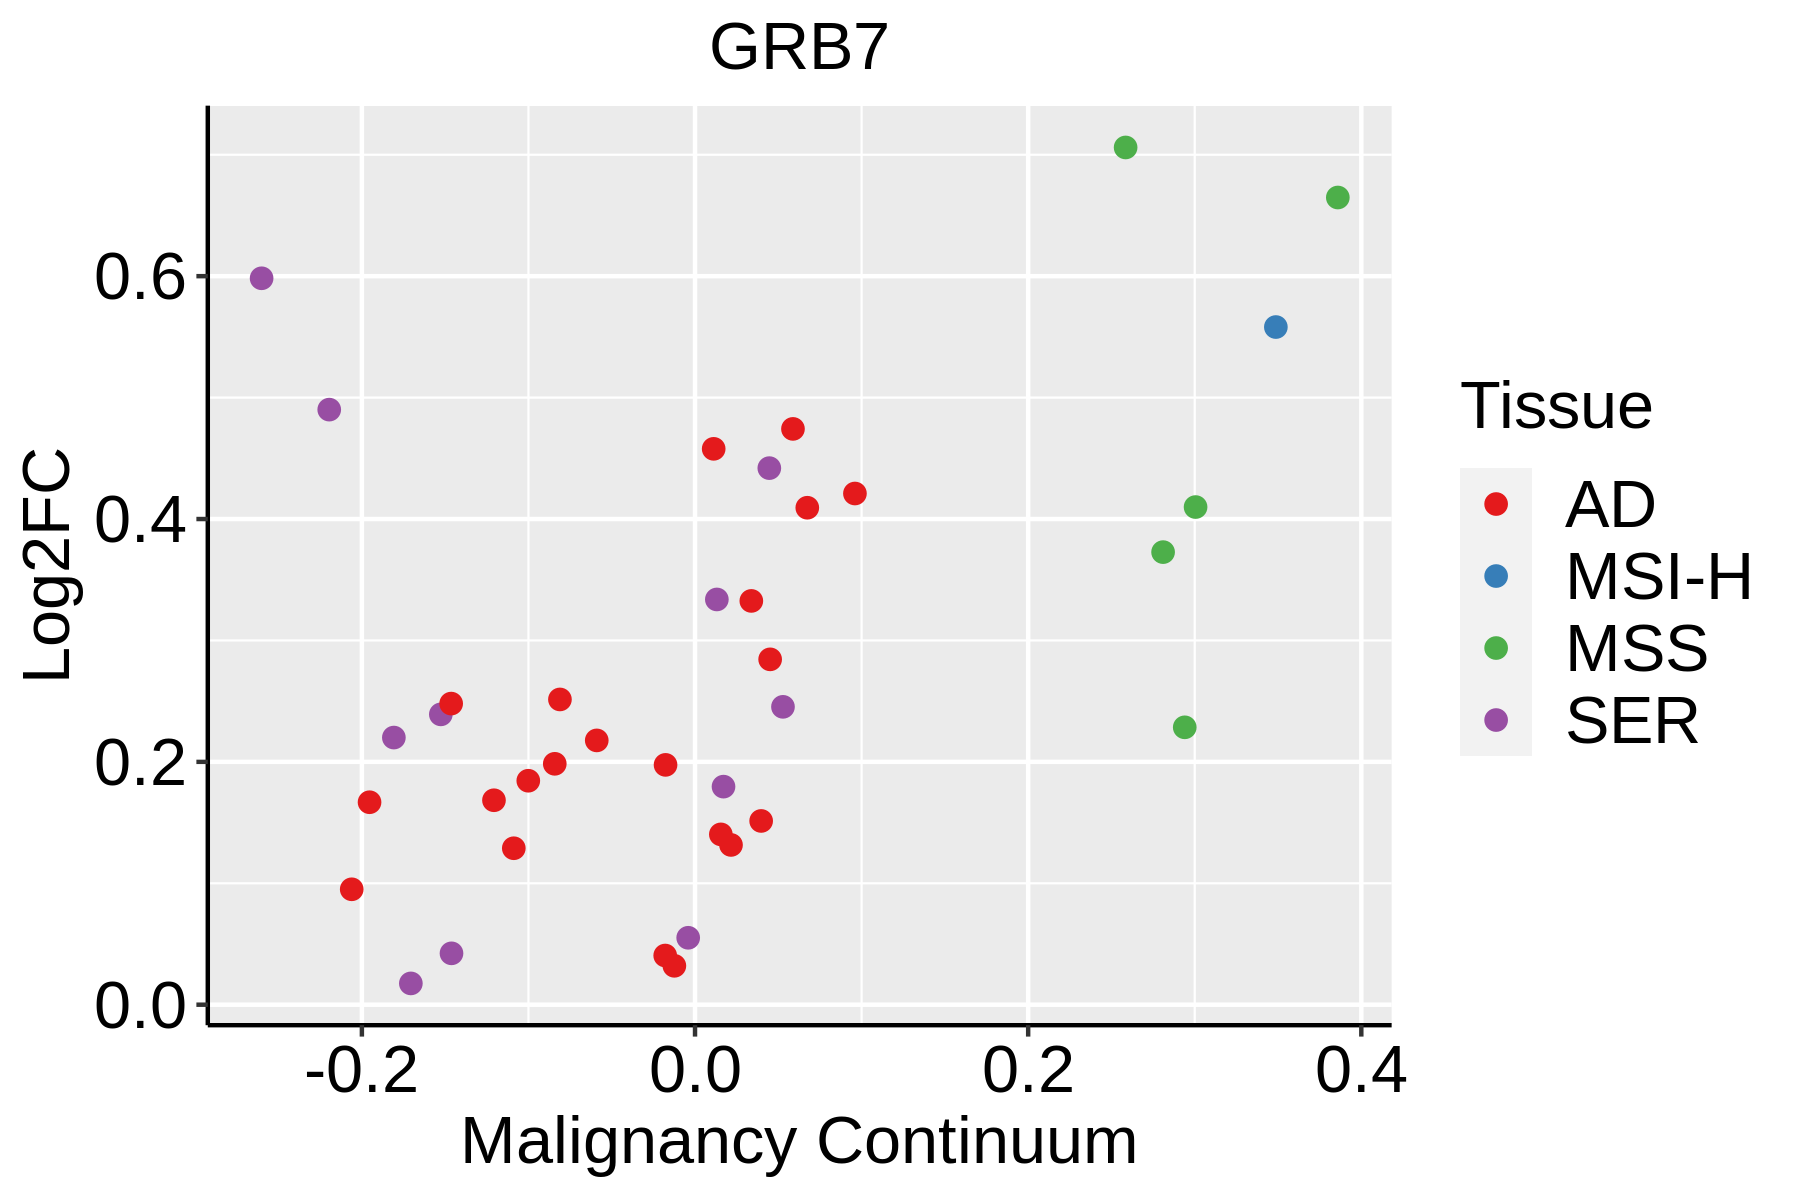 | AD: Adenomas |
| SER: Sessile serrated lesions |
| MSI-H: Microsatellite-high colorectal cancer |
| MSS: Microsatellite stable colorectal cancer |
| Esophagus | 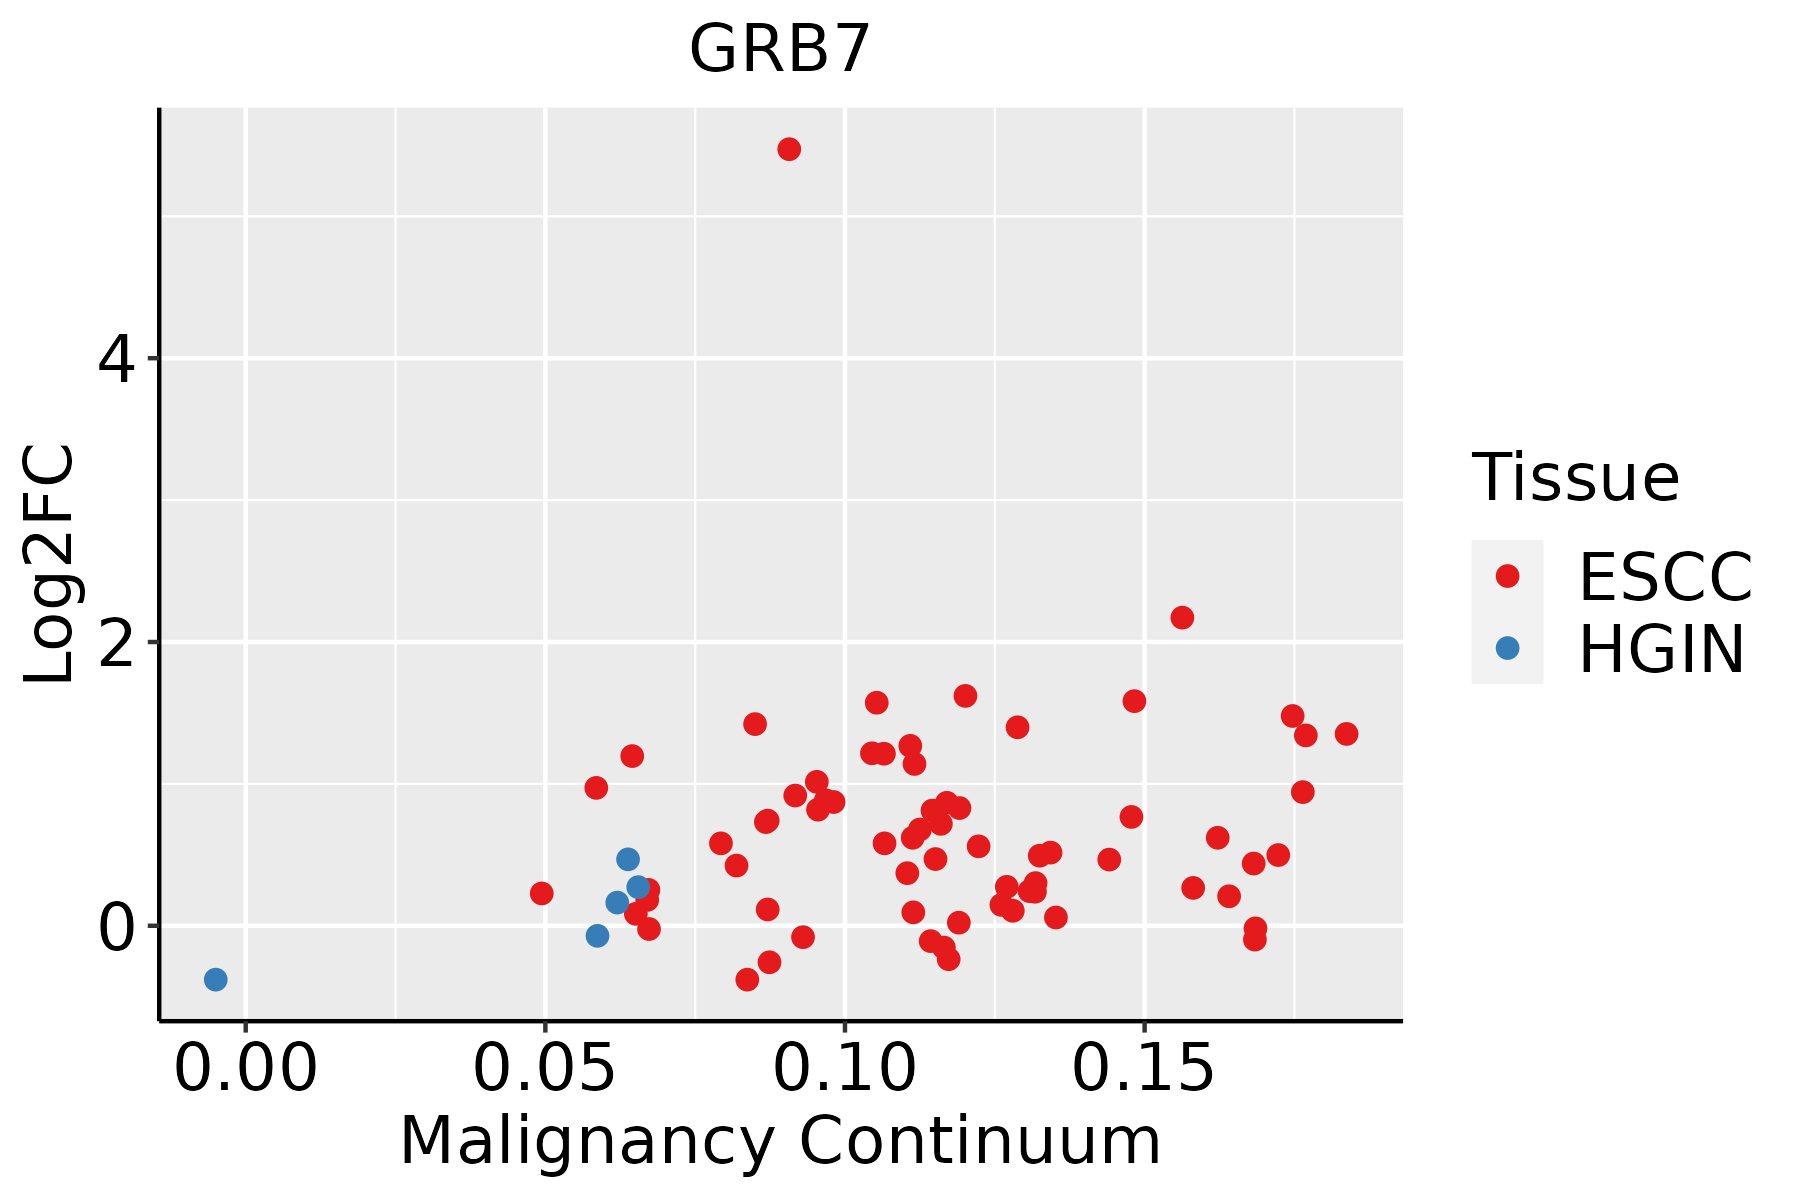 | ESCC: Esophageal squamous cell carcinoma |
| HGIN: High-grade intraepithelial neoplasias |
| LGIN: Low-grade intraepithelial neoplasias |
| Liver | 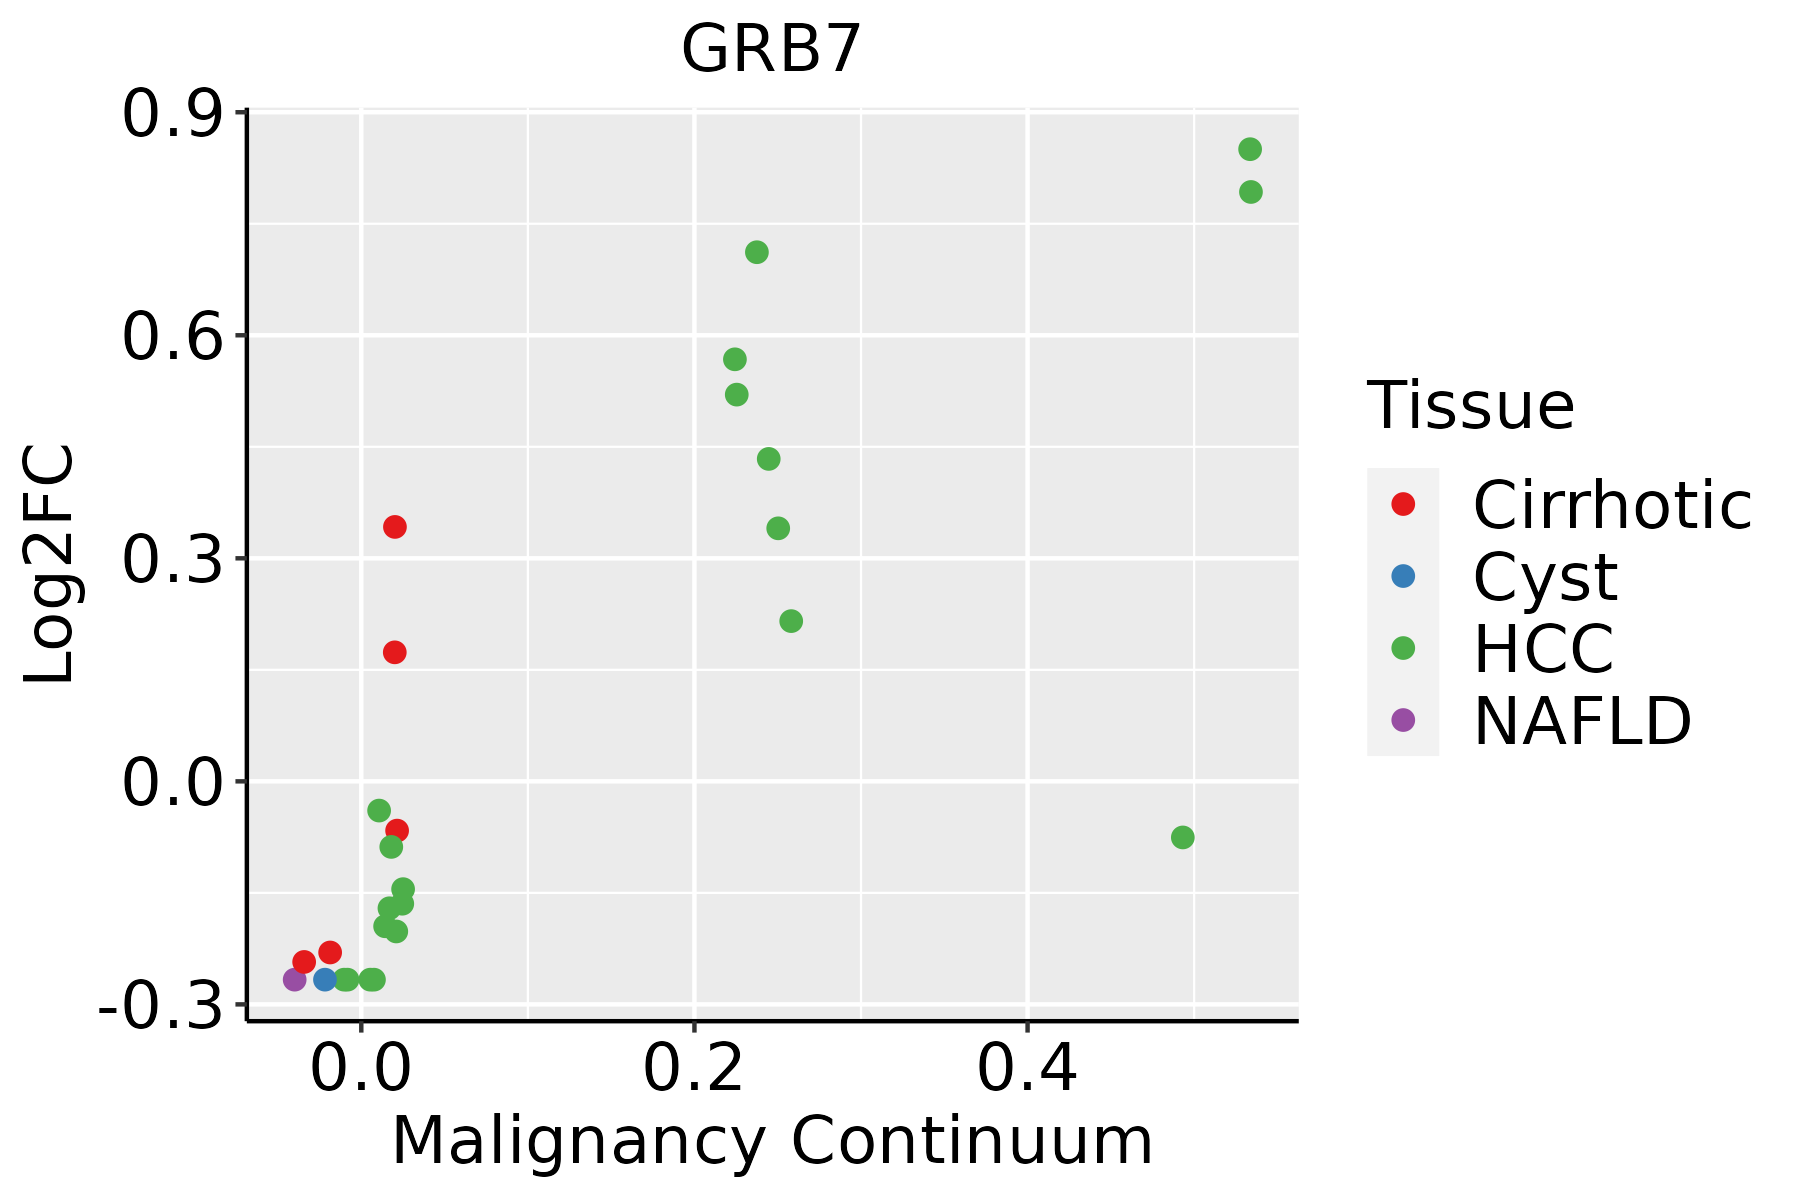 | HCC: Hepatocellular carcinoma |
| NAFLD: Non-alcoholic fatty liver disease |
| Oral Cavity | 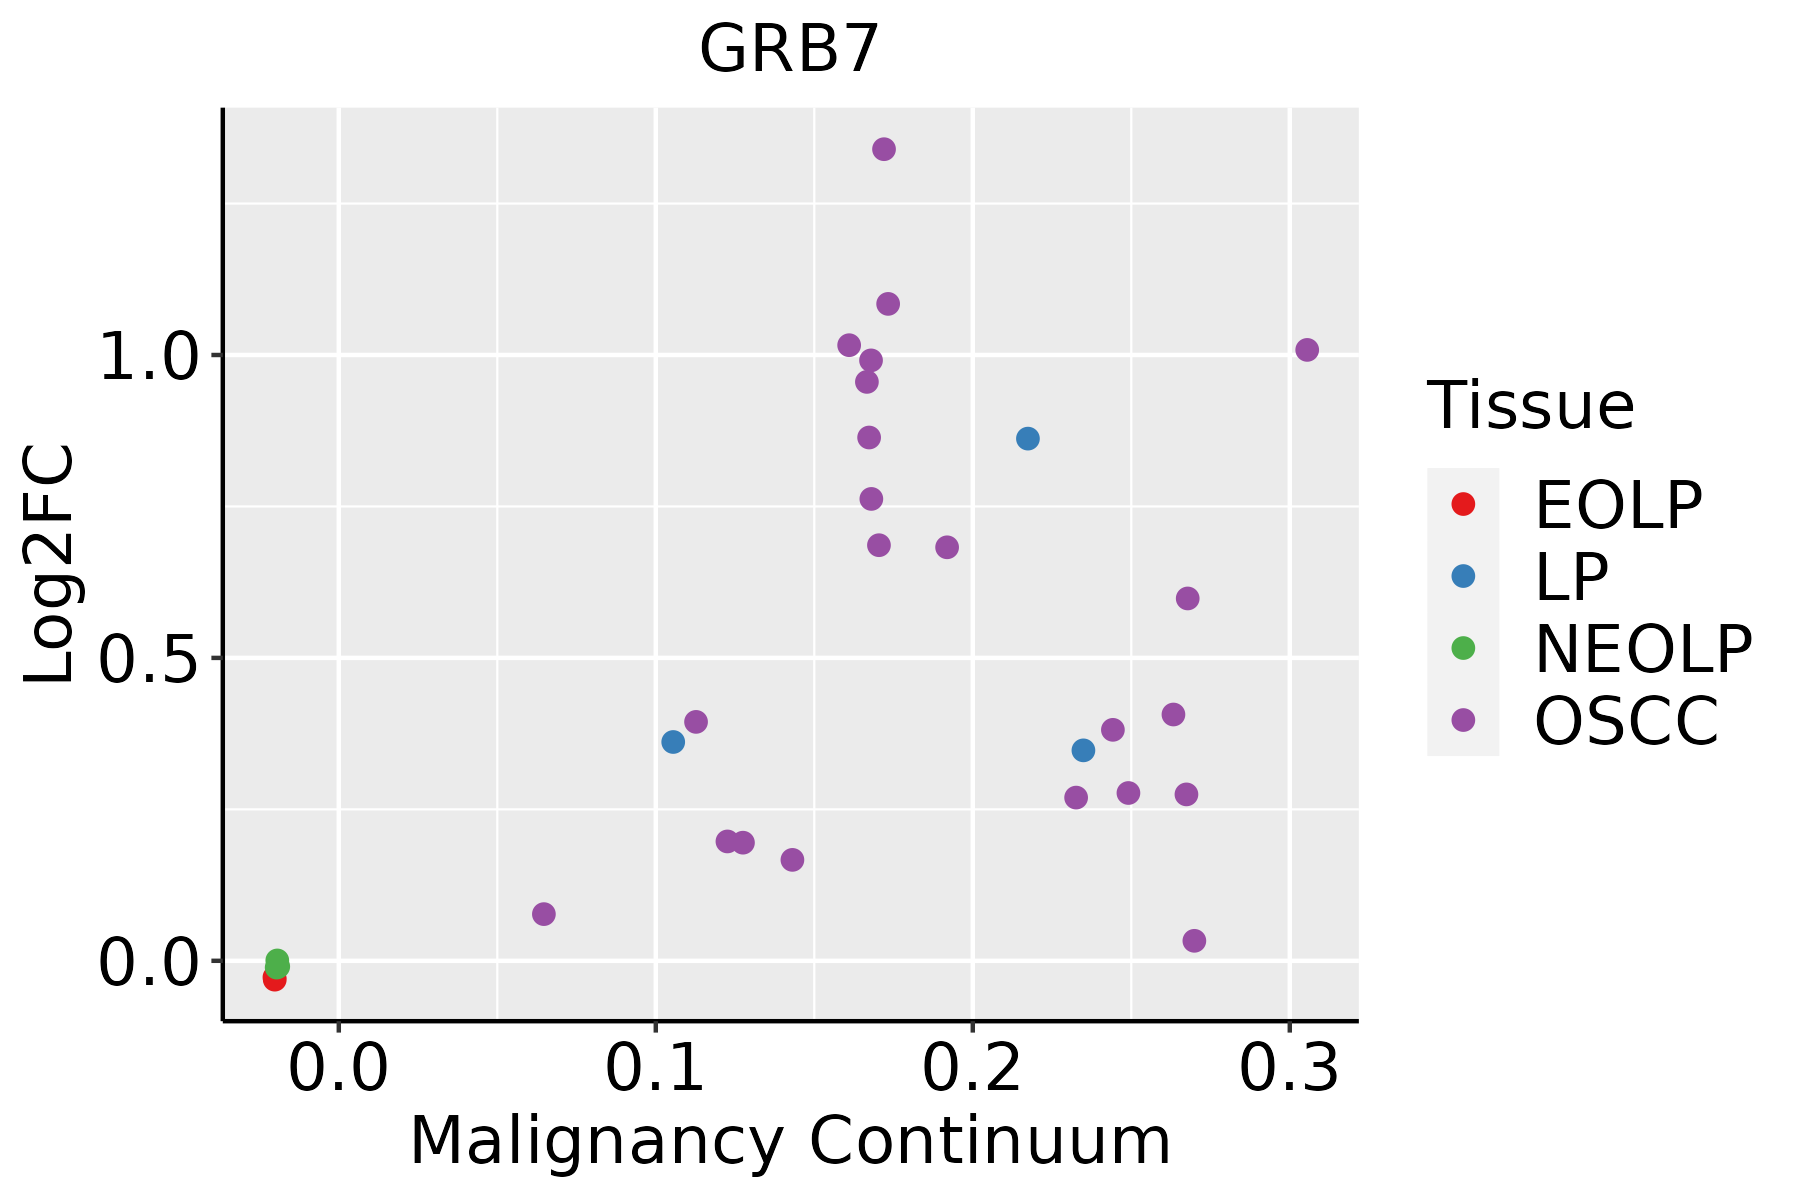 | EOLP: Erosive Oral lichen planus |
| LP: leukoplakia |
| NEOLP: Non-erosive oral lichen planus |
| OSCC: Oral squamous cell carcinoma |
| Thyroid |  | ATC: Anaplastic thyroid cancer |
| HT: Hashimoto's thyroiditis |
| PTC: Papillary thyroid cancer |
| GO ID | Tissue | Disease Stage | Description | Gene Ratio | Bg Ratio | pvalue | p.adjust | Count |
| GO:00064179 | Breast | Precancer | regulation of translation | 67/1080 | 468/18723 | 4.71e-12 | 7.64e-10 | 67 |
| GO:00340635 | Breast | Precancer | stress granule assembly | 6/1080 | 26/18723 | 3.09e-03 | 2.62e-02 | 6 |
| GO:000641714 | Breast | IDC | regulation of translation | 74/1434 | 468/18723 | 1.67e-09 | 1.53e-07 | 74 |
| GO:000641724 | Breast | DCIS | regulation of translation | 72/1390 | 468/18723 | 2.46e-09 | 2.17e-07 | 72 |
| GO:0038127 | Colorectum | AD | ERBB signaling pathway | 55/3918 | 121/18723 | 1.19e-09 | 8.85e-08 | 55 |
| GO:0007173 | Colorectum | AD | epidermal growth factor receptor signaling pathway | 50/3918 | 108/18723 | 3.08e-09 | 2.07e-07 | 50 |
| GO:0006417 | Colorectum | AD | regulation of translation | 141/3918 | 468/18723 | 1.32e-06 | 4.22e-05 | 141 |
| GO:00064172 | Colorectum | MSS | regulation of translation | 134/3467 | 468/18723 | 4.43e-08 | 2.38e-06 | 134 |
| GO:00071732 | Colorectum | MSS | epidermal growth factor receptor signaling pathway | 43/3467 | 108/18723 | 1.92e-07 | 8.31e-06 | 43 |
| GO:00381272 | Colorectum | MSS | ERBB signaling pathway | 46/3467 | 121/18723 | 3.63e-07 | 1.45e-05 | 46 |
| GO:0017148 | Colorectum | MSS | negative regulation of translation | 64/3467 | 245/18723 | 1.94e-03 | 1.67e-02 | 64 |
| GO:0034249 | Colorectum | MSS | negative regulation of cellular amide metabolic process | 70/3467 | 273/18723 | 2.07e-03 | 1.76e-02 | 70 |
| GO:0006417111 | Esophagus | ESCC | regulation of translation | 304/8552 | 468/18723 | 1.53e-17 | 1.33e-15 | 304 |
| GO:003812718 | Esophagus | ESCC | ERBB signaling pathway | 82/8552 | 121/18723 | 7.23e-07 | 9.40e-06 | 82 |
| GO:000717318 | Esophagus | ESCC | epidermal growth factor receptor signaling pathway | 73/8552 | 108/18723 | 3.36e-06 | 3.73e-05 | 73 |
| GO:003406315 | Esophagus | ESCC | stress granule assembly | 23/8552 | 26/18723 | 6.82e-06 | 6.90e-05 | 23 |
| GO:003424914 | Esophagus | ESCC | negative regulation of cellular amide metabolic process | 144/8552 | 273/18723 | 1.08e-02 | 3.67e-02 | 144 |
| GO:000641712 | Liver | Cirrhotic | regulation of translation | 194/4634 | 468/18723 | 7.28e-16 | 8.79e-14 | 194 |
| GO:003406311 | Liver | Cirrhotic | stress granule assembly | 18/4634 | 26/18723 | 2.21e-06 | 4.10e-05 | 18 |
| GO:003424911 | Liver | Cirrhotic | negative regulation of cellular amide metabolic process | 100/4634 | 273/18723 | 7.34e-06 | 1.13e-04 | 100 |
| Hugo Symbol | Variant Class | Variant Classification | dbSNP RS | HGVSc | HGVSp | HGVSp Short | SWISSPROT | BIOTYPE | SIFT | PolyPhen | Tumor Sample Barcode | Tissue | Histology | Sex | Age | Stage | Therapy Types | Drugs | Outcome |
| GRB7 | SNV | Missense_Mutation | novel | c.118N>T | p.Leu40Phe | p.L40F | Q14451 | protein_coding | deleterious(0.03) | benign(0.112) | TCGA-AO-A0JB-01 | Breast | breast invasive carcinoma | Female | <65 | III/IV | Chemotherapy | cyclophosphamide | SD |
| GRB7 | SNV | Missense_Mutation | | c.549N>A | p.Asp183Glu | p.D183E | Q14451 | protein_coding | deleterious(0.02) | probably_damaging(0.993) | TCGA-B6-A400-01 | Breast | breast invasive carcinoma | Female | <65 | III/IV | Unknown | Unknown | SD |
| GRB7 | SNV | Missense_Mutation | rs368887935 | c.233N>A | p.Arg78Gln | p.R78Q | Q14451 | protein_coding | tolerated(1) | possibly_damaging(0.801) | TCGA-BH-A0BR-01 | Breast | breast invasive carcinoma | Female | <65 | I/II | Unknown | Unknown | SD |
| GRB7 | SNV | Missense_Mutation | | c.461N>A | p.Leu154Gln | p.L154Q | Q14451 | protein_coding | deleterious(0) | probably_damaging(1) | TCGA-BH-A18V-01 | Breast | breast invasive carcinoma | Female | <65 | I/II | Unknown | Unknown | SD |
| GRB7 | SNV | Missense_Mutation | | c.454N>C | p.Glu152Gln | p.E152Q | Q14451 | protein_coding | tolerated(1) | possibly_damaging(0.812) | TCGA-D8-A1J9-01 | Breast | breast invasive carcinoma | Female | <65 | I/II | Unknown | Unknown | SD |
| GRB7 | SNV | Missense_Mutation | | c.189G>C | p.Lys63Asn | p.K63N | Q14451 | protein_coding | deleterious(0.04) | benign(0.012) | TCGA-EW-A1J5-01 | Breast | breast invasive carcinoma | Female | <65 | I/II | Chemotherapy | adriamycin | SD |
| GRB7 | insertion | In_Frame_Ins | novel | c.1602_1603insAGCCATCCACCGCACCCAACTCTGGTTCCACGGGCG | p.Phe534_His535insSerHisProProHisProThrLeuValProArgAla | p.F534_H535insSHPPHPTLVPRA | Q14451 | protein_coding | | | TCGA-A8-A07O-01 | Breast | breast invasive carcinoma | Female | <65 | I/II | Chemotherapy | | CR |
| GRB7 | insertion | In_Frame_Ins | novel | c.120_121insGTGCTAAAGAAAGAGCACTGGAGCCGGGCG | p.Leu40_Cys41insValLeuLysLysGluHisTrpSerArgAla | p.L40_C41insVLKKEHWSRA | Q14451 | protein_coding | | | TCGA-AO-A0JB-01 | Breast | breast invasive carcinoma | Female | <65 | III/IV | Chemotherapy | cyclophosphamide | SD |
| GRB7 | insertion | In_Frame_Ins | novel | c.62_63insTCTGGCAACTGGGTCTGGCAACAAAGTGCTGGA | p.Ser21_Asp22insLeuAlaThrGlySerGlyAsnLysValLeuGlu | p.S21_D22insLATGSGNKVLE | Q14451 | protein_coding | | | TCGA-BH-A0B4-01 | Breast | breast invasive carcinoma | Male | >=65 | III/IV | Hormone Therapy | tamoxiphen | SD |
| GRB7 | insertion | Frame_Shift_Ins | novel | c.942_943insTTGAGGCAGCCCCCGCCCCAGGA | p.Tyr316ArgfsTer80 | p.Y316Rfs*80 | Q14451 | protein_coding | | | TCGA-C8-A12Z-01 | Breast | breast invasive carcinoma | Female | <65 | I/II | Chemotherapy | 5-fluorouracil | CR |


