
|
|||||
|
 | |
| |
| |
| |
| |
| |
|
Gene: GPS1 |
Gene summary for GPS1 |
| Gene information | Species | Human | Gene symbol | GPS1 | Gene ID | 2873 |
| Gene name | G protein pathway suppressor 1 | |
| Gene Alias | COPS1 | |
| Cytomap | 17q25.3 | |
| Gene Type | protein-coding | GO ID | GO:0000165 | UniProtAcc | Q13098 |
Top |
Malignant transformation analysis |
| Identification of the aberrant gene expression in precancerous and cancerous lesions by comparing the gene expression of stem-like cells in diseased tissues with normal stem cells |
| Entrez ID | Symbol | Replicates | Species | Organ | Tissue | Adj P-value | Log2FC | Malignancy |
| 2873 | GPS1 | S015 | Human | Liver | HCC | 7.41e-30 | 1.57e+00 | 0.2375 |
| 2873 | GPS1 | S016 | Human | Liver | HCC | 5.69e-42 | 1.32e+00 | 0.2243 |
| 2873 | GPS1 | S027 | Human | Liver | HCC | 5.55e-12 | 1.29e+00 | 0.2446 |
| 2873 | GPS1 | S028 | Human | Liver | HCC | 1.55e-23 | 1.31e+00 | 0.2503 |
| 2873 | GPS1 | S029 | Human | Liver | HCC | 3.95e-29 | 1.37e+00 | 0.2581 |
| 2873 | GPS1 | C04 | Human | Oral cavity | OSCC | 7.28e-25 | 1.29e+00 | 0.2633 |
| 2873 | GPS1 | C21 | Human | Oral cavity | OSCC | 1.57e-58 | 1.78e+00 | 0.2678 |
| 2873 | GPS1 | C30 | Human | Oral cavity | OSCC | 4.95e-55 | 2.51e+00 | 0.3055 |
| 2873 | GPS1 | C38 | Human | Oral cavity | OSCC | 4.39e-14 | 1.24e+00 | 0.172 |
| 2873 | GPS1 | C43 | Human | Oral cavity | OSCC | 3.36e-44 | 8.74e-01 | 0.1704 |
| 2873 | GPS1 | C46 | Human | Oral cavity | OSCC | 1.80e-09 | 4.44e-01 | 0.1673 |
| 2873 | GPS1 | C51 | Human | Oral cavity | OSCC | 1.05e-24 | 1.09e+00 | 0.2674 |
| 2873 | GPS1 | C57 | Human | Oral cavity | OSCC | 4.23e-06 | 5.10e-01 | 0.1679 |
| 2873 | GPS1 | C06 | Human | Oral cavity | OSCC | 3.88e-11 | 1.42e+00 | 0.2699 |
| 2873 | GPS1 | C08 | Human | Oral cavity | OSCC | 7.33e-42 | 9.03e-01 | 0.1919 |
| 2873 | GPS1 | C09 | Human | Oral cavity | OSCC | 3.89e-08 | 3.91e-01 | 0.1431 |
| 2873 | GPS1 | LN22 | Human | Oral cavity | OSCC | 3.60e-03 | 7.01e-01 | 0.1733 |
| 2873 | GPS1 | LN38 | Human | Oral cavity | OSCC | 2.87e-05 | 1.31e+00 | 0.168 |
| 2873 | GPS1 | LN46 | Human | Oral cavity | OSCC | 3.22e-04 | 4.45e-01 | 0.1666 |
| 2873 | GPS1 | LP15 | Human | Oral cavity | LP | 4.96e-06 | 1.06e+00 | 0.2174 |
| Page: 1 2 3 4 5 6 7 |
| Tissue | Expression Dynamics | Abbreviation |
| Esophagus | 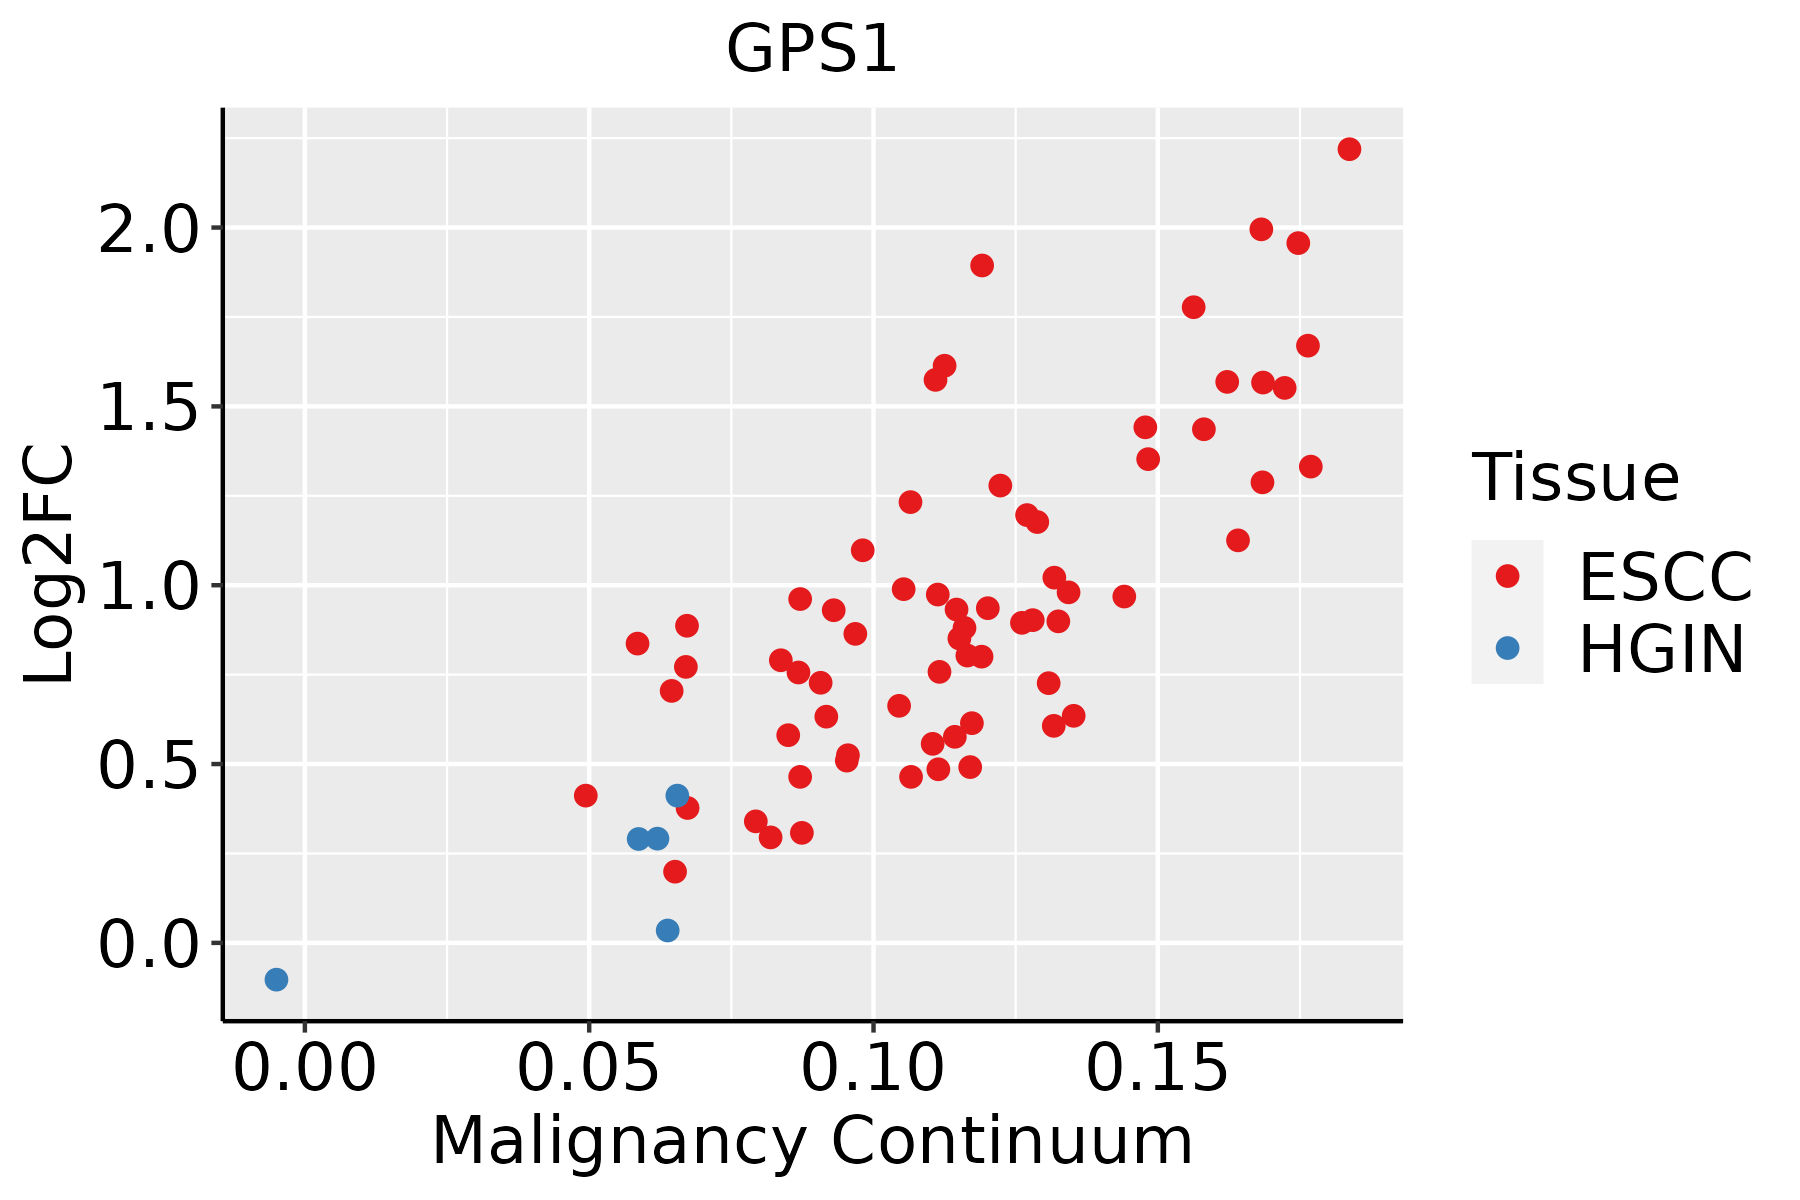 | ESCC: Esophageal squamous cell carcinoma |
| HGIN: High-grade intraepithelial neoplasias | ||
| LGIN: Low-grade intraepithelial neoplasias | ||
| Liver |  | HCC: Hepatocellular carcinoma |
| NAFLD: Non-alcoholic fatty liver disease | ||
| Oral Cavity |  | EOLP: Erosive Oral lichen planus |
| LP: leukoplakia | ||
| NEOLP: Non-erosive oral lichen planus | ||
| OSCC: Oral squamous cell carcinoma | ||
| Skin |  | AK: Actinic keratosis |
| cSCC: Cutaneous squamous cell carcinoma | ||
| SCCIS:squamous cell carcinoma in situ | ||
| Thyroid | 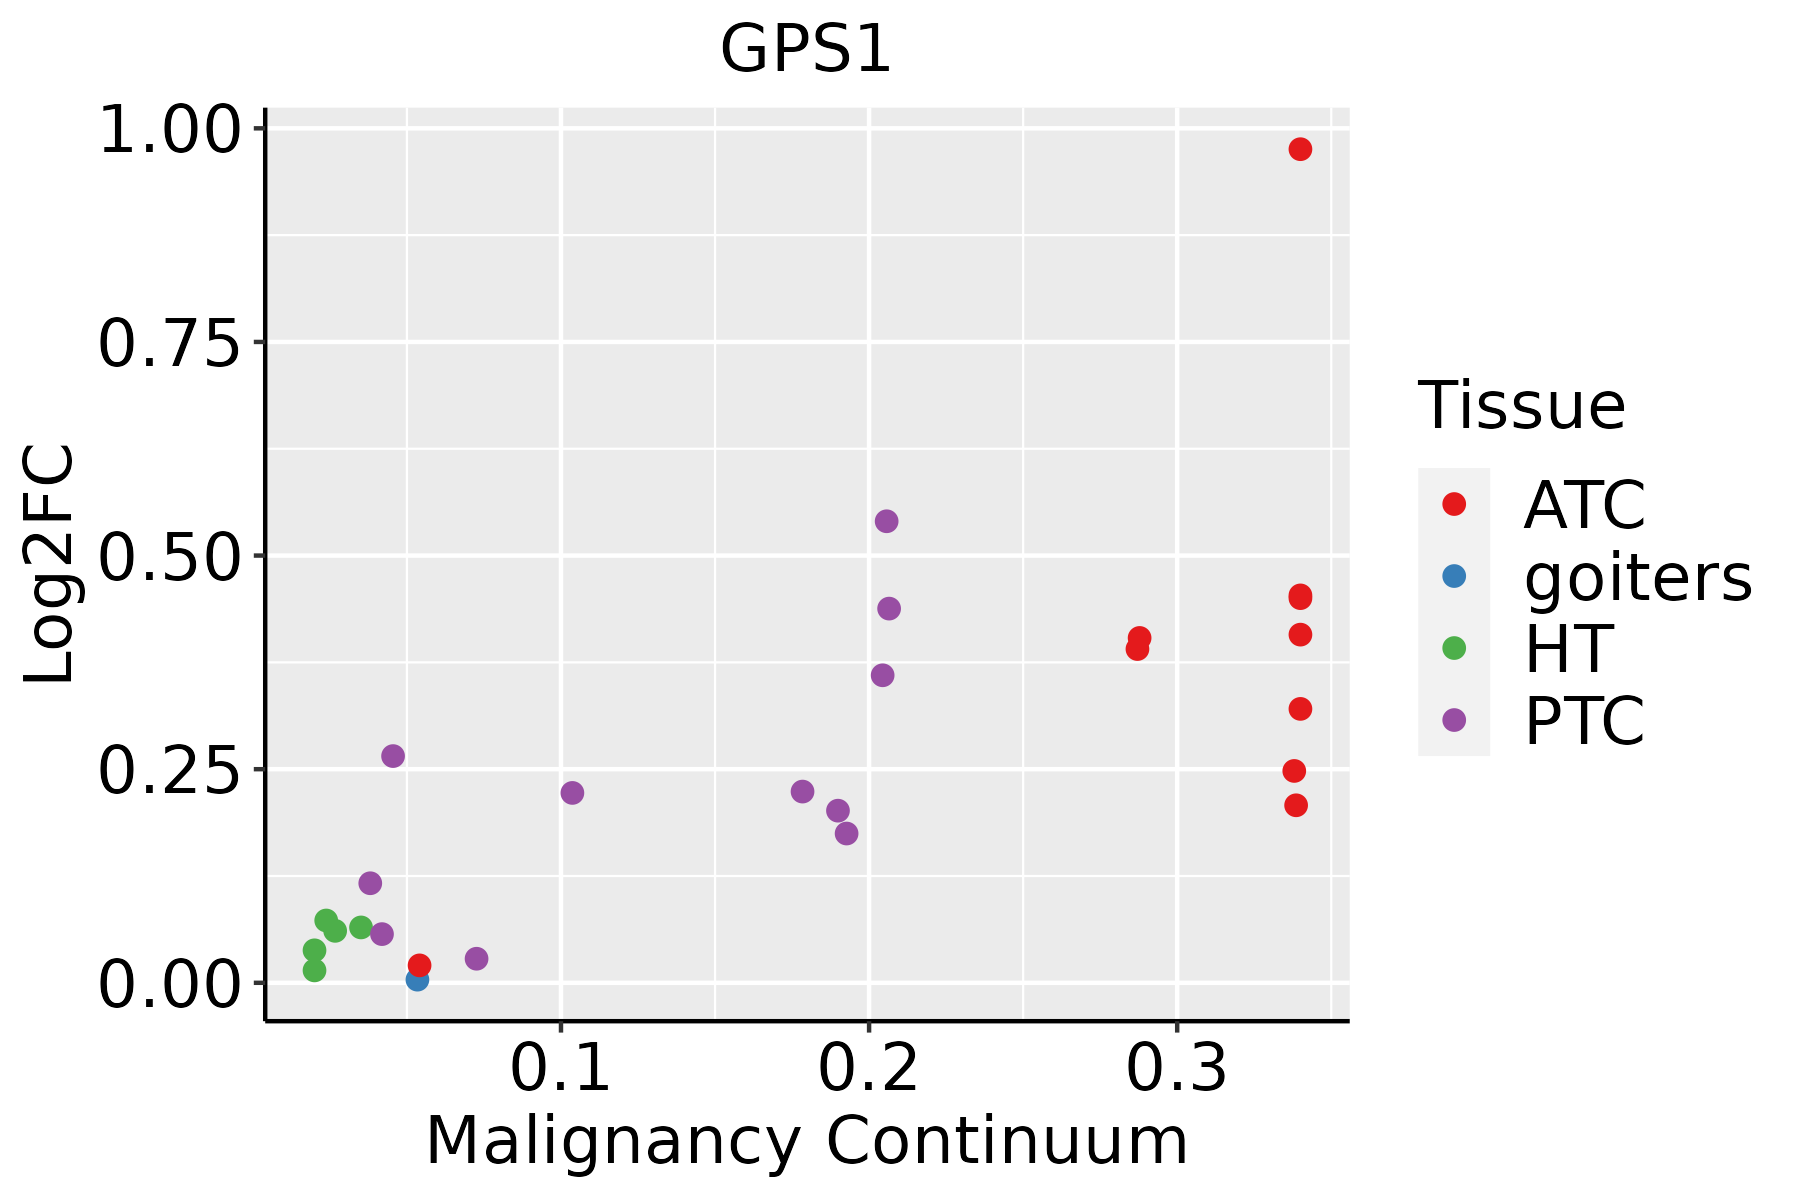 | ATC: Anaplastic thyroid cancer |
| HT: Hashimoto's thyroiditis | ||
| PTC: Papillary thyroid cancer |
| ∗log2FC in expression of this searched gene in stem-like cells from each diseased tissue sample relative to stem-like cells in normal samples in each tissue plotted against the malignancy continuum. Samples are colored based on if they are from different disease stage. |
Top |
Malignant transformation related pathway analysis |
| Find out the enriched GO biological processes and KEGG pathways involved in transition from healthy to precancer to cancer |
| Tissue | Disease Stage | Enriched GO biological Processes |
| Colorectum | AD |  |
| Colorectum | SER |  |
| Colorectum | MSS |  |
| Colorectum | MSI-H |  |
| Colorectum | FAP |  |
| ∗Top 15 enriched GO BP terms are showed in the bar plot of each disease state in each tissue. Each row represents a significant GO biological process which is colored according to the -log10(p.adjust). |
| Page: 1 2 3 4 5 6 7 8 9 |
| GO ID | Tissue | Disease Stage | Description | Gene Ratio | Bg Ratio | pvalue | p.adjust | Count |
| GO:00510566 | Cervix | CC | regulation of small GTPase mediated signal transduction | 75/2311 | 302/18723 | 1.54e-09 | 1.74e-07 | 75 |
| GO:00072656 | Cervix | CC | Ras protein signal transduction | 79/2311 | 337/18723 | 9.49e-09 | 7.77e-07 | 79 |
| GO:00465785 | Cervix | CC | regulation of Ras protein signal transduction | 44/2311 | 189/18723 | 2.05e-05 | 3.73e-04 | 44 |
| GO:0007265 | Colorectum | AD | Ras protein signal transduction | 104/3918 | 337/18723 | 1.01e-05 | 2.35e-04 | 104 |
| GO:0051056 | Colorectum | AD | regulation of small GTPase mediated signal transduction | 94/3918 | 302/18723 | 1.81e-05 | 3.76e-04 | 94 |
| GO:0046578 | Colorectum | AD | regulation of Ras protein signal transduction | 56/3918 | 189/18723 | 2.85e-03 | 2.14e-02 | 56 |
| GO:00072651 | Colorectum | MSS | Ras protein signal transduction | 91/3467 | 337/18723 | 7.20e-05 | 1.21e-03 | 91 |
| GO:00510561 | Colorectum | MSS | regulation of small GTPase mediated signal transduction | 82/3467 | 302/18723 | 1.31e-04 | 1.99e-03 | 82 |
| GO:00510562 | Colorectum | FAP | regulation of small GTPase mediated signal transduction | 78/2622 | 302/18723 | 3.25e-08 | 2.85e-06 | 78 |
| GO:00072652 | Colorectum | FAP | Ras protein signal transduction | 80/2622 | 337/18723 | 9.61e-07 | 4.33e-05 | 80 |
| GO:00465781 | Colorectum | FAP | regulation of Ras protein signal transduction | 47/2622 | 189/18723 | 4.67e-05 | 9.60e-04 | 47 |
| GO:00510563 | Colorectum | CRC | regulation of small GTPase mediated signal transduction | 69/2078 | 302/18723 | 3.34e-09 | 9.08e-07 | 69 |
| GO:00072653 | Colorectum | CRC | Ras protein signal transduction | 70/2078 | 337/18723 | 1.49e-07 | 1.66e-05 | 70 |
| GO:00465782 | Colorectum | CRC | regulation of Ras protein signal transduction | 43/2078 | 189/18723 | 3.26e-06 | 1.47e-04 | 43 |
| GO:00003383 | Esophagus | HGIN | protein deneddylation | 6/2587 | 10/18723 | 8.81e-04 | 1.13e-02 | 6 |
| GO:00706463 | Esophagus | HGIN | protein modification by small protein removal | 34/2587 | 157/18723 | 4.68e-03 | 4.02e-02 | 34 |
| GO:00086544 | Esophagus | ESCC | phospholipid biosynthetic process | 162/8552 | 253/18723 | 2.59e-09 | 5.73e-08 | 162 |
| GO:003109818 | Esophagus | ESCC | stress-activated protein kinase signaling cascade | 154/8552 | 247/18723 | 8.53e-08 | 1.44e-06 | 154 |
| GO:005140318 | Esophagus | ESCC | stress-activated MAPK cascade | 147/8552 | 239/18723 | 5.43e-07 | 7.18e-06 | 147 |
| GO:00066446 | Esophagus | ESCC | phospholipid metabolic process | 218/8552 | 383/18723 | 5.37e-06 | 5.59e-05 | 218 |
| Page: 1 2 3 4 |
| Pathway ID | Tissue | Disease Stage | Description | Gene Ratio | Bg Ratio | pvalue | p.adjust | qvalue | Count |
| Page: 1 |
Top |
Cell-cell communication analysis |
| Identification of potential cell-cell interactions between two cell types and their ligand-receptor pairs for different disease states |
| Ligand | Receptor | LRpair | Pathway | Tissue | Disease Stage |
| Page: 1 |
Top |
Single-cell gene regulatory network inference analysis |
| Find out the significant the regulons (TFs) and the target genes of each regulon across cell types for different disease states |
| TF | Cell Type | Tissue | Disease Stage | Target Gene | RSS | Regulon Activity |
| ∗The dot plots of a searched regulon are shown for all cell subpopulations in each disease state of each tissue based on the regulon specific score inferred using pySCENIC and by calculating the average expression. |
| Page: 1 |
Top |
Somatic mutation of malignant transformation related genes |
| Annotation of somatic variants for genes involved in malignant transformation |
| Hugo Symbol | Variant Class | Variant Classification | dbSNP RS | HGVSc | HGVSp | HGVSp Short | SWISSPROT | BIOTYPE | SIFT | PolyPhen | Tumor Sample Barcode | Tissue | Histology | Sex | Age | Stage | Therapy Types | Drugs | Outcome |
| GPS1 | SNV | Missense_Mutation | novel | c.373N>T | p.Thr125Ser | p.T125S | Q13098 | protein_coding | tolerated(0.21) | possibly_damaging(0.821) | TCGA-EA-A3HU-01 | Cervix | cervical & endocervical cancer | Female | <65 | I/II | Unknown | Unknown | SD |
| GPS1 | SNV | Missense_Mutation | c.1417G>C | p.Glu473Gln | p.E473Q | Q13098 | protein_coding | tolerated(0.44) | benign(0.426) | TCGA-EK-A3GK-01 | Cervix | cervical & endocervical cancer | Female | <65 | I/II | Unknown | Unknown | SD | |
| GPS1 | SNV | Missense_Mutation | novel | c.784N>C | p.Glu262Gln | p.E262Q | Q13098 | protein_coding | deleterious(0.01) | benign(0.215) | TCGA-MY-A913-01 | Cervix | cervical & endocervical cancer | Female | <65 | I/II | Chemotherapy | cisplatin | CR |
| GPS1 | SNV | Missense_Mutation | c.182N>G | p.Val61Gly | p.V61G | Q13098 | protein_coding | tolerated(0.23) | benign(0.003) | TCGA-AA-3713-01 | Colorectum | colon adenocarcinoma | Male | >=65 | III/IV | Chemotherapy | 5-fluorouracil | PR | |
| GPS1 | SNV | Missense_Mutation | c.1300N>A | p.Ala434Thr | p.A434T | Q13098 | protein_coding | tolerated(0.18) | benign(0.003) | TCGA-AD-6964-01 | Colorectum | colon adenocarcinoma | Male | <65 | III/IV | Chemotherapy | folfox | PD | |
| GPS1 | SNV | Missense_Mutation | c.604N>A | p.Asp202Asn | p.D202N | Q13098 | protein_coding | tolerated(0.53) | possibly_damaging(0.614) | TCGA-D5-6530-01 | Colorectum | colon adenocarcinoma | Male | <65 | I/II | Unknown | Unknown | SD | |
| GPS1 | SNV | Missense_Mutation | rs750722265 | c.866C>T | p.Ala289Val | p.A289V | Q13098 | protein_coding | deleterious(0.01) | probably_damaging(0.977) | TCGA-F4-6856-01 | Colorectum | colon adenocarcinoma | Male | <65 | I/II | Ancillary | leucovorin | CR |
| GPS1 | SNV | Missense_Mutation | c.1474N>T | p.Arg492Trp | p.R492W | Q13098 | protein_coding | deleterious(0) | probably_damaging(0.999) | TCGA-NH-A5IV-01 | Colorectum | colon adenocarcinoma | Female | >=65 | I/II | Unknown | Unknown | SD | |
| GPS1 | SNV | Missense_Mutation | novel | c.1216N>T | p.Arg406Cys | p.R406C | Q13098 | protein_coding | deleterious(0) | probably_damaging(1) | TCGA-EI-6917-01 | Colorectum | rectum adenocarcinoma | Male | <65 | III/IV | Chemotherapy | 5fluorouracil+oxaciplatina+l-folinian | SD |
| GPS1 | SNV | Missense_Mutation | rs749863538 | c.262N>A | p.Ala88Thr | p.A88T | Q13098 | protein_coding | deleterious(0.03) | benign(0.392) | TCGA-A5-A0VP-01 | Endometrium | uterine corpus endometrioid carcinoma | Female | >=65 | I/II | Unknown | Unknown | SD |
| Page: 1 2 3 4 5 6 |
Top |
Related drugs of malignant transformation related genes |
| Identification of chemicals and drugs interact with genes involved in malignant transfromation |
| (DGIdb 4.0) |
| Entrez ID | Symbol | Category | Interaction Types | Drug Claim Name | Drug Name | PMIDs |
| Page: 1 |

Copyright 2023-Present -The University of Texas Health Science Center at Houston |