Schematic overview of the cellular and molecular mechanisms involved in the cancer progression, including the proposed cellular and molecular mechanisms in cancer cells trajectory. AT1: alveolar type 1 cells; AT2: alveolar type 2 cells; AAH: atypical adenomatous hyperplasia; AIS: adenocarcinoma in situ; MIA: minimally invasive adenocarcinoma; IA: invasive adenocarcinoma; EMT: epithelial-mesenchymal transition

Home

Download

Statistics

Help

Contact

Center for Computational Systems Medicine
leaf

Gene summary

leaf

Malignant transformation analysis

leaf

Malignant transformation related pathway analysis

leaf

Cell-cell communication analysis

leaf

Single-cell gene regulatory network inference analysis

leaf

Somatic mutation of malignant transformation related genes

leaf

Related drugs of malignant transformation related genes

Gene: GOLGA2

Gene summary for GOLGA2

check button Gene summary.

Gene informationSpeciesHuman
Gene symbol

GOLGA2

Gene ID

2801

Gene namegolgin A2
Gene AliasGM130
Cytomap9q34.11
Gene Typeprotein-coding
GO ID

GO:0000003

UniProtAcc

Q08379


Top

Malignant transformation analysis

check button Identification of the aberrant gene expression in precancerous and cancerous lesions by comparing the gene expression of stem-like cells in diseased tissues with normal stem cells
check button Malignant transformation involving gene list.
Entrez IDSymbolReplicatesSpeciesOrganTissueAdj P-valueLog2FCMalignancy
2801GOLGA2S029HumanLiverHCC1.31e-181.27e+000.2581
2801GOLGA2C04HumanOral cavityOSCC9.71e-095.49e-010.2633
2801GOLGA2C21HumanOral cavityOSCC5.28e-279.86e-010.2678
2801GOLGA2C30HumanOral cavityOSCC2.13e-441.87e+000.3055
2801GOLGA2C43HumanOral cavityOSCC7.13e-031.45e-010.1704
2801GOLGA2C46HumanOral cavityOSCC1.95e-063.02e-010.1673
2801GOLGA2C51HumanOral cavityOSCC7.83e-169.45e-010.2674
2801GOLGA2C57HumanOral cavityOSCC3.07e-135.82e-010.1679
2801GOLGA2C06HumanOral cavityOSCC4.55e-101.45e+000.2699
2801GOLGA2C08HumanOral cavityOSCC1.74e-134.00e-010.1919
2801GOLGA2C09HumanOral cavityOSCC3.36e-135.07e-010.1431
2801GOLGA2LN22HumanOral cavityOSCC4.50e-048.79e-010.1733
2801GOLGA2LN38HumanOral cavityOSCC1.58e-029.13e-010.168
2801GOLGA2LN46HumanOral cavityOSCC1.30e-032.32e-010.1666
2801GOLGA2LP15HumanOral cavityLP1.56e-037.85e-010.2174
2801GOLGA2SYSMH1HumanOral cavityOSCC2.59e-378.43e-010.1127
2801GOLGA2SYSMH2HumanOral cavityOSCC7.27e-277.12e-010.2326
2801GOLGA2SYSMH3HumanOral cavityOSCC1.68e-367.66e-010.2442
2801GOLGA2SYSMH5HumanOral cavityOSCC8.00e-072.65e-010.0647
2801GOLGA2SYSMH6HumanOral cavityOSCC6.42e-134.22e-010.1275
Page: 1 2 3 4 5 6 7 

check button Transcriptomic changes along malignancy continuum.
TissueExpression DynamicsAbbreviation
EsophagusThe image shows the transcriptomic changes along malignancy continuum.log2FC in expression of this searched gene in stem-like cells from each diseased tissue sample relative to stem-like cells in normal samples in each tissue plotted against the malignancy continuum. Samples are colored based on if they are from different disease stage.
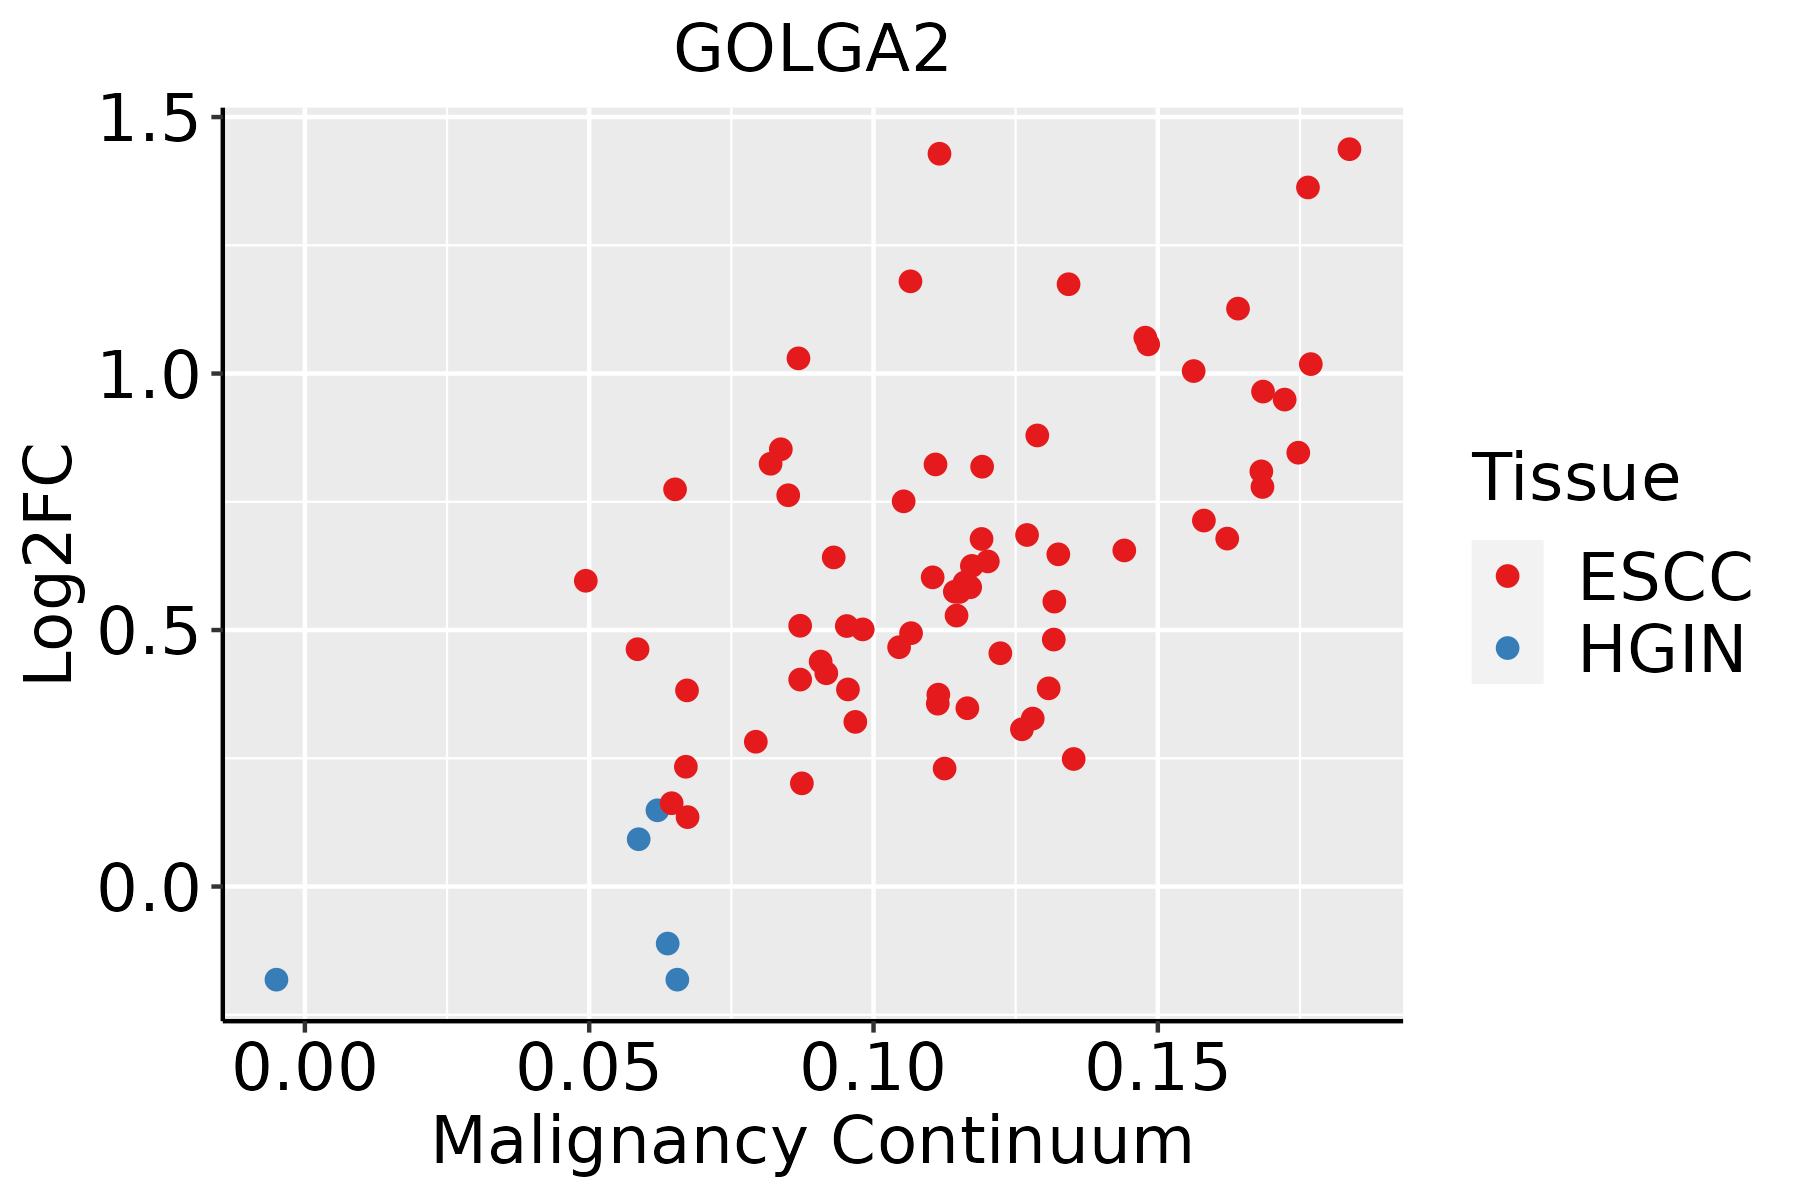
ESCC: Esophageal squamous cell carcinoma
HGIN: High-grade intraepithelial neoplasias
LGIN: Low-grade intraepithelial neoplasias
LiverThe image shows the transcriptomic changes along malignancy continuum.log2FC in expression of this searched gene in stem-like cells from each diseased tissue sample relative to stem-like cells in normal samples in each tissue plotted against the malignancy continuum. Samples are colored based on if they are from different disease stage.
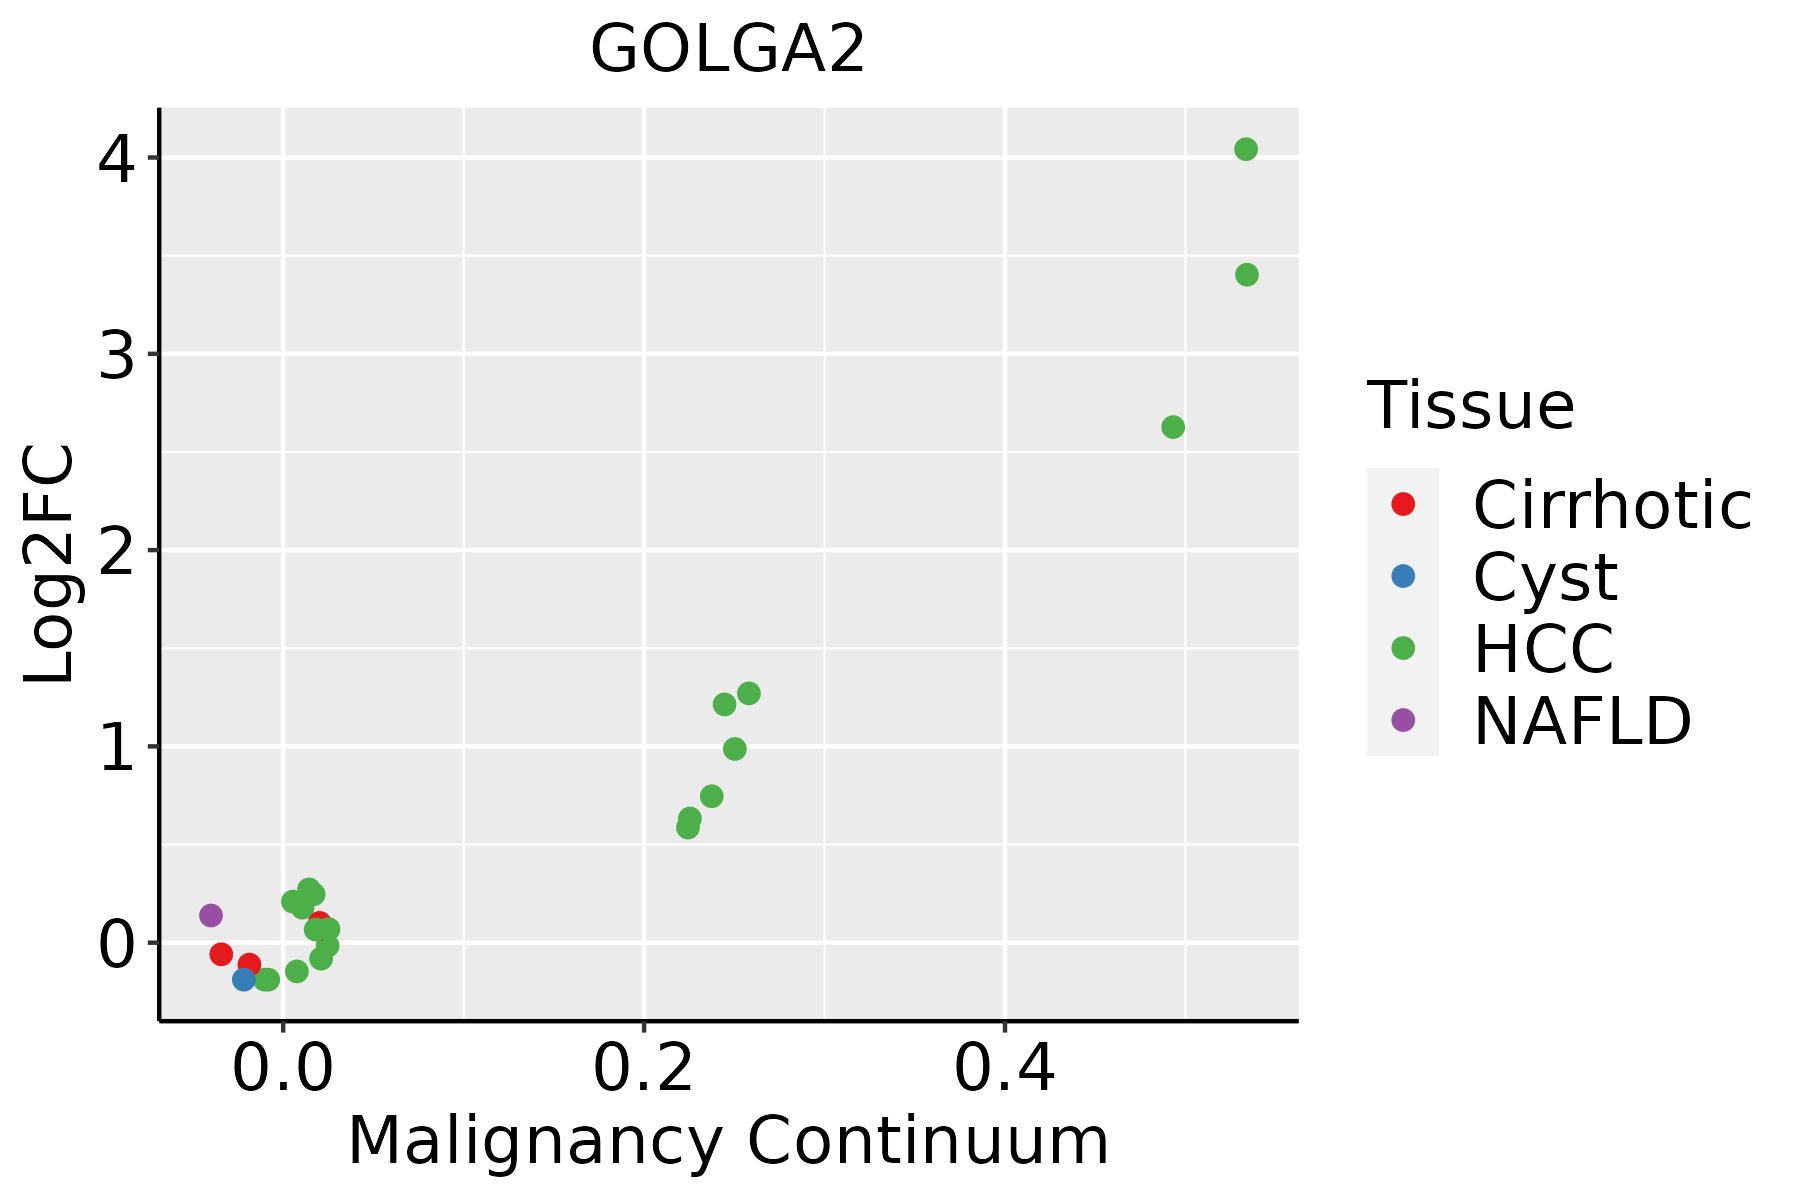
HCC: Hepatocellular carcinoma
NAFLD: Non-alcoholic fatty liver disease
Oral CavityThe image shows the transcriptomic changes along malignancy continuum.log2FC in expression of this searched gene in stem-like cells from each diseased tissue sample relative to stem-like cells in normal samples in each tissue plotted against the malignancy continuum. Samples are colored based on if they are from different disease stage.EOLP: Erosive Oral lichen planus
LP: leukoplakia
NEOLP: Non-erosive oral lichen planus
OSCC: Oral squamous cell carcinoma
ProstateThe image shows the transcriptomic changes along malignancy continuum.log2FC in expression of this searched gene in stem-like cells from each diseased tissue sample relative to stem-like cells in normal samples in each tissue plotted against the malignancy continuum. Samples are colored based on if they are from different disease stage.
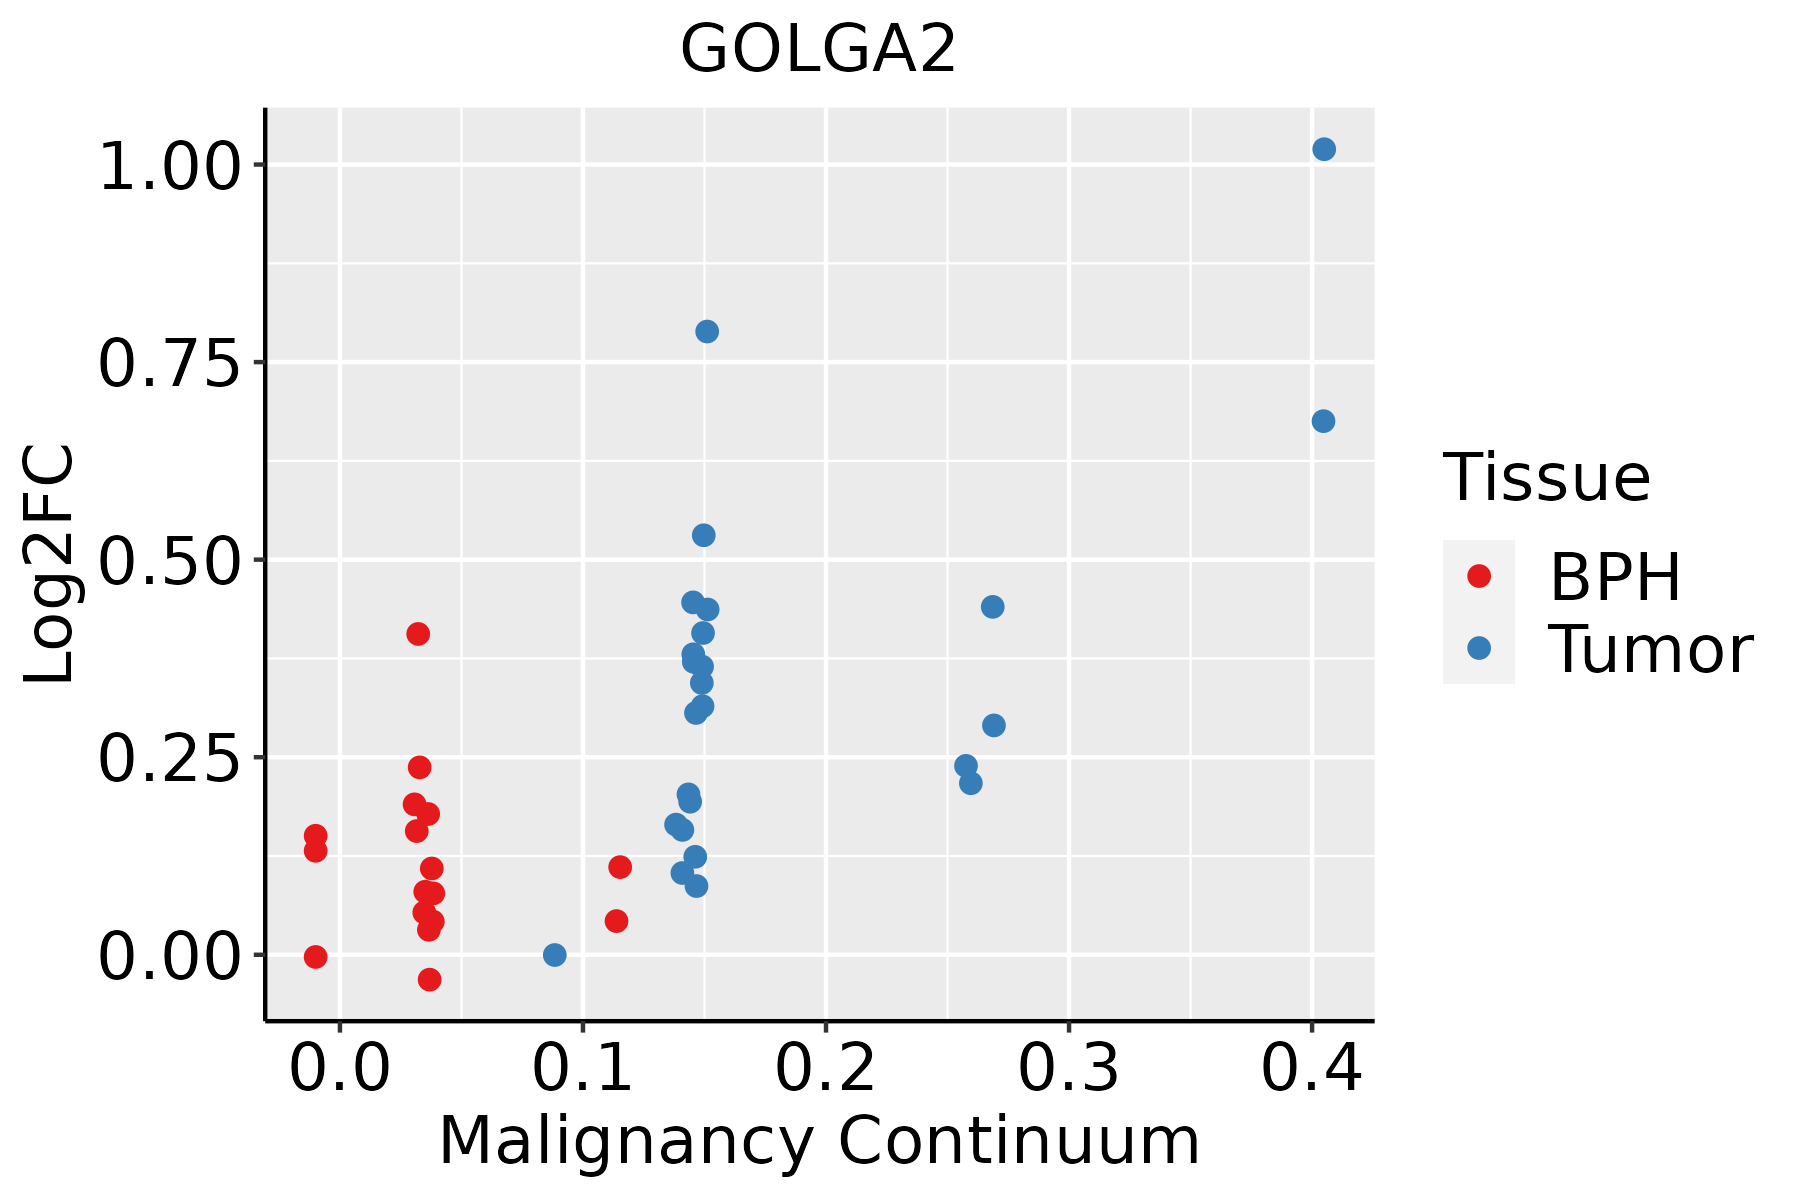
BPH: Benign Prostatic Hyperplasia
SkinThe image shows the transcriptomic changes along malignancy continuum.log2FC in expression of this searched gene in stem-like cells from each diseased tissue sample relative to stem-like cells in normal samples in each tissue plotted against the malignancy continuum. Samples are colored based on if they are from different disease stage.
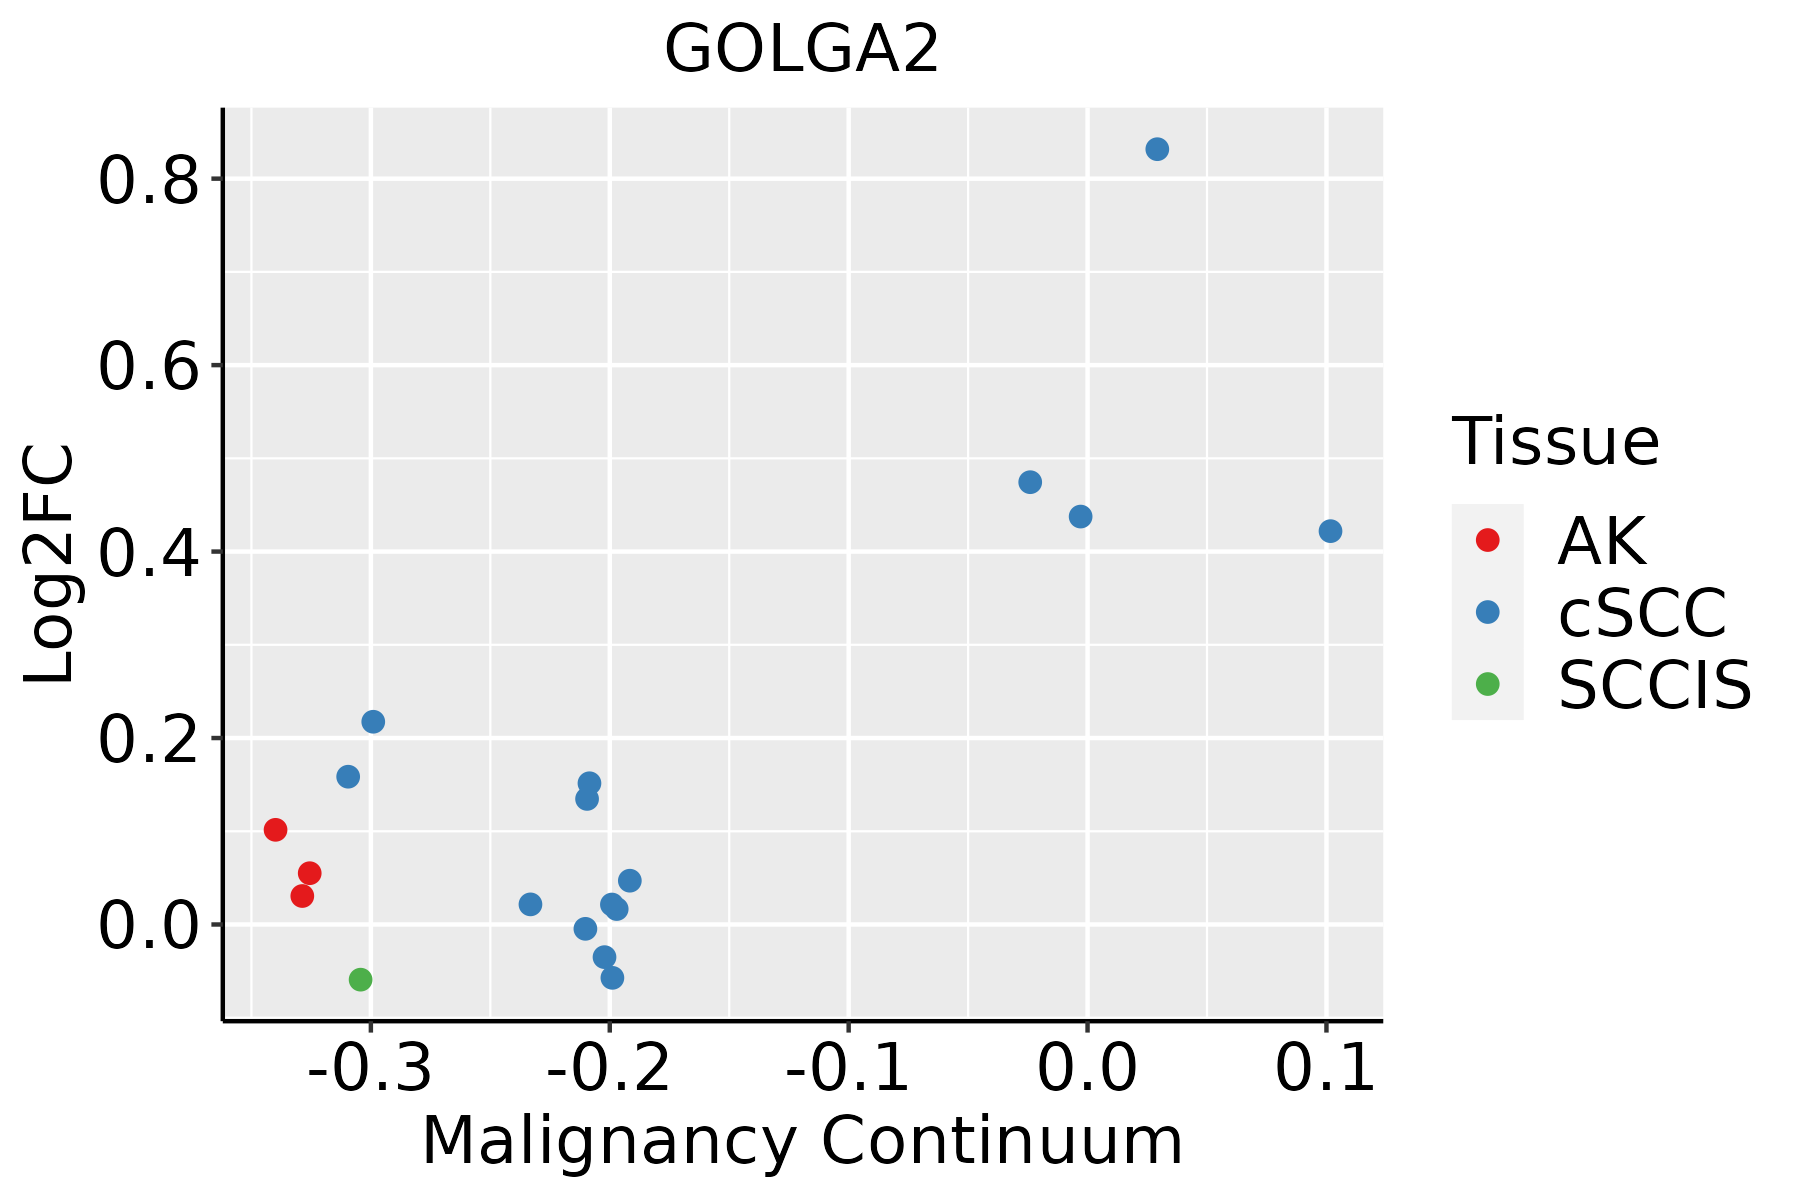
AK: Actinic keratosis
cSCC: Cutaneous squamous cell carcinoma
SCCIS:squamous cell carcinoma in situ
ThyroidThe image shows the transcriptomic changes along malignancy continuum.log2FC in expression of this searched gene in stem-like cells from each diseased tissue sample relative to stem-like cells in normal samples in each tissue plotted against the malignancy continuum. Samples are colored based on if they are from different disease stage.
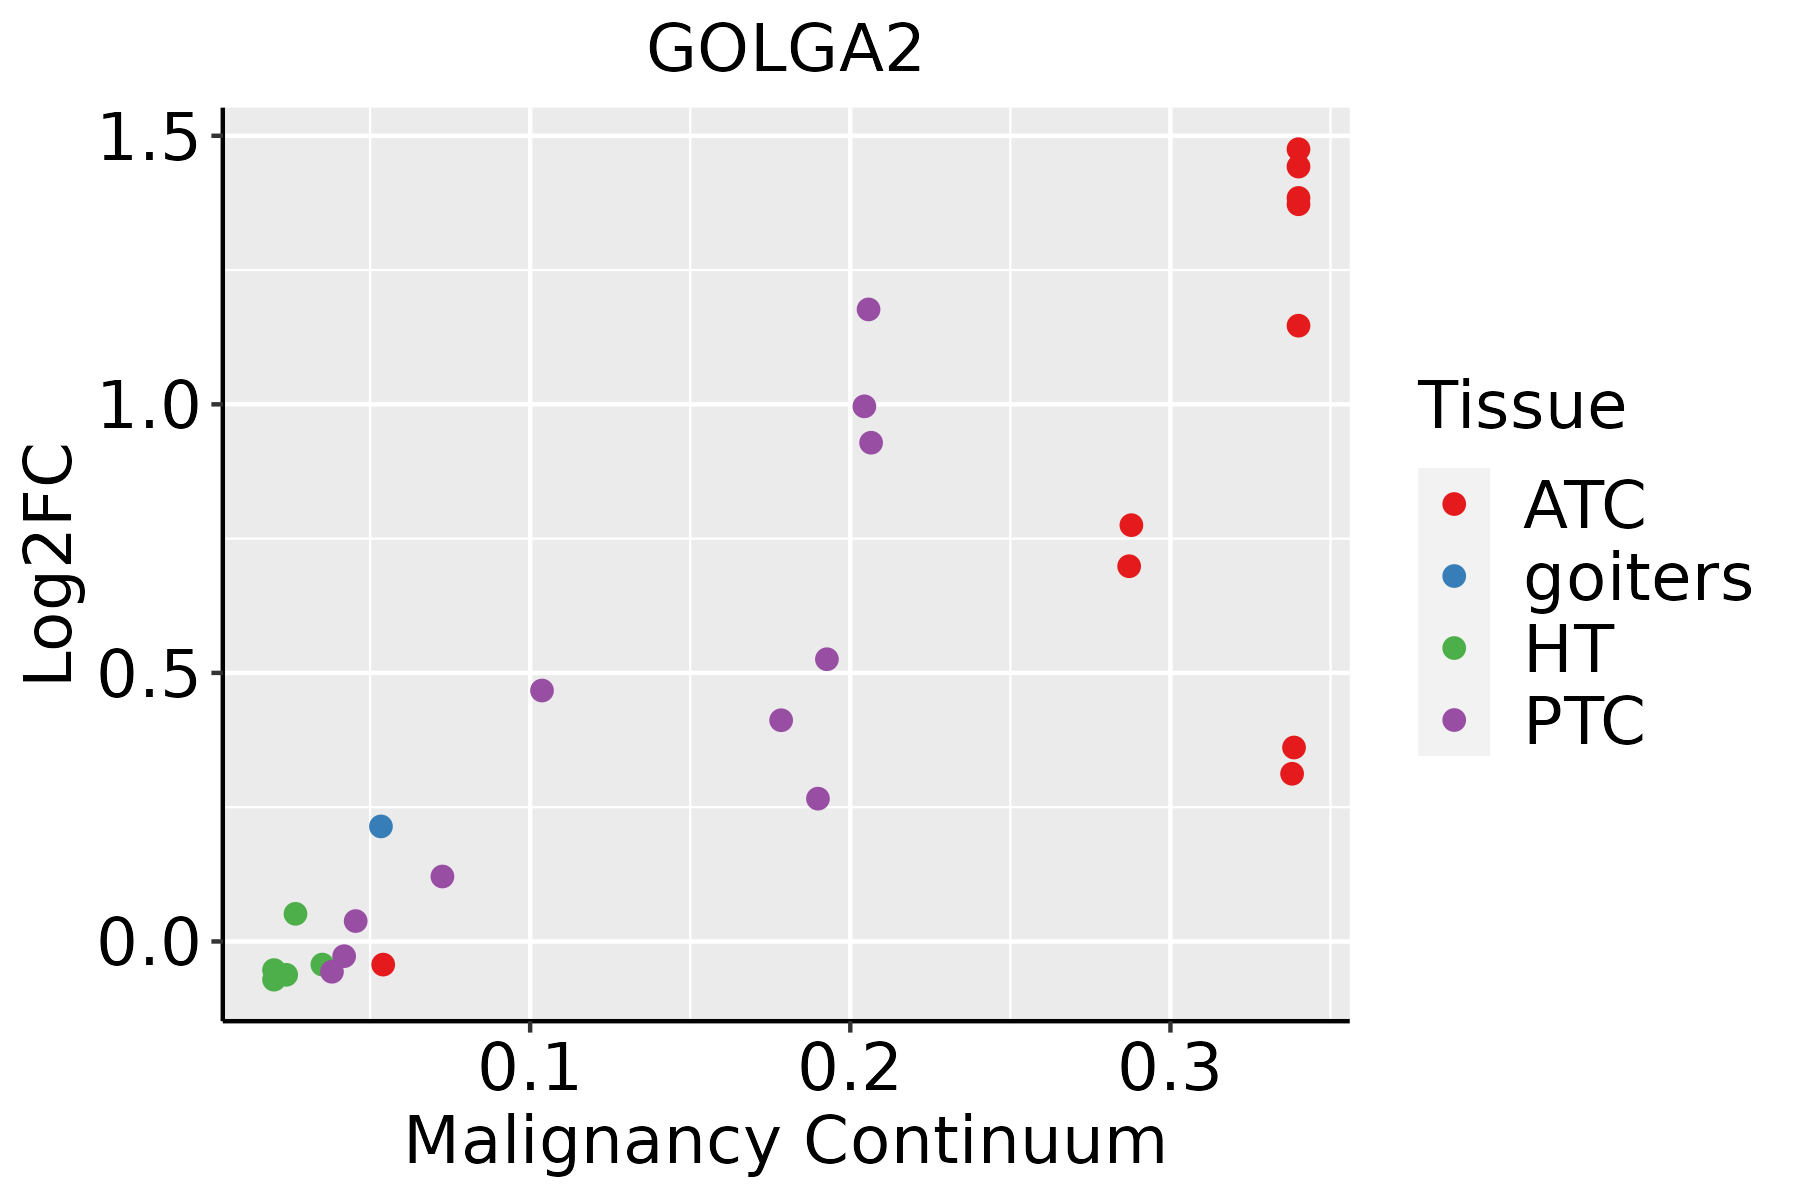
ATC: Anaplastic thyroid cancer
HT: Hashimoto's thyroiditis
PTC: Papillary thyroid cancer
∗log2FC in expression of this searched gene in stem-like cells from each diseased tissue sample relative to stem-like cells in normal samples in each tissue plotted against the malignancy continuum. Samples are colored based on if they are from different disease stage.

Top

Malignant transformation related pathway analysis

check buttonFind out the enriched GO biological processes and KEGG pathways involved in transition from healthy to precancer to cancer
check button Figure of enriched GO biological processes.
TissueDisease StageEnriched GO biological Processes
ColorectumADGO analysis - Figure of enriched GO biological processes: Top 15 enriched GO BP terms are showed in the bar plot of each disease state in each tissue. Each row represents a significant GO biological process which is colored according to the -log10(p.adjust).
ColorectumSERGO analysis - Figure of enriched GO biological processes: Top 15 enriched GO BP terms are showed in the bar plot of each disease state in each tissue. Each row represents a significant GO biological process which is colored according to the -log10(p.adjust).
ColorectumMSSGO analysis - Figure of enriched GO biological processes: Top 15 enriched GO BP terms are showed in the bar plot of each disease state in each tissue. Each row represents a significant GO biological process which is colored according to the -log10(p.adjust).
ColorectumMSI-HGO analysis - Figure of enriched GO biological processes: Top 15 enriched GO BP terms are showed in the bar plot of each disease state in each tissue. Each row represents a significant GO biological process which is colored according to the -log10(p.adjust).
ColorectumFAPGO analysis - Figure of enriched GO biological processes: Top 15 enriched GO BP terms are showed in the bar plot of each disease state in each tissue. Each row represents a significant GO biological process which is colored according to the -log10(p.adjust).
∗Top 15 enriched GO BP terms are showed in the bar plot of each disease state in each tissue. Each row represents a significant GO biological process which is colored according to the -log10(p.adjust).
Page: 1 2 3 4 5 6 7 8 9 

check button Enriched GO biological processes.
GO IDTissueDisease StageDescriptionGene RatioBg Ratiopvaluep.adjustCount
GO:004819317EsophagusHGINGolgi vesicle transport83/2587296/187238.59e-118.89e-0983
GO:000989520EsophagusHGINnegative regulation of catabolic process87/2587320/187231.74e-101.68e-0887
GO:003133026EsophagusHGINnegative regulation of cellular catabolic process74/2587262/187236.27e-105.30e-0874
GO:001050616EsophagusHGINregulation of autophagy84/2587317/187231.39e-091.08e-0784
GO:002241120EsophagusHGINcellular component disassembly102/2587443/187238.31e-084.33e-06102
GO:00068889EsophagusHGINendoplasmic reticulum to Golgi vesicle-mediated transport40/2587130/187234.67e-072.07e-0540
GO:19030089EsophagusHGINorganelle disassembly36/2587114/187238.60e-073.58e-0536
GO:00105076EsophagusHGINnegative regulation of autophagy27/258785/187231.72e-054.71e-0427
GO:005109825EsophagusHGINregulation of binding78/2587363/187233.73e-059.30e-0478
GO:005125826EsophagusHGINprotein polymerization66/2587297/187234.96e-051.19e-0366
GO:00070527EsophagusHGINmitotic spindle organization31/2587120/187233.35e-045.50e-0331
GO:01400146EsophagusHGINmitotic nuclear division61/2587287/187233.38e-045.55e-0361
GO:19028507EsophagusHGINmicrotubule cytoskeleton organization involved in mitosis36/2587147/187233.61e-045.68e-0336
GO:00070518EsophagusHGINspindle organization42/2587184/187236.07e-048.49e-0342
GO:00903077EsophagusHGINmitotic spindle assembly18/258765/187232.46e-032.45e-0218
GO:003209110EsophagusHGINnegative regulation of protein binding23/258794/187233.92e-033.54e-0223
GO:005110020EsophagusHGINnegative regulation of binding35/2587162/187234.32e-033.84e-0235
GO:004819318EsophagusESCCGolgi vesicle transport231/8552296/187231.82e-309.63e-28231
GO:014001414EsophagusESCCmitotic nuclear division218/8552287/187236.17e-261.78e-23218
GO:0022411111EsophagusESCCcellular component disassembly305/8552443/187231.94e-234.57e-21305
Page: 1 2 3 4 5 6 7 8 9 10 11 12 13 14 15 16 

check button Enriched KEGG pathways.
Pathway IDTissueDisease StageDescriptionGene RatioBg Ratiopvaluep.adjustqvalueCount
Page: 1 

Top

Cell-cell communication analysis

check buttonIdentification of potential cell-cell interactions between two cell types and their ligand-receptor pairs for different disease states
LigandReceptorLRpairPathwayTissueDisease Stage
Page: 1 

Top

Single-cell gene regulatory network inference analysis

check buttonFind out the significant the regulons (TFs) and the target genes of each regulon across cell types for different disease states
TFCell TypeTissueDisease StageTarget GeneRSSRegulon Activity
∗The dot plots of a searched regulon are shown for all cell subpopulations in each disease state of each tissue based on the regulon specific score inferred using pySCENIC and by calculating the average expression.
Page: 1 

Top

Somatic mutation of malignant transformation related genes

check buttonAnnotation of somatic variants for genes involved in malignant transformation
Hugo SymbolVariant ClassVariant ClassificationdbSNP RSHGVScHGVSpHGVSp ShortSWISSPROTBIOTYPESIFTPolyPhenTumor Sample BarcodeTissueHistologySexAgeStageTherapy TypesDrugsOutcome
GOLGA2SNVMissense_Mutationc.50C>Tp.Thr17Ilep.T17IQ08379protein_codingdeleterious(0)possibly_damaging(0.602)TCGA-BH-A0DG-01Breastbreast invasive carcinomaFemale<65I/IIChemotherapytaxotereCR
GOLGA2SNVMissense_Mutationc.1205G>Tp.Gly402Valp.G402VQ08379protein_codingtolerated(0.11)benign(0.053)TCGA-BH-A18P-01Breastbreast invasive carcinomaFemale<65I/IIUnknownUnknownPD
GOLGA2SNVMissense_Mutationnovelc.837G>Cp.Gln279Hisp.Q279HQ08379protein_codingdeleterious(0.05)benign(0.363)TCGA-LL-A5YO-01Breastbreast invasive carcinomaFemale<65I/IIChemotherapytaxotereCR
GOLGA2SNVMissense_Mutationnovelc.570N>Tp.Gln190Hisp.Q190HQ08379protein_codingdeleterious(0.04)benign(0.243)TCGA-2W-A8YY-01Cervixcervical & endocervical cancerFemale<65I/IIChemotherapycisplatinCR
GOLGA2SNVMissense_Mutationc.1145T>Gp.Val382Glyp.V382GQ08379protein_codingdeleterious(0)benign(0.058)TCGA-C5-A1BQ-01Cervixcervical & endocervical cancerFemale>=65III/IVChemotherapycisplatinCR
GOLGA2SNVMissense_Mutationc.1145N>Gp.Val382Glyp.V382GQ08379protein_codingdeleterious(0)benign(0.058)TCGA-C5-A3HL-01Cervixcervical & endocervical cancerFemale>=65I/IIUnknownUnknownSD
GOLGA2SNVMissense_Mutationnovelc.2533N>Ap.Glu845Lysp.E845KQ08379protein_codingtolerated(0.05)benign(0.259)TCGA-DS-A1OA-01Cervixcervical & endocervical cancerFemale>=65I/IIChemotherapycarboplatinPD
GOLGA2SNVMissense_Mutationc.2659N>Ap.Glu887Lysp.E887KQ08379protein_codingtolerated(0.08)benign(0.13)TCGA-VS-A8EJ-01Cervixcervical & endocervical cancerFemale<65I/IIChemotherapycisplatinPD
GOLGA2SNVMissense_Mutationnovelc.97C>Gp.Gln33Glup.Q33EQ08379protein_codingtolerated(0.09)probably_damaging(0.994)TCGA-VS-AA62-01Cervixcervical & endocervical cancerFemale<65I/IIChemotherapycisplatinPD
GOLGA2SNVMissense_Mutationc.2290C>Tp.Arg764Cysp.R764CQ08379protein_codingtolerated(0.29)benign(0.003)TCGA-A6-2686-01Colorectumcolon adenocarcinomaFemale>=65I/IIUnknownUnknownSD
Page: 1 2 3 4 5 6 7 8 9 10 11 

Top

Related drugs of malignant transformation related genes

check buttonIdentification of chemicals and drugs interact with genes involved in malignant transfromation
(DGIdb 4.0)
Entrez IDSymbolCategoryInteraction TypesDrug Claim NameDrug NamePMIDs
Page: 1