Schematic overview of the cellular and molecular mechanisms involved in the cancer progression, including the proposed cellular and molecular mechanisms in cancer cells trajectory. AT1: alveolar type 1 cells; AT2: alveolar type 2 cells; AAH: atypical adenomatous hyperplasia; AIS: adenocarcinoma in situ; MIA: minimally invasive adenocarcinoma; IA: invasive adenocarcinoma; EMT: epithelial-mesenchymal transition

Home

Download

Statistics

Help

Contact

Center for Computational Systems Medicine
leaf

Gene summary

leaf

Malignant transformation analysis

leaf

Malignant transformation related pathway analysis

leaf

Cell-cell communication analysis

leaf

Single-cell gene regulatory network inference analysis

leaf

Somatic mutation of malignant transformation related genes

leaf

Related drugs of malignant transformation related genes

Gene: GLMP

Gene summary for GLMP

check button Gene summary.

Gene informationSpeciesHuman
Gene symbol

GLMP

Gene ID

112770

Gene nameglycosylated lysosomal membrane protein
Gene AliasC1orf85
Cytomap1q22
Gene Typeprotein-coding
GO ID

GO:0006139

UniProtAcc

A0A087WV34


Top

Malignant transformation analysis

check button Identification of the aberrant gene expression in precancerous and cancerous lesions by comparing the gene expression of stem-like cells in diseased tissues with normal stem cells
check button Malignant transformation involving gene list.
Entrez IDSymbolReplicatesSpeciesOrganTissueAdj P-valueLog2FCMalignancy
112770GLMPC30HumanOral cavityOSCC1.91e-361.42e+000.3055
112770GLMPC38HumanOral cavityOSCC1.05e-097.96e-010.172
112770GLMPC43HumanOral cavityOSCC4.07e-051.85e-010.1704
112770GLMPC46HumanOral cavityOSCC7.01e-072.44e-010.1673
112770GLMPC51HumanOral cavityOSCC4.20e-156.66e-010.2674
112770GLMPC57HumanOral cavityOSCC1.46e-042.95e-010.1679
112770GLMPC06HumanOral cavityOSCC2.11e-111.19e+000.2699
112770GLMPC07HumanOral cavityOSCC1.99e-061.18e+000.2491
112770GLMPC08HumanOral cavityOSCC6.01e-377.07e-010.1919
112770GLMPC09HumanOral cavityOSCC1.07e-062.87e-010.1431
112770GLMPLN38HumanOral cavityOSCC4.35e-029.05e-010.168
112770GLMPLP15HumanOral cavityLP1.10e-029.19e-010.2174
112770GLMPLP17HumanOral cavityLP8.16e-035.06e-010.2349
112770GLMPSYSMH1HumanOral cavityOSCC7.95e-041.09e-010.1127
112770GLMPSYSMH2HumanOral cavityOSCC1.72e-103.46e-010.2326
112770GLMPSYSMH3HumanOral cavityOSCC4.24e-204.51e-010.2442
112770GLMPSYSMH6HumanOral cavityOSCC1.57e-062.38e-010.1275
Page: 1 2 3 4 5 

check button Transcriptomic changes along malignancy continuum.
TissueExpression DynamicsAbbreviation
EsophagusThe image shows the transcriptomic changes along malignancy continuum.log2FC in expression of this searched gene in stem-like cells from each diseased tissue sample relative to stem-like cells in normal samples in each tissue plotted against the malignancy continuum. Samples are colored based on if they are from different disease stage.
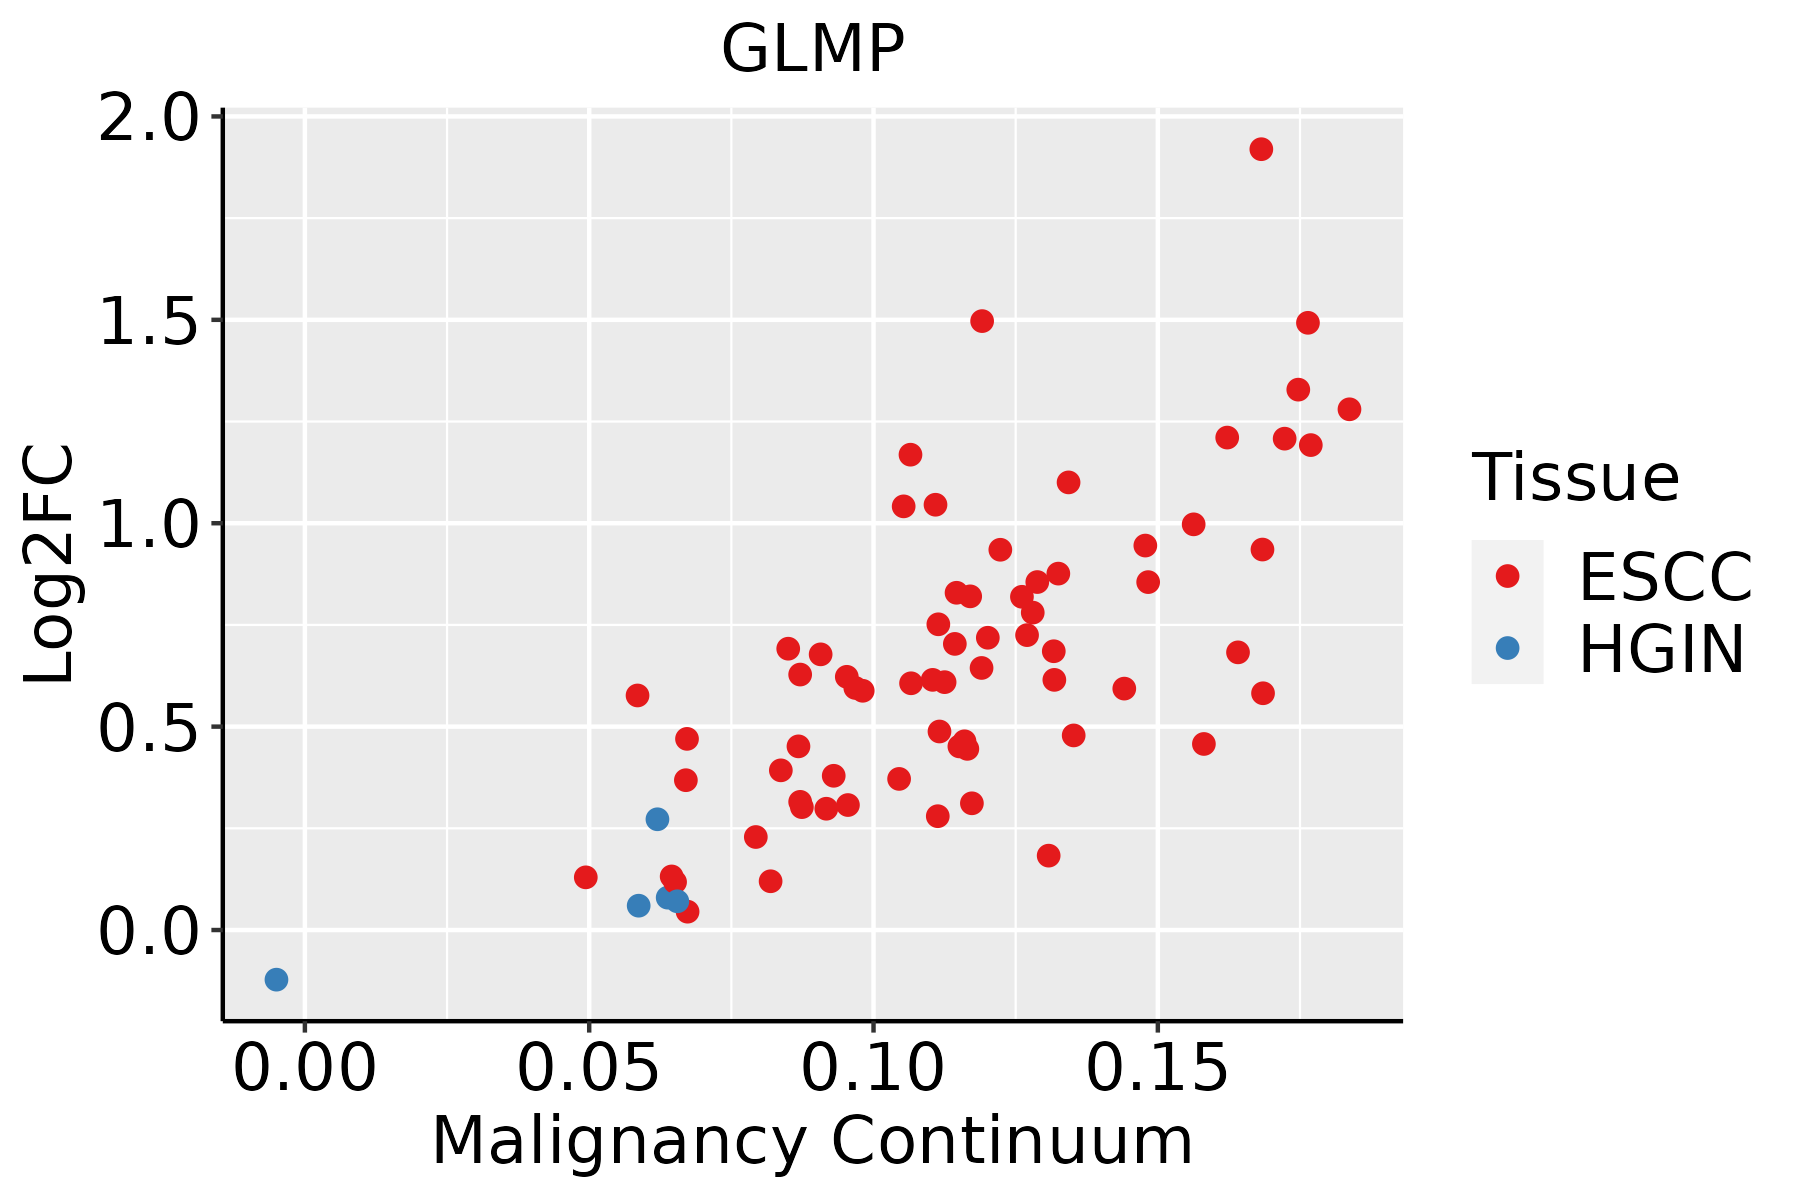
ESCC: Esophageal squamous cell carcinoma
HGIN: High-grade intraepithelial neoplasias
LGIN: Low-grade intraepithelial neoplasias
LiverThe image shows the transcriptomic changes along malignancy continuum.log2FC in expression of this searched gene in stem-like cells from each diseased tissue sample relative to stem-like cells in normal samples in each tissue plotted against the malignancy continuum. Samples are colored based on if they are from different disease stage.
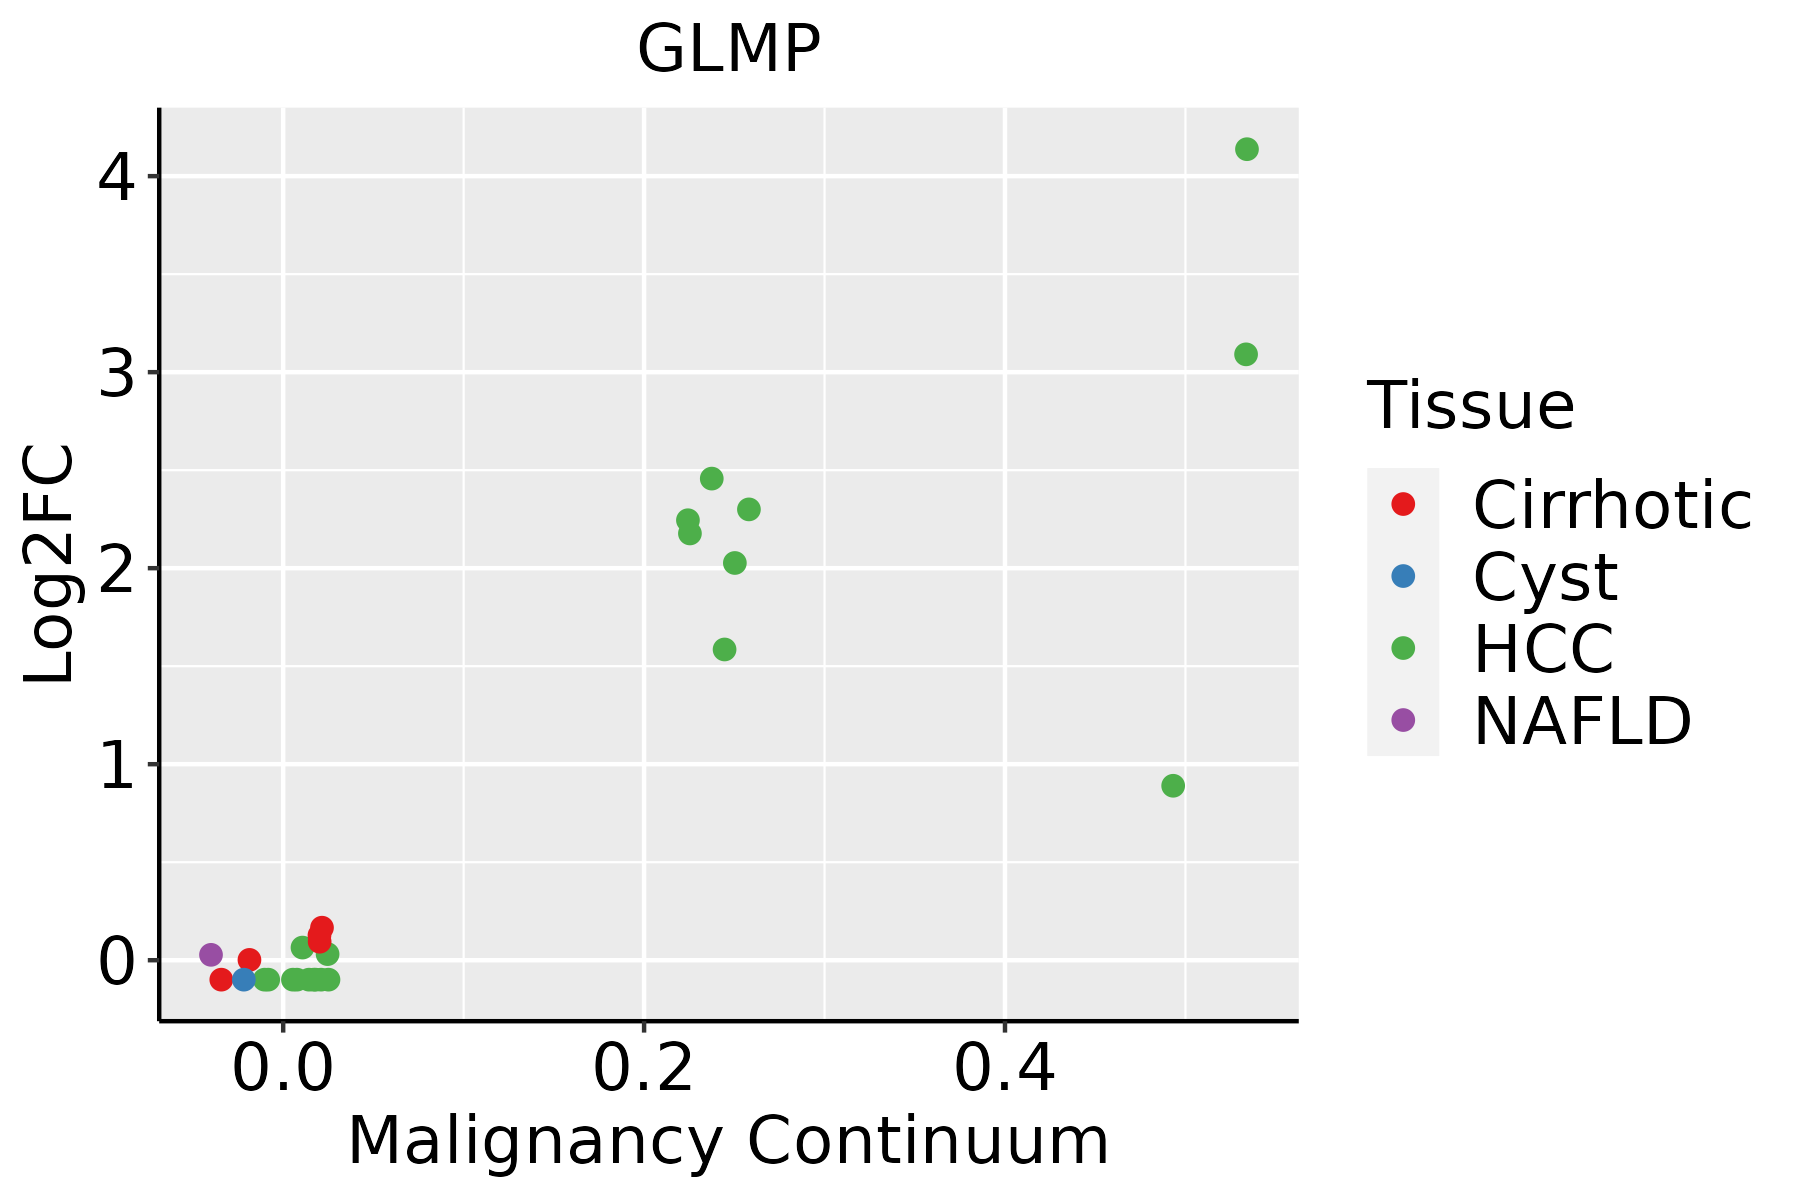
HCC: Hepatocellular carcinoma
NAFLD: Non-alcoholic fatty liver disease
Oral CavityThe image shows the transcriptomic changes along malignancy continuum.log2FC in expression of this searched gene in stem-like cells from each diseased tissue sample relative to stem-like cells in normal samples in each tissue plotted against the malignancy continuum. Samples are colored based on if they are from different disease stage.
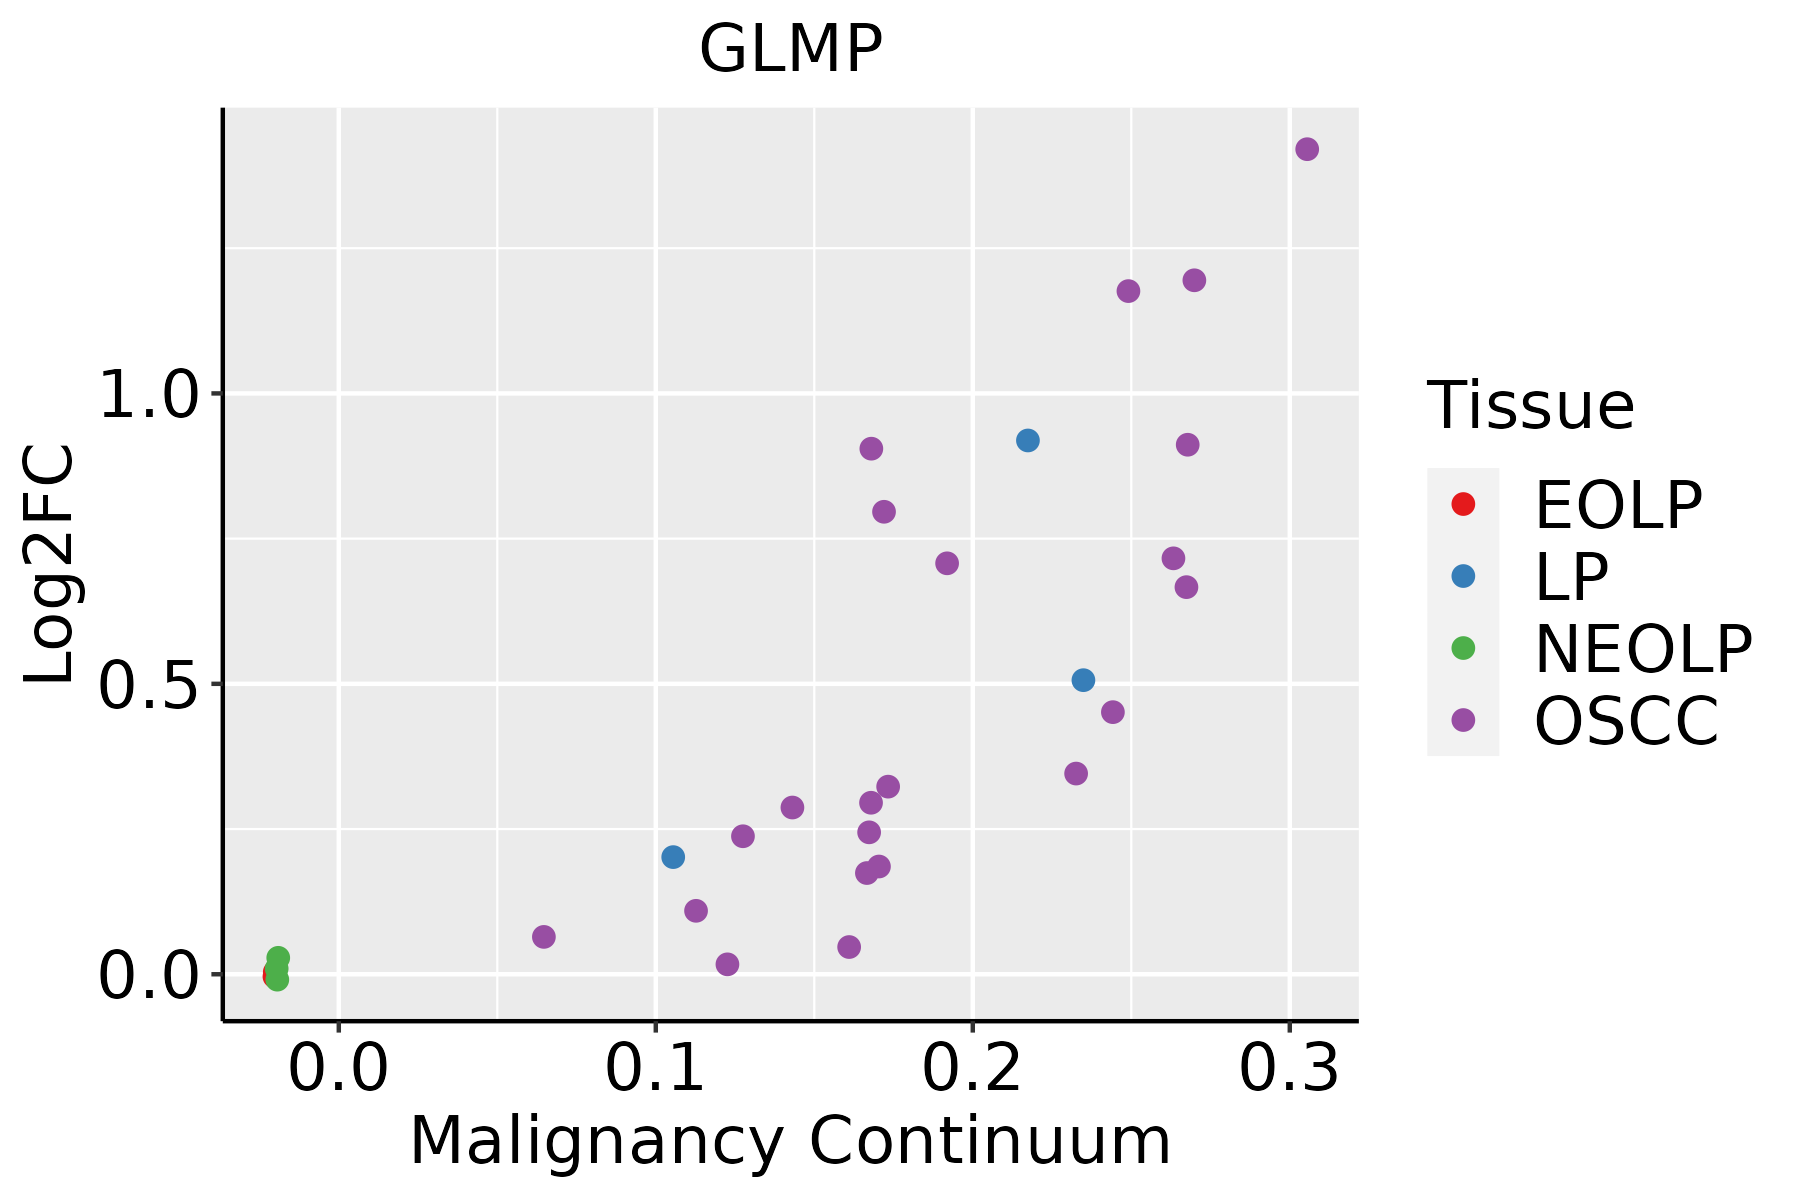
EOLP: Erosive Oral lichen planus
LP: leukoplakia
NEOLP: Non-erosive oral lichen planus
OSCC: Oral squamous cell carcinoma
ProstateThe image shows the transcriptomic changes along malignancy continuum.log2FC in expression of this searched gene in stem-like cells from each diseased tissue sample relative to stem-like cells in normal samples in each tissue plotted against the malignancy continuum. Samples are colored based on if they are from different disease stage.
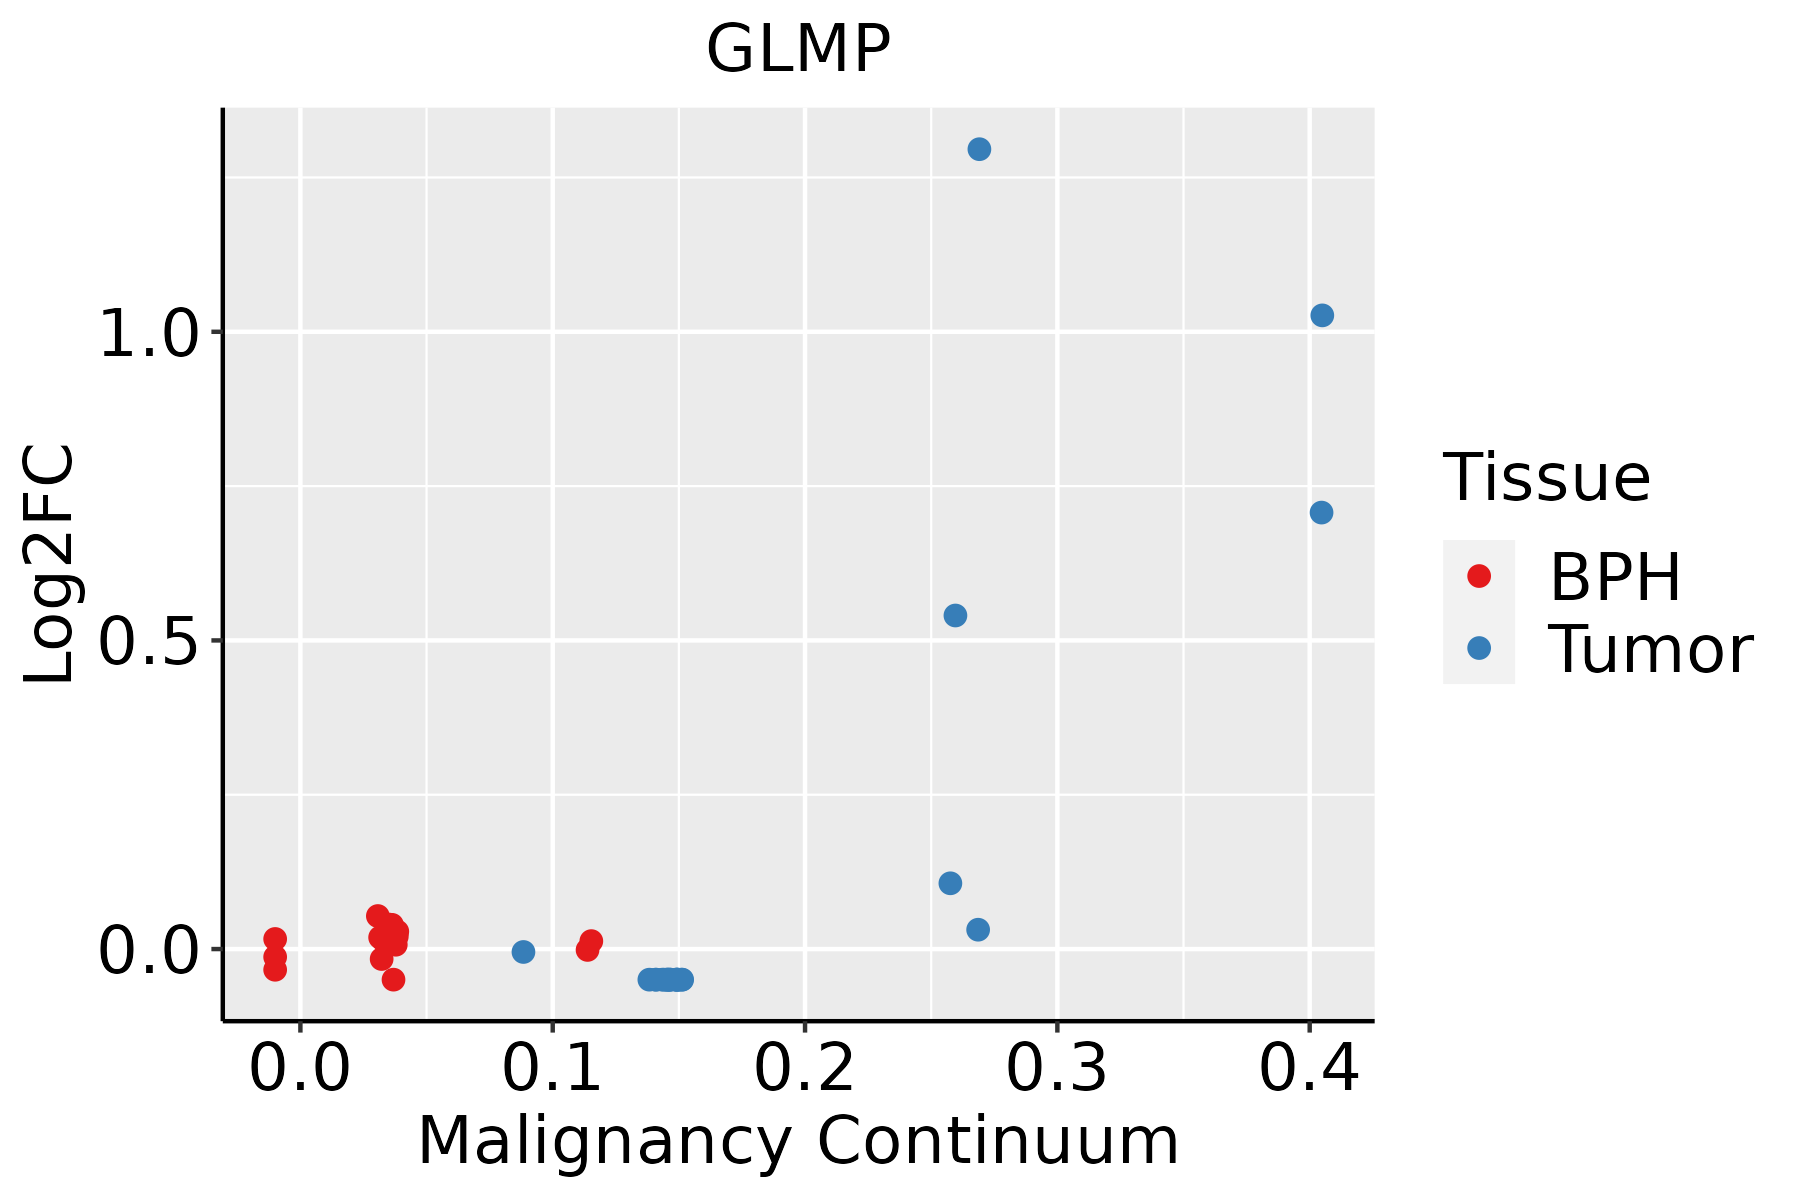
BPH: Benign Prostatic Hyperplasia
∗log2FC in expression of this searched gene in stem-like cells from each diseased tissue sample relative to stem-like cells in normal samples in each tissue plotted against the malignancy continuum. Samples are colored based on if they are from different disease stage.

Top

Malignant transformation related pathway analysis

check buttonFind out the enriched GO biological processes and KEGG pathways involved in transition from healthy to precancer to cancer
check button Figure of enriched GO biological processes.
TissueDisease StageEnriched GO biological Processes
ColorectumADGO analysis - Figure of enriched GO biological processes: Top 15 enriched GO BP terms are showed in the bar plot of each disease state in each tissue. Each row represents a significant GO biological process which is colored according to the -log10(p.adjust).
ColorectumSERGO analysis - Figure of enriched GO biological processes: Top 15 enriched GO BP terms are showed in the bar plot of each disease state in each tissue. Each row represents a significant GO biological process which is colored according to the -log10(p.adjust).
ColorectumMSSGO analysis - Figure of enriched GO biological processes: Top 15 enriched GO BP terms are showed in the bar plot of each disease state in each tissue. Each row represents a significant GO biological process which is colored according to the -log10(p.adjust).
ColorectumMSI-HGO analysis - Figure of enriched GO biological processes: Top 15 enriched GO BP terms are showed in the bar plot of each disease state in each tissue. Each row represents a significant GO biological process which is colored according to the -log10(p.adjust).
ColorectumFAPGO analysis - Figure of enriched GO biological processes: Top 15 enriched GO BP terms are showed in the bar plot of each disease state in each tissue. Each row represents a significant GO biological process which is colored according to the -log10(p.adjust).
∗Top 15 enriched GO BP terms are showed in the bar plot of each disease state in each tissue. Each row represents a significant GO biological process which is colored according to the -log10(p.adjust).
Page: 1 2 3 4 5 6 7 8 9 

check button Enriched GO biological processes.
GO IDTissueDisease StageDescriptionGene RatioBg Ratiopvaluep.adjustCount
GO:003164727EsophagusHGINregulation of protein stability96/2587298/187232.21e-165.76e-1496
GO:005082127EsophagusHGINprotein stabilization64/2587191/187233.11e-124.24e-1064
GO:0031647111EsophagusESCCregulation of protein stability223/8552298/187235.76e-251.52e-22223
GO:0050821111EsophagusESCCprotein stabilization140/8552191/187236.50e-153.61e-13140
GO:00726659EsophagusESCCprotein localization to vacuole52/855267/187239.14e-081.52e-0652
GO:00614626EsophagusESCCprotein localization to lysosome34/855246/187239.39e-056.70e-0434
GO:003164712LiverCirrhoticregulation of protein stability144/4634298/187236.74e-191.28e-16144
GO:005082112LiverCirrhoticprotein stabilization97/4634191/187236.67e-156.97e-1397
GO:007266511LiverCirrhoticprotein localization to vacuole37/463467/187239.11e-082.66e-0637
GO:00614622LiverCirrhoticprotein localization to lysosome24/463446/187235.75e-056.58e-0424
GO:003164722LiverHCCregulation of protein stability211/7958298/187232.29e-235.01e-21211
GO:005082122LiverHCCprotein stabilization139/7958191/187231.61e-171.71e-15139
GO:007266521LiverHCCprotein localization to vacuole48/795867/187231.27e-061.85e-0548
GO:00614621LiverHCCprotein localization to lysosome33/795846/187235.63e-055.26e-0433
GO:003164720Oral cavityOSCCregulation of protein stability193/7305298/187231.30e-191.95e-17193
GO:005082120Oral cavityOSCCprotein stabilization122/7305191/187232.69e-121.09e-10122
GO:00726658Oral cavityOSCCprotein localization to vacuole44/730567/187238.92e-069.44e-0544
GO:00614625Oral cavityOSCCprotein localization to lysosome28/730546/187232.19e-039.95e-0328
GO:0031647110Oral cavityLPregulation of protein stability132/4623298/187238.16e-147.99e-12132
GO:0050821110Oral cavityLPprotein stabilization88/4623191/187239.15e-115.51e-0988
Page: 1 2 

check button Enriched KEGG pathways.
Pathway IDTissueDisease StageDescriptionGene RatioBg Ratiopvaluep.adjustqvalueCount
Page: 1 

Top

Cell-cell communication analysis

check buttonIdentification of potential cell-cell interactions between two cell types and their ligand-receptor pairs for different disease states
LigandReceptorLRpairPathwayTissueDisease Stage
Page: 1 

Top

Single-cell gene regulatory network inference analysis

check buttonFind out the significant the regulons (TFs) and the target genes of each regulon across cell types for different disease states
TFCell TypeTissueDisease StageTarget GeneRSSRegulon Activity
∗The dot plots of a searched regulon are shown for all cell subpopulations in each disease state of each tissue based on the regulon specific score inferred using pySCENIC and by calculating the average expression.
Page: 1 

Top

Somatic mutation of malignant transformation related genes

check buttonAnnotation of somatic variants for genes involved in malignant transformation
Hugo SymbolVariant ClassVariant ClassificationdbSNP RSHGVScHGVSpHGVSp ShortSWISSPROTBIOTYPESIFTPolyPhenTumor Sample BarcodeTissueHistologySexAgeStageTherapy TypesDrugsOutcome
GLMPSNVMissense_Mutationc.856N>Ap.Ala286Thrp.A286TQ8WWB7protein_codingdeleterious(0)probably_damaging(0.974)TCGA-A7-A26I-01Breastbreast invasive carcinomaFemale>=65I/IIChemotherapycytoxanSD
GLMPSNVMissense_Mutationc.1009G>Ap.Gly337Argp.G337RQ8WWB7protein_codingdeleterious(0)probably_damaging(1)TCGA-A8-A07O-01Breastbreast invasive carcinomaFemale<65I/IIChemotherapyCR
GLMPSNVMissense_Mutationc.1191N>Tp.Lys397Asnp.K397NQ8WWB7protein_codingdeleterious(0.04)benign(0.429)TCGA-AN-A0XW-01Breastbreast invasive carcinomaFemale<65III/IVUnknownUnknownSD
GLMPinsertionIn_Frame_Insnovelc.863_864insTATGTTp.Ser288_Gln289insMetPhep.S288_Q289insMFQ8WWB7protein_codingTCGA-AO-A03T-01Breastbreast invasive carcinomaFemale<65I/IIChemotherapycyclophosphamideSD
GLMPinsertionFrame_Shift_Insnovelc.862_863insTTTCGATTTATTTTTATTTTTTTAGAGACATGGTCTTGp.Ser288PhefsTer35p.S288Ffs*35Q8WWB7protein_codingTCGA-AO-A03T-01Breastbreast invasive carcinomaFemale<65I/IIChemotherapycyclophosphamideSD
GLMPinsertionNonsense_Mutationnovelc.741_742insACCACAAGAAGTACTCAGAGTACCAGTCCATAAATTAAGGp.Pro248ThrfsTer11p.P248Tfs*11Q8WWB7protein_codingTCGA-BH-A0B1-01Breastbreast invasive carcinomaFemale>=65I/IIChemotherapyadriamycinSD
GLMPSNVMissense_Mutationc.830N>Tp.Ser277Leup.S277LQ8WWB7protein_codingtolerated(0.26)benign(0.003)TCGA-IR-A3LA-01Cervixcervical & endocervical cancerFemale<65I/IIChemotherapycisplatinCR
GLMPSNVMissense_Mutationrs749570618c.1058C>Tp.Ser353Leup.S353LQ8WWB7protein_codingdeleterious(0)probably_damaging(0.947)TCGA-AZ-4315-01Colorectumcolon adenocarcinomaMale<65I/IIUnknownUnknownSD
GLMPSNVMissense_Mutationnovelc.1045N>Gp.Tyr349Aspp.Y349DQ8WWB7protein_codingdeleterious(0)probably_damaging(0.976)TCGA-CA-6717-01Colorectumcolon adenocarcinomaMale<65I/IIChemotherapyoxaliplatinCR
GLMPSNVMissense_Mutationc.119N>Gp.Gln40Argp.Q40RQ8WWB7protein_codingtolerated(0.1)benign(0.013)TCGA-G4-6588-01Colorectumcolon adenocarcinomaFemale<65I/IIUnknownUnknownSD
Page: 1 2 3 4 5 

Top

Related drugs of malignant transformation related genes

check buttonIdentification of chemicals and drugs interact with genes involved in malignant transfromation
(DGIdb 4.0)
Entrez IDSymbolCategoryInteraction TypesDrug Claim NameDrug NamePMIDs
Page: 1