
|
|||||
|
 | |
| |
| |
| |
| |
| |
|
Gene: GFM1 |
Gene summary for GFM1 |
| Gene information | Species | Human | Gene symbol | GFM1 | Gene ID | 85476 |
| Gene name | G elongation factor mitochondrial 1 | |
| Gene Alias | COXPD1 | |
| Cytomap | 3q25.32 | |
| Gene Type | protein-coding | GO ID | GO:0006412 | UniProtAcc | Q96RP9 |
Top |
Malignant transformation analysis |
| Identification of the aberrant gene expression in precancerous and cancerous lesions by comparing the gene expression of stem-like cells in diseased tissues with normal stem cells |
| Entrez ID | Symbol | Replicates | Species | Organ | Tissue | Adj P-value | Log2FC | Malignancy |
| 85476 | GFM1 | C46 | Human | Oral cavity | OSCC | 2.17e-15 | 3.62e-01 | 0.1673 |
| 85476 | GFM1 | C51 | Human | Oral cavity | OSCC | 1.35e-15 | 7.33e-01 | 0.2674 |
| 85476 | GFM1 | C57 | Human | Oral cavity | OSCC | 2.59e-11 | 4.90e-01 | 0.1679 |
| 85476 | GFM1 | C06 | Human | Oral cavity | OSCC | 3.94e-07 | 1.07e+00 | 0.2699 |
| 85476 | GFM1 | C08 | Human | Oral cavity | OSCC | 1.25e-31 | 7.70e-01 | 0.1919 |
| 85476 | GFM1 | LN22 | Human | Oral cavity | OSCC | 6.85e-03 | 7.22e-01 | 0.1733 |
| 85476 | GFM1 | LN46 | Human | Oral cavity | OSCC | 7.20e-03 | 2.55e-01 | 0.1666 |
| 85476 | GFM1 | LP15 | Human | Oral cavity | LP | 5.61e-06 | 8.44e-01 | 0.2174 |
| 85476 | GFM1 | LP17 | Human | Oral cavity | LP | 1.75e-04 | 4.67e-01 | 0.2349 |
| 85476 | GFM1 | SYSMH1 | Human | Oral cavity | OSCC | 7.23e-22 | 4.80e-01 | 0.1127 |
| 85476 | GFM1 | SYSMH2 | Human | Oral cavity | OSCC | 8.59e-06 | 3.33e-01 | 0.2326 |
| 85476 | GFM1 | SYSMH3 | Human | Oral cavity | OSCC | 2.33e-13 | 4.89e-01 | 0.2442 |
| 85476 | GFM1 | SYSMH5 | Human | Oral cavity | OSCC | 2.00e-03 | 1.99e-01 | 0.0647 |
| 85476 | GFM1 | SYSMH6 | Human | Oral cavity | OSCC | 4.86e-02 | 1.92e-01 | 0.1275 |
| 85476 | GFM1 | P4_S8_cSCC | Human | Skin | cSCC | 3.44e-02 | 9.15e-02 | -0.3095 |
| 85476 | GFM1 | P1_cSCC | Human | Skin | cSCC | 3.54e-04 | 3.70e-01 | 0.0292 |
| 85476 | GFM1 | P2_cSCC | Human | Skin | cSCC | 7.91e-07 | 3.08e-01 | -0.024 |
| 85476 | GFM1 | P4_cSCC | Human | Skin | cSCC | 9.21e-09 | 3.25e-01 | -0.00290000000000005 |
| 85476 | GFM1 | P10_cSCC | Human | Skin | cSCC | 1.46e-24 | 7.29e-01 | 0.1017 |
| Page: 1 2 3 4 5 |
| Tissue | Expression Dynamics | Abbreviation |
| Esophagus |  | ESCC: Esophageal squamous cell carcinoma |
| HGIN: High-grade intraepithelial neoplasias | ||
| LGIN: Low-grade intraepithelial neoplasias | ||
| Liver | 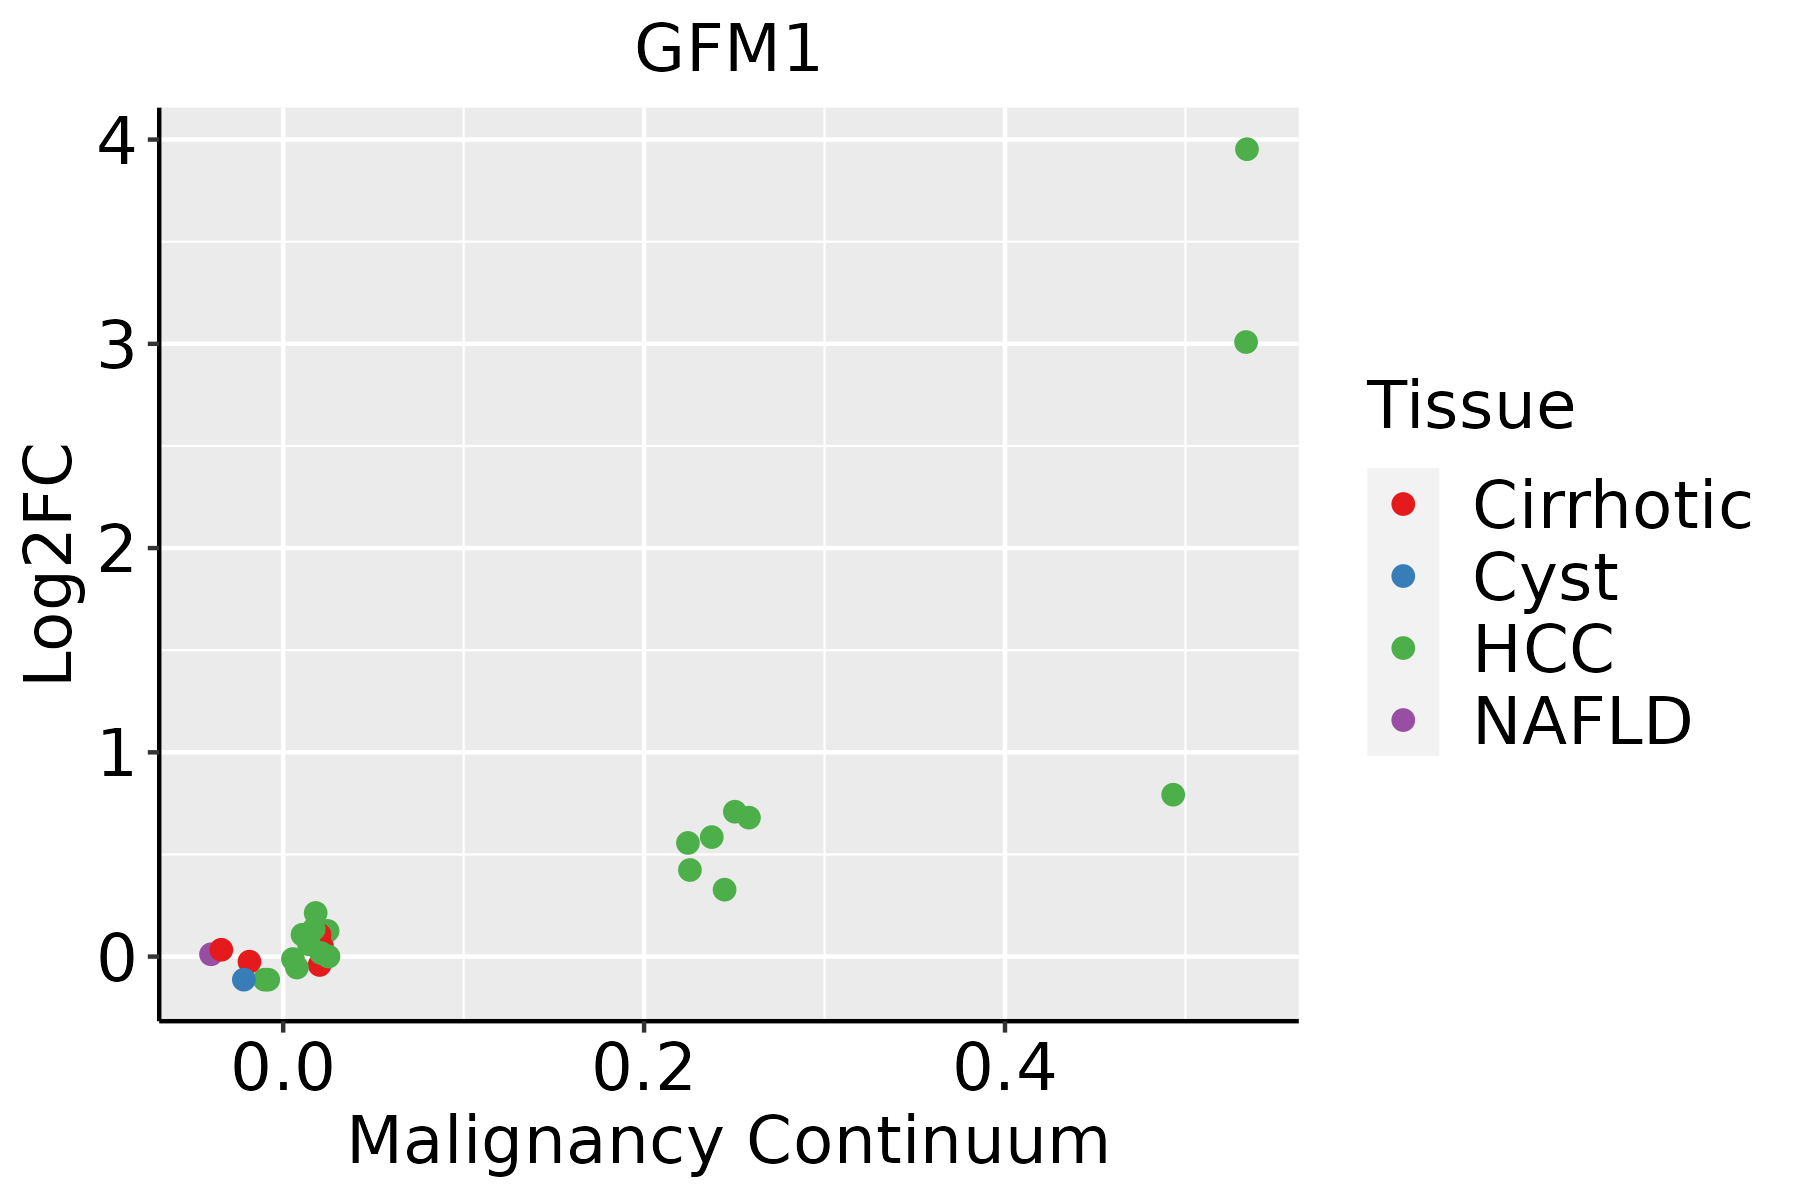 | HCC: Hepatocellular carcinoma |
| NAFLD: Non-alcoholic fatty liver disease | ||
| Oral Cavity | 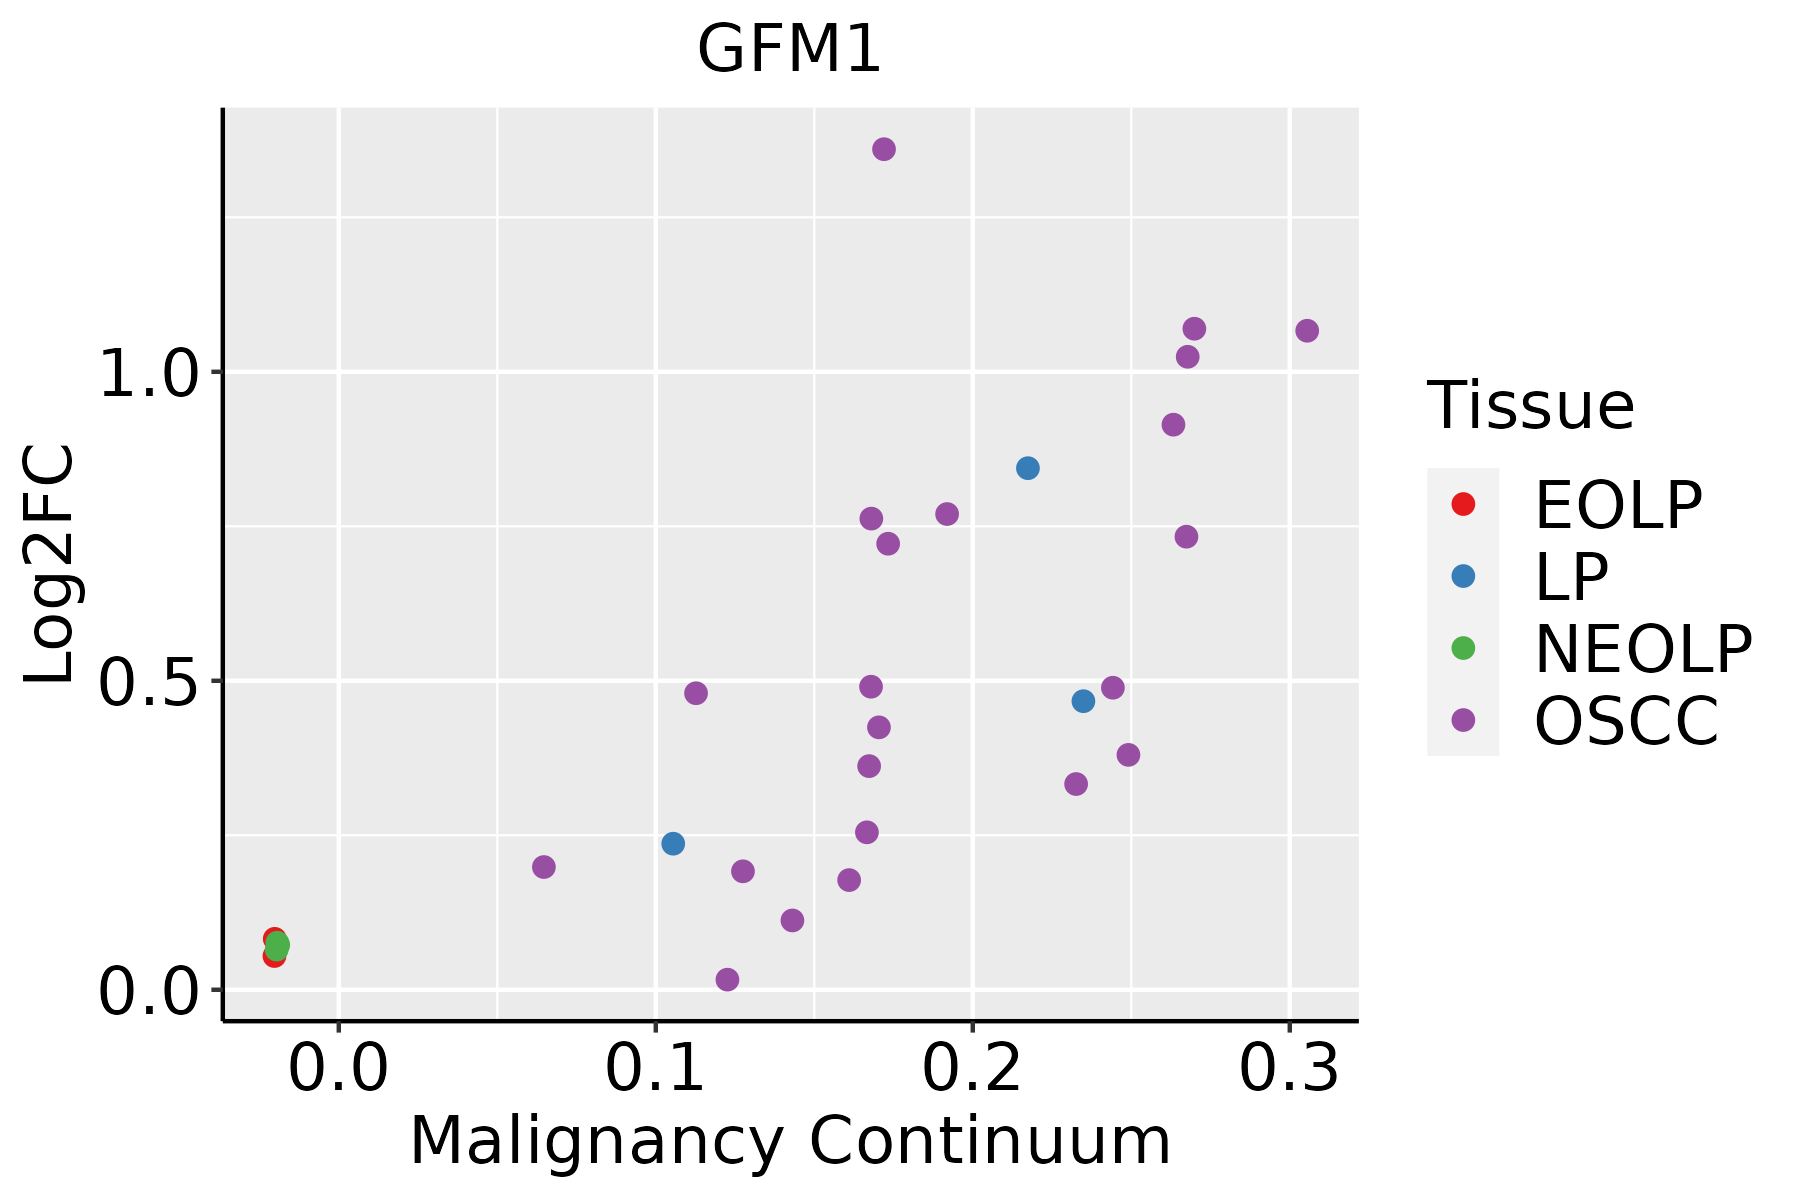 | EOLP: Erosive Oral lichen planus |
| LP: leukoplakia | ||
| NEOLP: Non-erosive oral lichen planus | ||
| OSCC: Oral squamous cell carcinoma | ||
| Skin |  | AK: Actinic keratosis |
| cSCC: Cutaneous squamous cell carcinoma | ||
| SCCIS:squamous cell carcinoma in situ |
| ∗log2FC in expression of this searched gene in stem-like cells from each diseased tissue sample relative to stem-like cells in normal samples in each tissue plotted against the malignancy continuum. Samples are colored based on if they are from different disease stage. |
Top |
Malignant transformation related pathway analysis |
| Find out the enriched GO biological processes and KEGG pathways involved in transition from healthy to precancer to cancer |
| Tissue | Disease Stage | Enriched GO biological Processes |
| Colorectum | AD |  |
| Colorectum | SER |  |
| Colorectum | MSS |  |
| Colorectum | MSI-H |  |
| Colorectum | FAP |  |
| ∗Top 15 enriched GO BP terms are showed in the bar plot of each disease state in each tissue. Each row represents a significant GO biological process which is colored according to the -log10(p.adjust). |
| Page: 1 2 3 4 5 6 7 8 9 |
| GO ID | Tissue | Disease Stage | Description | Gene Ratio | Bg Ratio | pvalue | p.adjust | Count |
| GO:014005313 | Esophagus | ESCC | mitochondrial gene expression | 93/8552 | 108/18723 | 1.96e-18 | 2.03e-16 | 93 |
| GO:003254314 | Esophagus | ESCC | mitochondrial translation | 68/8552 | 76/18723 | 1.02e-15 | 6.86e-14 | 68 |
| GO:000641419 | Esophagus | ESCC | translational elongation | 41/8552 | 55/18723 | 1.26e-05 | 1.16e-04 | 41 |
| GO:0032543 | Liver | Cirrhotic | mitochondrial translation | 40/4634 | 76/18723 | 1.61e-07 | 4.29e-06 | 40 |
| GO:0140053 | Liver | Cirrhotic | mitochondrial gene expression | 49/4634 | 108/18723 | 2.35e-06 | 4.31e-05 | 49 |
| GO:01400531 | Liver | HCC | mitochondrial gene expression | 82/7958 | 108/18723 | 1.49e-12 | 7.20e-11 | 82 |
| GO:00325431 | Liver | HCC | mitochondrial translation | 62/7958 | 76/18723 | 2.95e-12 | 1.34e-10 | 62 |
| GO:000641412 | Liver | HCC | translational elongation | 36/7958 | 55/18723 | 4.94e-04 | 3.23e-03 | 36 |
| GO:01400533 | Oral cavity | OSCC | mitochondrial gene expression | 78/7305 | 108/18723 | 2.37e-12 | 9.86e-11 | 78 |
| GO:00325434 | Oral cavity | OSCC | mitochondrial translation | 59/7305 | 76/18723 | 7.21e-12 | 2.70e-10 | 59 |
| GO:000641416 | Oral cavity | OSCC | translational elongation | 37/7305 | 55/18723 | 2.03e-05 | 1.94e-04 | 37 |
| GO:003254313 | Oral cavity | LP | mitochondrial translation | 43/4623 | 76/18723 | 2.85e-09 | 1.26e-07 | 43 |
| GO:014005312 | Oral cavity | LP | mitochondrial gene expression | 53/4623 | 108/18723 | 3.54e-08 | 1.27e-06 | 53 |
| GO:000641417 | Oral cavity | LP | translational elongation | 25/4623 | 55/18723 | 6.27e-04 | 5.71e-03 | 25 |
| GO:00325436 | Skin | cSCC | mitochondrial translation | 47/4864 | 76/18723 | 4.70e-11 | 2.22e-09 | 47 |
| GO:01400535 | Skin | cSCC | mitochondrial gene expression | 56/4864 | 108/18723 | 8.06e-09 | 2.56e-07 | 56 |
| GO:000641423 | Skin | cSCC | translational elongation | 30/4864 | 55/18723 | 6.13e-06 | 8.70e-05 | 30 |
| Page: 1 |
| Pathway ID | Tissue | Disease Stage | Description | Gene Ratio | Bg Ratio | pvalue | p.adjust | qvalue | Count |
| Page: 1 |
Top |
Cell-cell communication analysis |
| Identification of potential cell-cell interactions between two cell types and their ligand-receptor pairs for different disease states |
| Ligand | Receptor | LRpair | Pathway | Tissue | Disease Stage |
| Page: 1 |
Top |
Single-cell gene regulatory network inference analysis |
| Find out the significant the regulons (TFs) and the target genes of each regulon across cell types for different disease states |
| TF | Cell Type | Tissue | Disease Stage | Target Gene | RSS | Regulon Activity |
| ∗The dot plots of a searched regulon are shown for all cell subpopulations in each disease state of each tissue based on the regulon specific score inferred using pySCENIC and by calculating the average expression. |
| Page: 1 |
Top |
Somatic mutation of malignant transformation related genes |
| Annotation of somatic variants for genes involved in malignant transformation |
| Hugo Symbol | Variant Class | Variant Classification | dbSNP RS | HGVSc | HGVSp | HGVSp Short | SWISSPROT | BIOTYPE | SIFT | PolyPhen | Tumor Sample Barcode | Tissue | Histology | Sex | Age | Stage | Therapy Types | Drugs | Outcome |
| GFM1 | SNV | Missense_Mutation | c.889G>T | p.Asp297Tyr | p.D297Y | Q96RP9 | protein_coding | deleterious(0.01) | probably_damaging(0.976) | TCGA-A8-A09W-01 | Breast | breast invasive carcinoma | Female | >=65 | III/IV | Unknown | Unknown | SD | |
| GFM1 | SNV | Missense_Mutation | c.1816N>C | p.Glu606Gln | p.E606Q | Q96RP9 | protein_coding | deleterious(0.04) | possibly_damaging(0.461) | TCGA-AC-A23H-01 | Breast | breast invasive carcinoma | Female | >=65 | I/II | Unknown | Unknown | PD | |
| GFM1 | SNV | Missense_Mutation | c.1184N>A | p.Gly395Glu | p.G395E | Q96RP9 | protein_coding | deleterious(0) | probably_damaging(1) | TCGA-AO-A12D-01 | Breast | breast invasive carcinoma | Female | <65 | I/II | Chemotherapy | cyclophosphamide | SD | |
| GFM1 | SNV | Missense_Mutation | novel | c.1061C>T | p.Ser354Leu | p.S354L | Q96RP9 | protein_coding | deleterious(0.03) | benign(0.073) | TCGA-D8-A73U-01 | Breast | breast invasive carcinoma | Female | >=65 | I/II | Hormone Therapy | tamoxiphen | SD |
| GFM1 | SNV | Missense_Mutation | novel | c.401C>T | p.Ala134Val | p.A134V | Q96RP9 | protein_coding | deleterious(0) | possibly_damaging(0.875) | TCGA-OL-A66K-01 | Breast | breast invasive carcinoma | Female | >=65 | I/II | Unknown | Unknown | SD |
| GFM1 | SNV | Missense_Mutation | rs140490191 | c.1148G>A | p.Arg383Gln | p.R383Q | Q96RP9 | protein_coding | tolerated(0.22) | possibly_damaging(0.884) | TCGA-2W-A8YY-01 | Cervix | cervical & endocervical cancer | Female | <65 | I/II | Chemotherapy | cisplatin | CR |
| GFM1 | SNV | Missense_Mutation | rs191462023 | c.622N>A | p.Glu208Lys | p.E208K | Q96RP9 | protein_coding | deleterious(0) | probably_damaging(0.975) | TCGA-C5-A2LZ-01 | Cervix | cervical & endocervical cancer | Female | >=65 | III/IV | Unknown | Unknown | PD |
| GFM1 | SNV | Missense_Mutation | novel | c.1766N>T | p.Ser589Leu | p.S589L | Q96RP9 | protein_coding | tolerated(0.29) | benign(0.003) | TCGA-C5-A2M1-01 | Cervix | cervical & endocervical cancer | Female | <65 | I/II | Unknown | Unknown | SD |
| GFM1 | SNV | Missense_Mutation | novel | c.166N>C | p.Asp56His | p.D56H | Q96RP9 | protein_coding | deleterious(0) | probably_damaging(1) | TCGA-VS-A8EI-01 | Cervix | cervical & endocervical cancer | Female | <65 | I/II | Chemotherapy | cisplatin | CR |
| GFM1 | SNV | Missense_Mutation | c.1946N>A | p.Gly649Glu | p.G649E | Q96RP9 | protein_coding | deleterious(0) | possibly_damaging(0.674) | TCGA-A6-2682-01 | Colorectum | colon adenocarcinoma | Male | >=65 | III/IV | Chemotherapy | 5 | PD |
| Page: 1 2 3 4 5 6 7 8 |
Top |
Related drugs of malignant transformation related genes |
| Identification of chemicals and drugs interact with genes involved in malignant transfromation |
| (DGIdb 4.0) |
| Entrez ID | Symbol | Category | Interaction Types | Drug Claim Name | Drug Name | PMIDs |
| Page: 1 |

Copyright 2023-Present -The University of Texas Health Science Center at Houston |