Schematic overview of the cellular and molecular mechanisms involved in the cancer progression, including the proposed cellular and molecular mechanisms in cancer cells trajectory. AT1: alveolar type 1 cells; AT2: alveolar type 2 cells; AAH: atypical adenomatous hyperplasia; AIS: adenocarcinoma in situ; MIA: minimally invasive adenocarcinoma; IA: invasive adenocarcinoma; EMT: epithelial-mesenchymal transition

Home

Download

Statistics

Help

Contact

Center for Computational Systems Medicine
leaf

Gene summary

leaf

Malignant transformation analysis

leaf

Malignant transformation related pathway analysis

leaf

Cell-cell communication analysis

leaf

Single-cell gene regulatory network inference analysis

leaf

Somatic mutation of malignant transformation related genes

leaf

Related drugs of malignant transformation related genes

Gene: FUNDC2

Gene summary for FUNDC2

check button Gene summary.

Gene informationSpeciesHuman
Gene symbol

FUNDC2

Gene ID

65991

Gene nameFUN14 domain containing 2
Gene AliasDC44
CytomapXq28
Gene Typeprotein-coding
GO ID

GO:0000422

UniProtAcc

Q9BWH2


Top

Malignant transformation analysis

check button Identification of the aberrant gene expression in precancerous and cancerous lesions by comparing the gene expression of stem-like cells in diseased tissues with normal stem cells
check button Malignant transformation involving gene list.
Entrez IDSymbolReplicatesSpeciesOrganTissueAdj P-valueLog2FCMalignancy
65991FUNDC2C04HumanOral cavityOSCC1.31e-281.94e+000.2633
65991FUNDC2C21HumanOral cavityOSCC1.50e-592.27e+000.2678
65991FUNDC2C30HumanOral cavityOSCC4.57e-402.10e+000.3055
65991FUNDC2C38HumanOral cavityOSCC4.75e-071.09e+000.172
65991FUNDC2C43HumanOral cavityOSCC1.38e-491.07e+000.1704
65991FUNDC2C46HumanOral cavityOSCC2.21e-186.56e-010.1673
65991FUNDC2C51HumanOral cavityOSCC4.11e-171.22e+000.2674
65991FUNDC2C57HumanOral cavityOSCC5.27e-055.14e-010.1679
65991FUNDC2C06HumanOral cavityOSCC8.25e-131.85e+000.2699
65991FUNDC2C07HumanOral cavityOSCC3.81e-061.73e+000.2491
65991FUNDC2C08HumanOral cavityOSCC1.18e-451.05e+000.1919
65991FUNDC2C09HumanOral cavityOSCC5.20e-083.53e-010.1431
65991FUNDC2LN22HumanOral cavityOSCC4.05e-069.63e-010.1733
65991FUNDC2LN38HumanOral cavityOSCC8.76e-051.08e+000.168
65991FUNDC2LN46HumanOral cavityOSCC3.97e-035.34e-010.1666
65991FUNDC2LP15HumanOral cavityLP1.88e-029.73e-010.2174
65991FUNDC2LP17HumanOral cavityLP3.92e-069.87e-010.2349
65991FUNDC2SYSMH1HumanOral cavityOSCC2.51e-092.91e-010.1127
65991FUNDC2SYSMH2HumanOral cavityOSCC1.95e-095.16e-010.2326
65991FUNDC2SYSMH3HumanOral cavityOSCC4.35e-197.89e-010.2442
Page: 1 2 3 4 5 6 7 

check button Transcriptomic changes along malignancy continuum.
TissueExpression DynamicsAbbreviation
EsophagusThe image shows the transcriptomic changes along malignancy continuum.log2FC in expression of this searched gene in stem-like cells from each diseased tissue sample relative to stem-like cells in normal samples in each tissue plotted against the malignancy continuum. Samples are colored based on if they are from different disease stage.
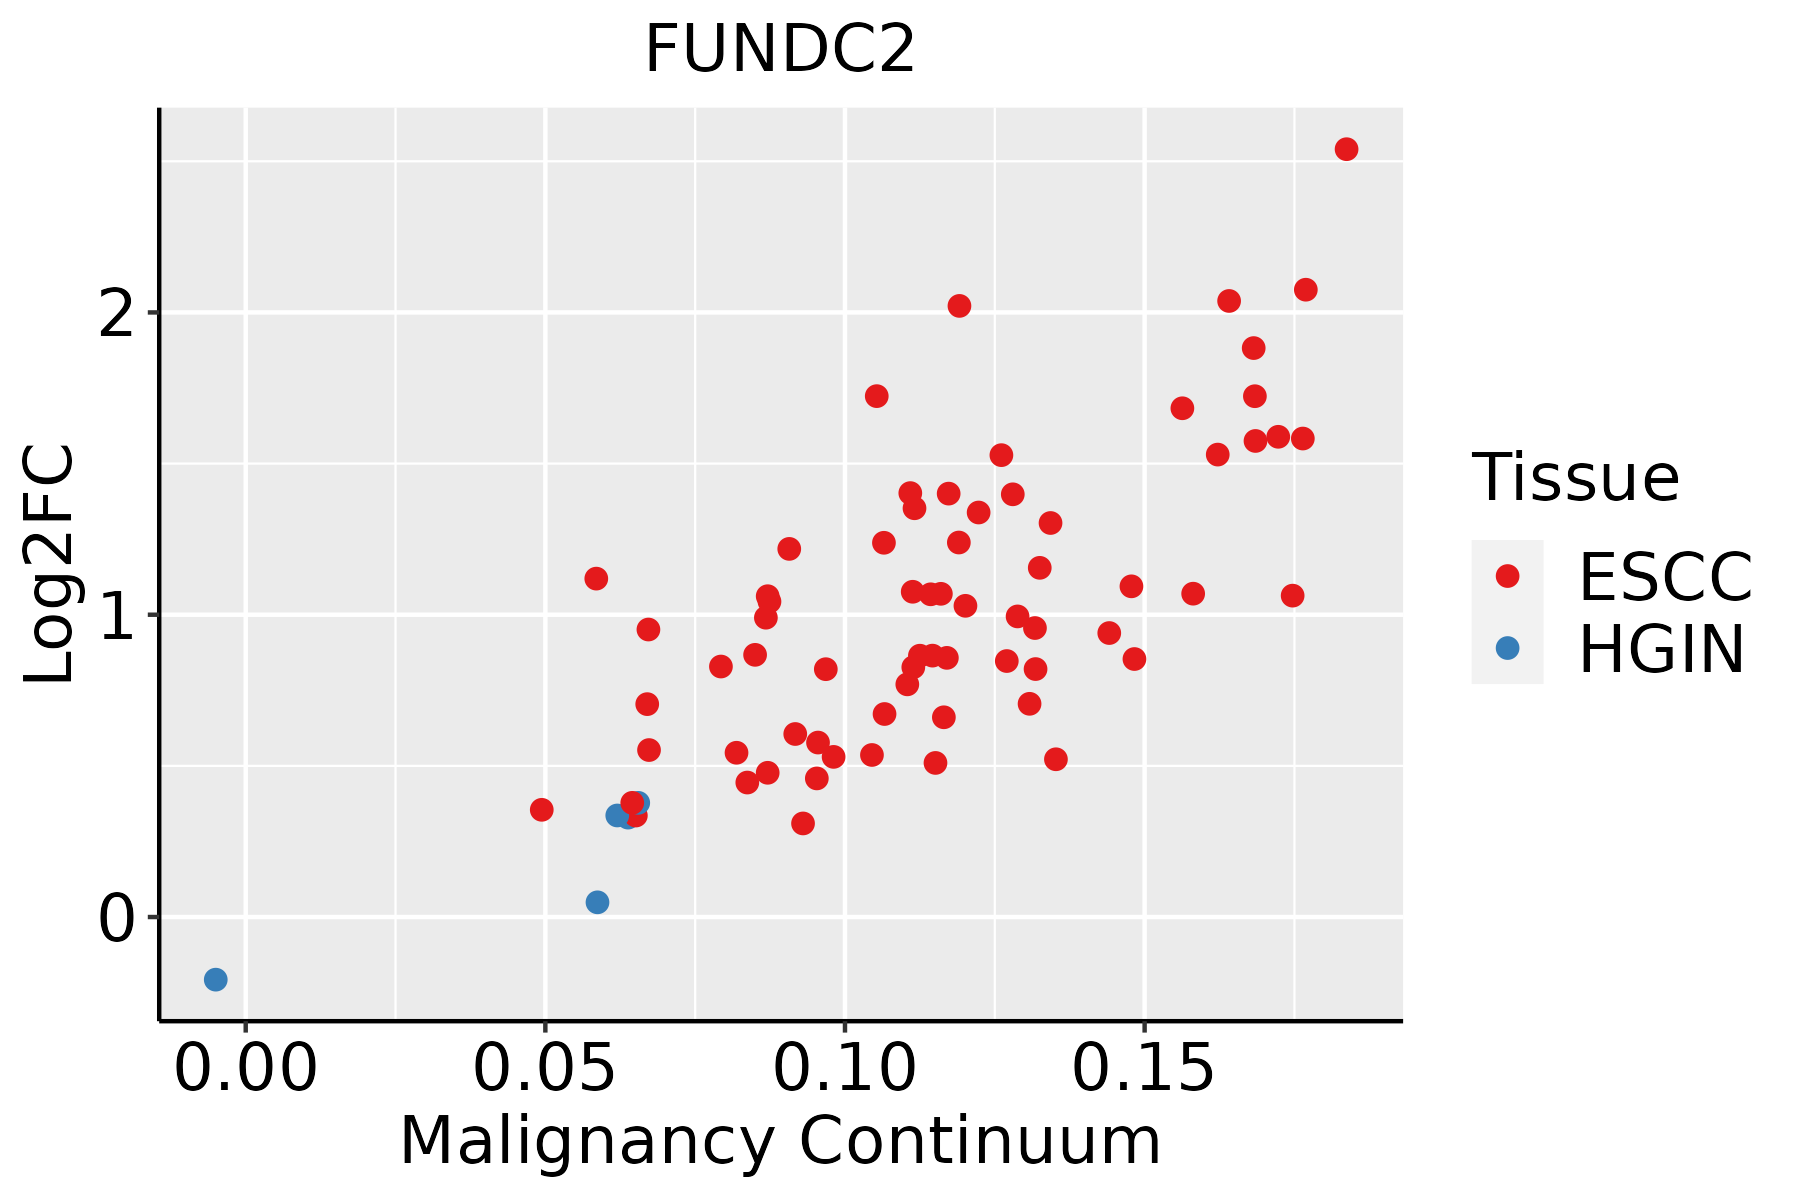
ESCC: Esophageal squamous cell carcinoma
HGIN: High-grade intraepithelial neoplasias
LGIN: Low-grade intraepithelial neoplasias
LiverThe image shows the transcriptomic changes along malignancy continuum.log2FC in expression of this searched gene in stem-like cells from each diseased tissue sample relative to stem-like cells in normal samples in each tissue plotted against the malignancy continuum. Samples are colored based on if they are from different disease stage.
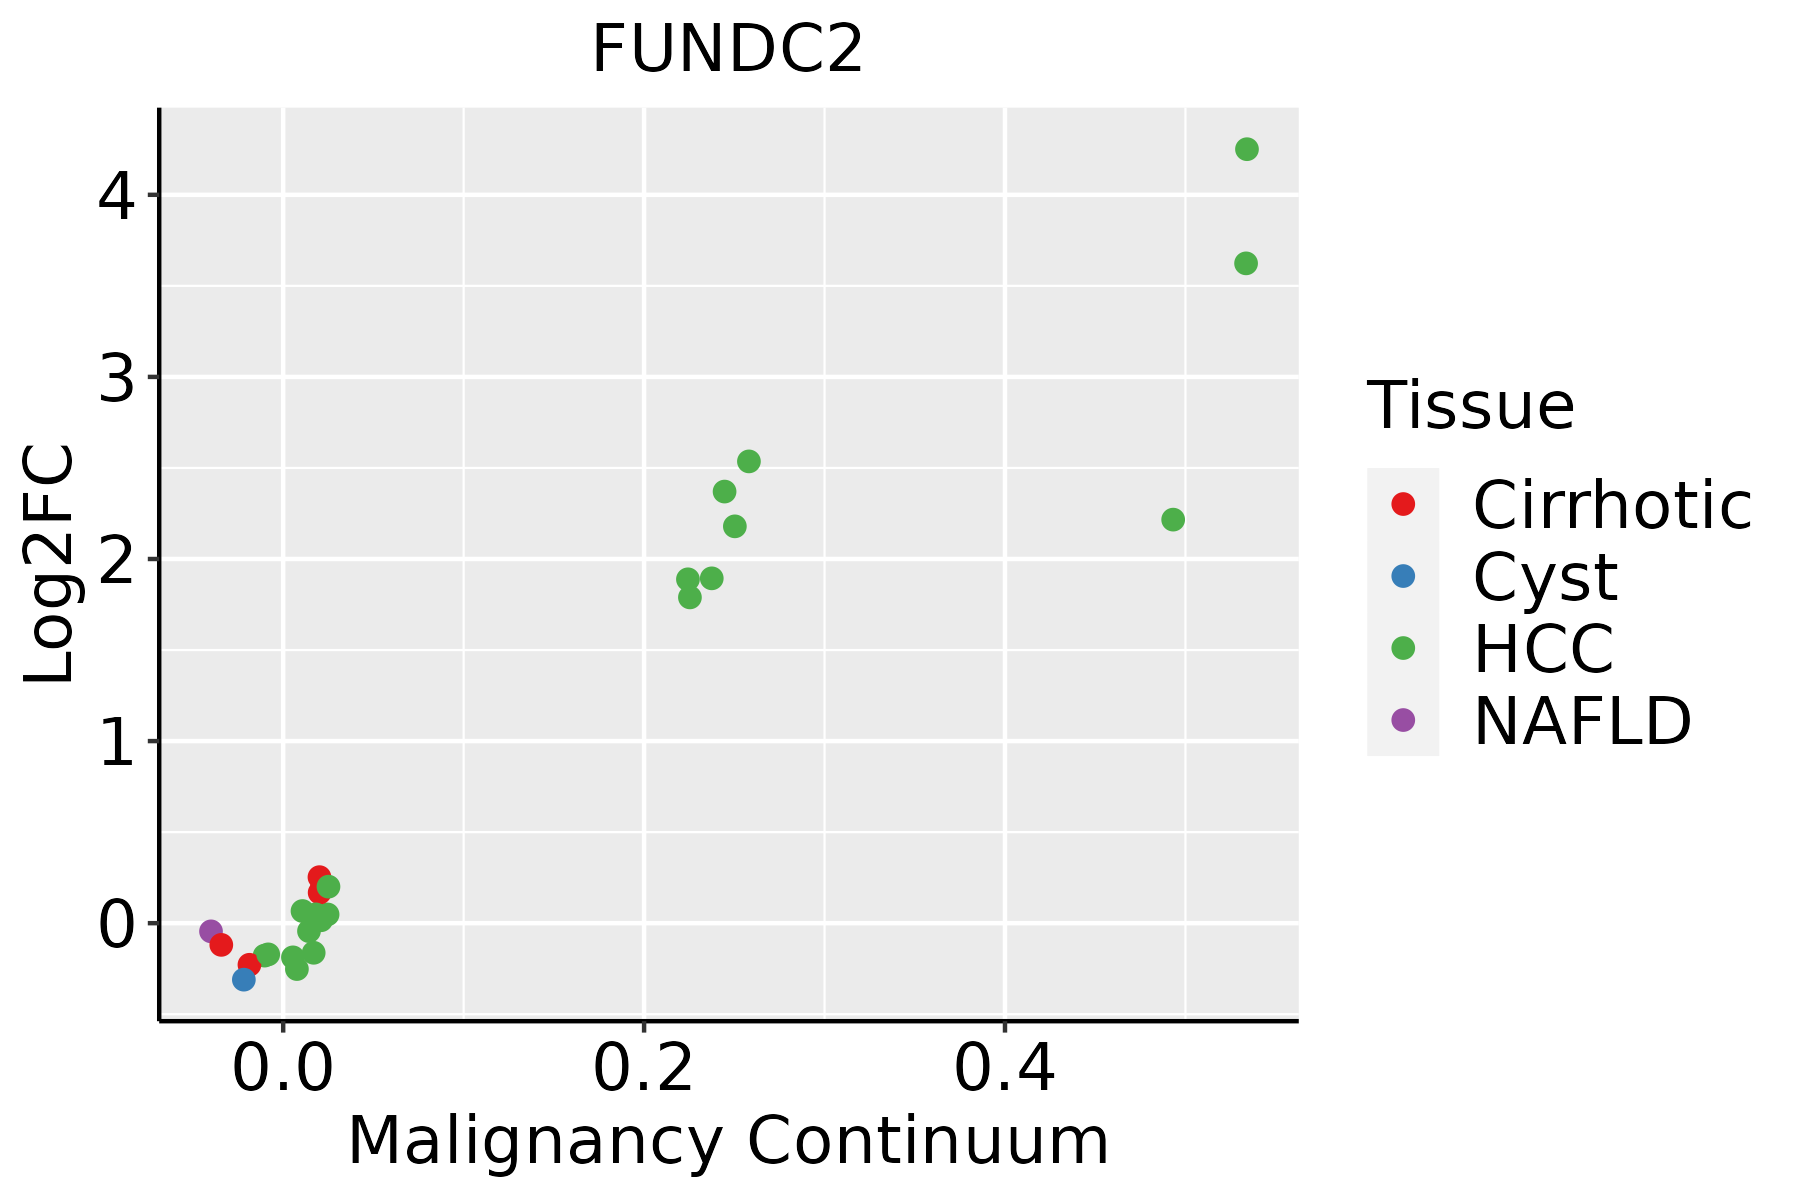
HCC: Hepatocellular carcinoma
NAFLD: Non-alcoholic fatty liver disease
Oral CavityThe image shows the transcriptomic changes along malignancy continuum.log2FC in expression of this searched gene in stem-like cells from each diseased tissue sample relative to stem-like cells in normal samples in each tissue plotted against the malignancy continuum. Samples are colored based on if they are from different disease stage.
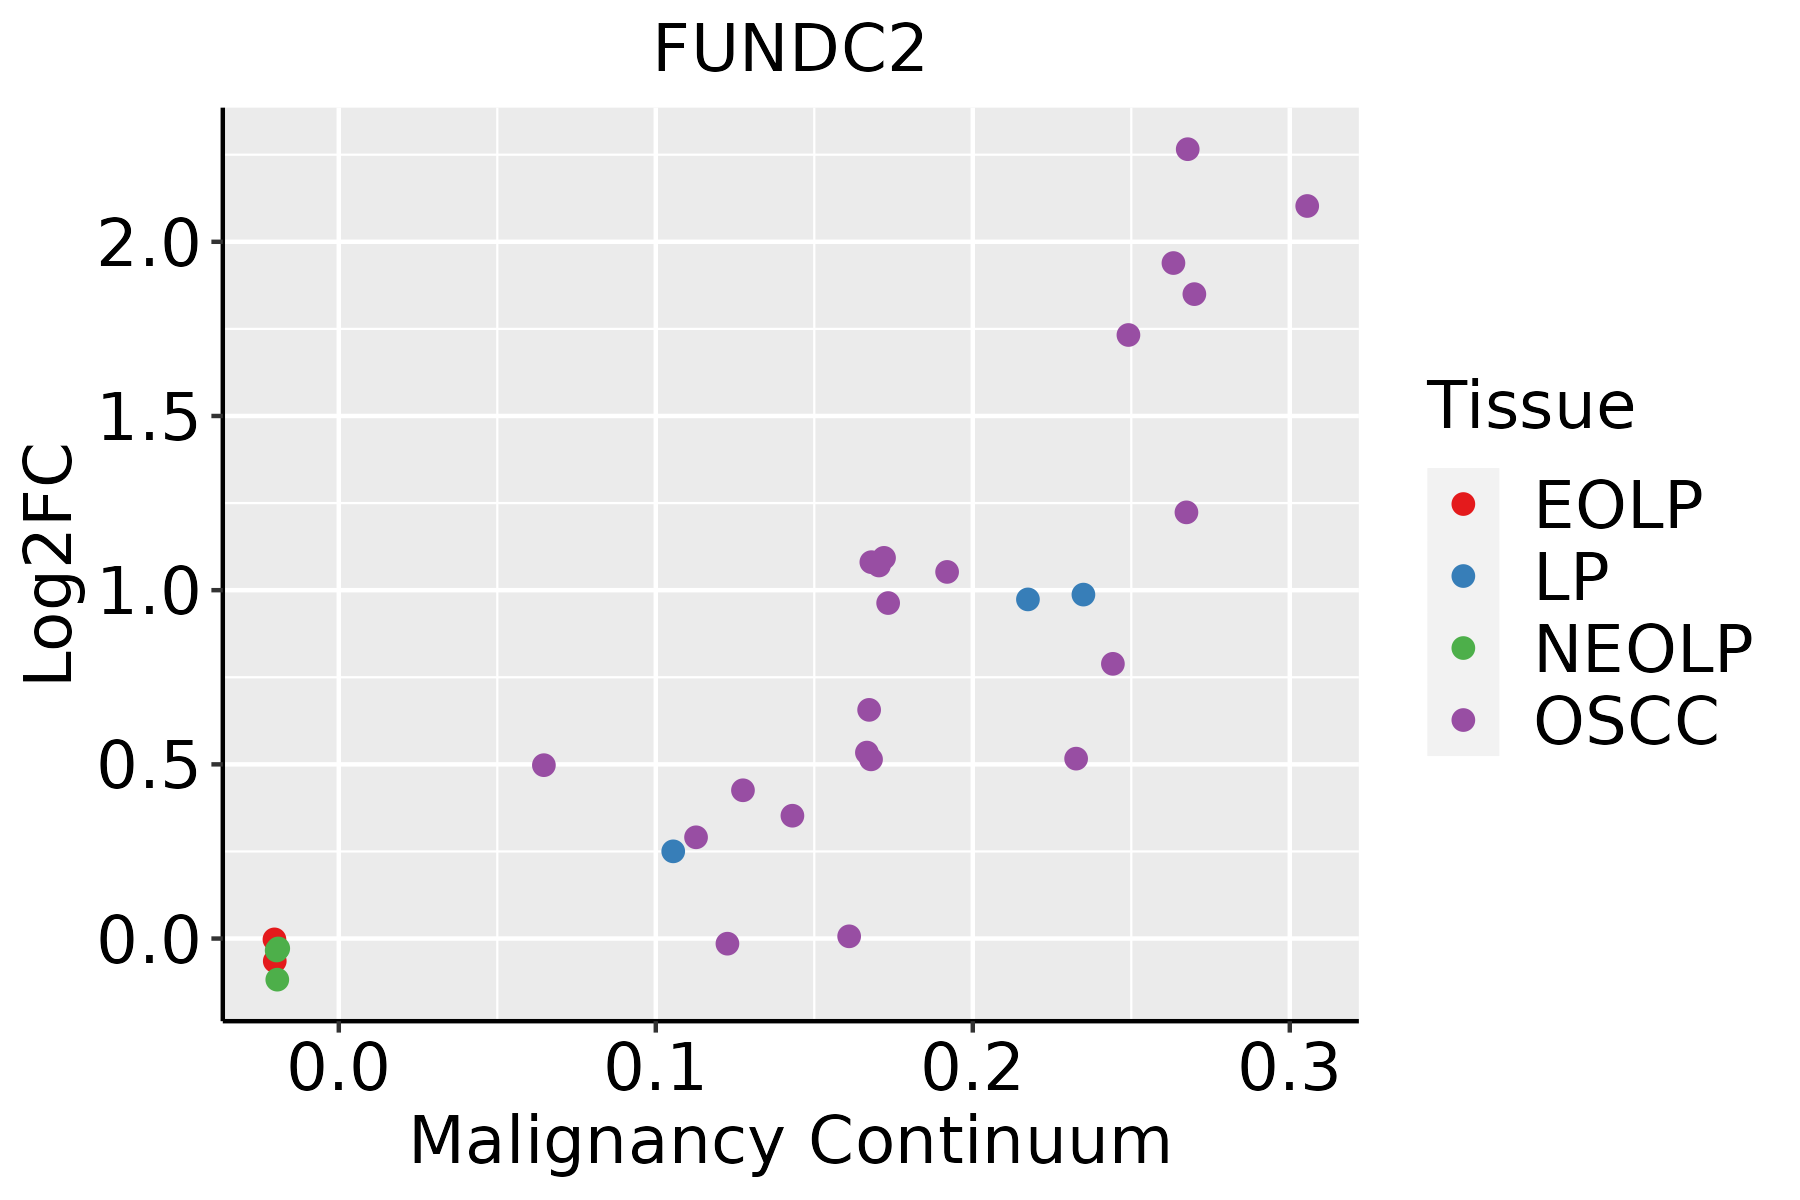
EOLP: Erosive Oral lichen planus
LP: leukoplakia
NEOLP: Non-erosive oral lichen planus
OSCC: Oral squamous cell carcinoma
ProstateThe image shows the transcriptomic changes along malignancy continuum.log2FC in expression of this searched gene in stem-like cells from each diseased tissue sample relative to stem-like cells in normal samples in each tissue plotted against the malignancy continuum. Samples are colored based on if they are from different disease stage.
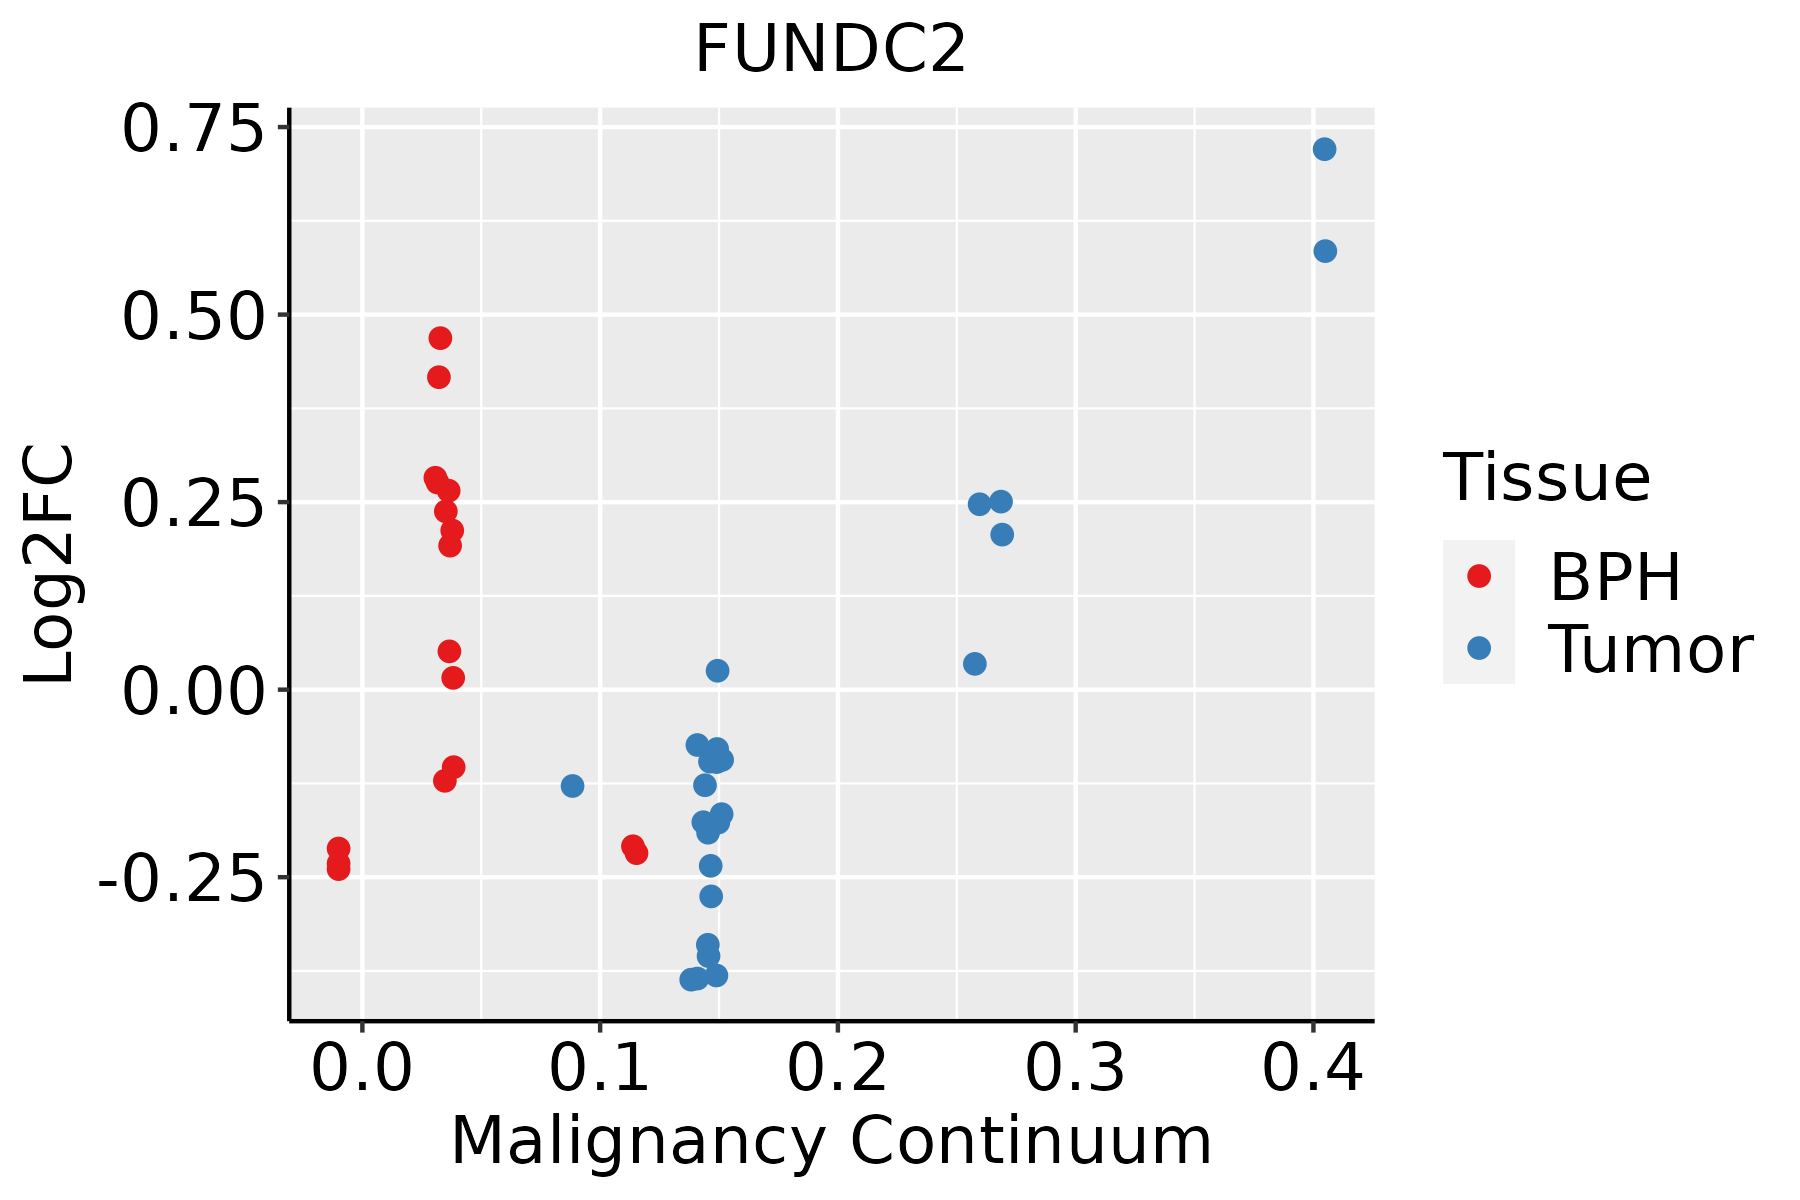
BPH: Benign Prostatic Hyperplasia
SkinThe image shows the transcriptomic changes along malignancy continuum.log2FC in expression of this searched gene in stem-like cells from each diseased tissue sample relative to stem-like cells in normal samples in each tissue plotted against the malignancy continuum. Samples are colored based on if they are from different disease stage.
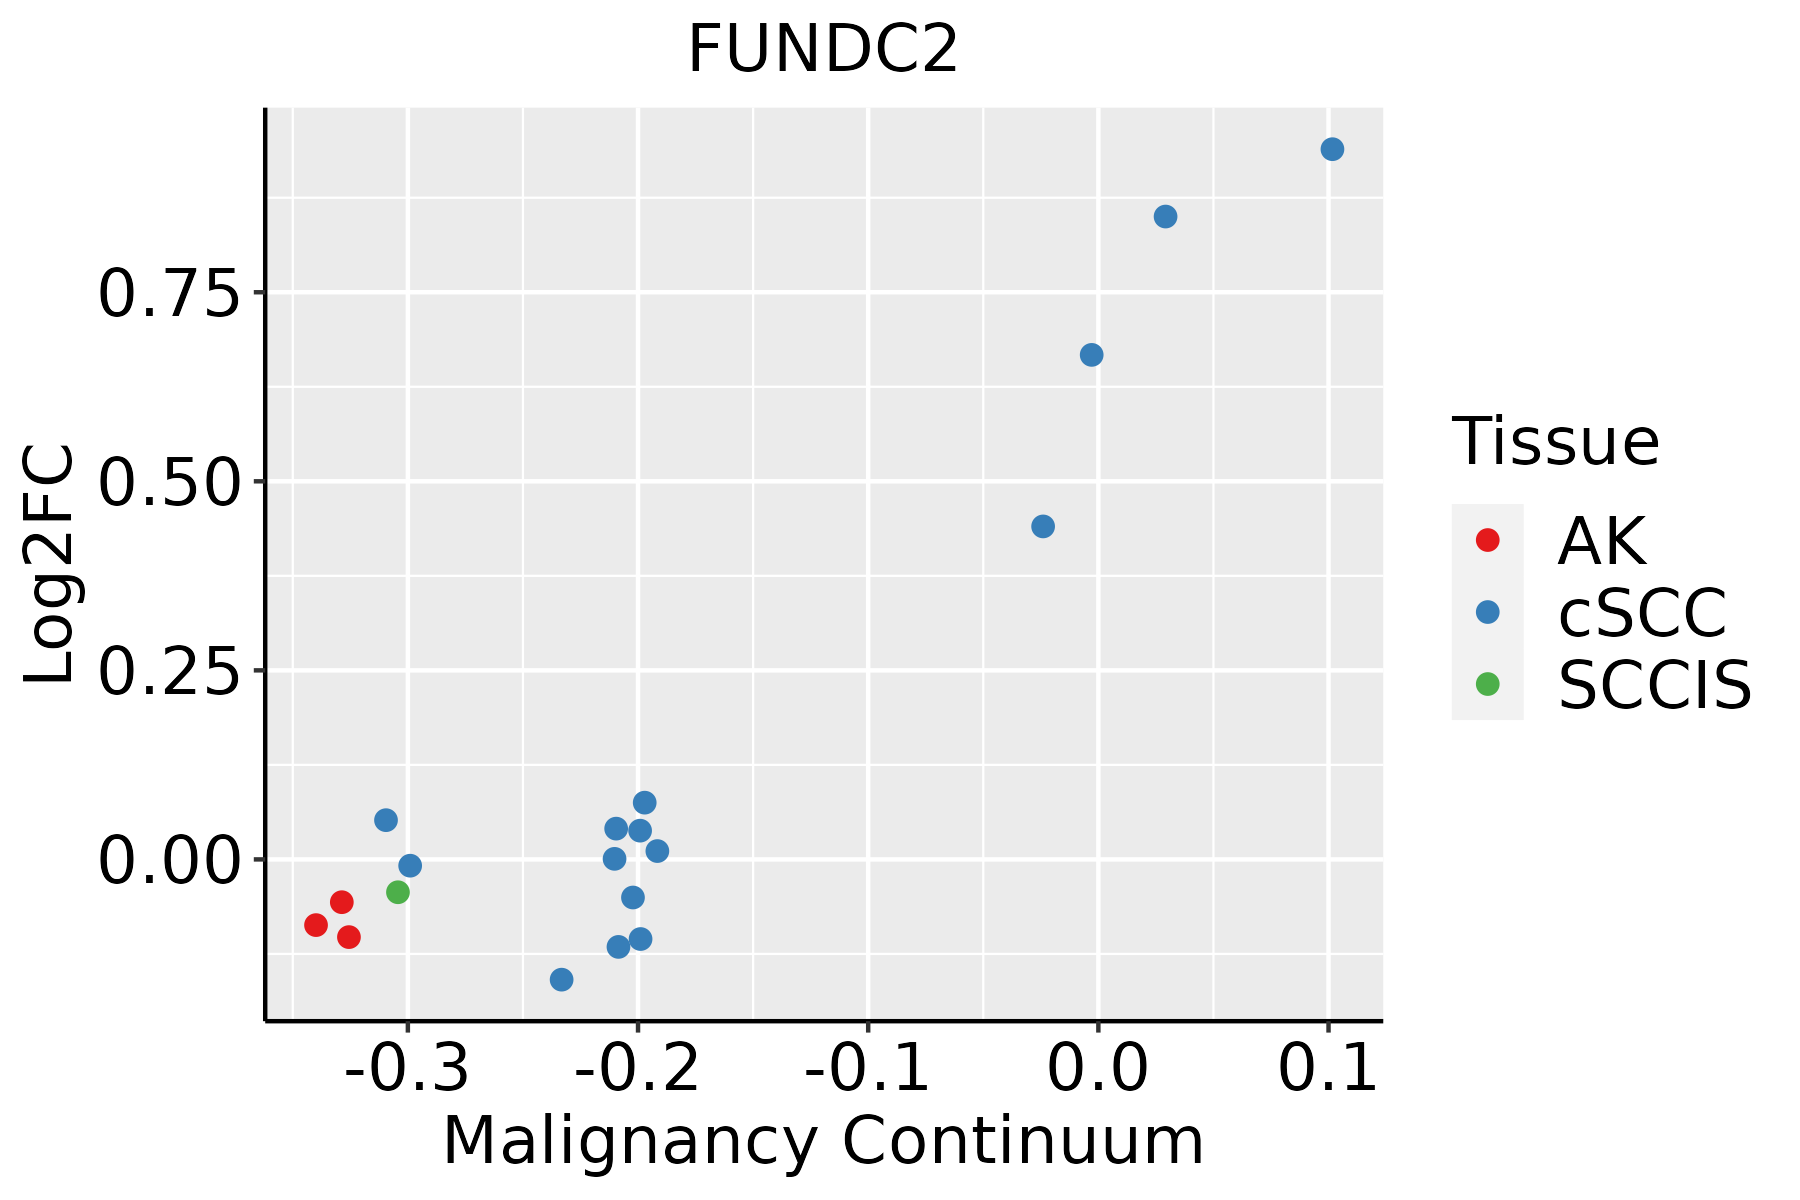
AK: Actinic keratosis
cSCC: Cutaneous squamous cell carcinoma
SCCIS:squamous cell carcinoma in situ
ThyroidThe image shows the transcriptomic changes along malignancy continuum.log2FC in expression of this searched gene in stem-like cells from each diseased tissue sample relative to stem-like cells in normal samples in each tissue plotted against the malignancy continuum. Samples are colored based on if they are from different disease stage.
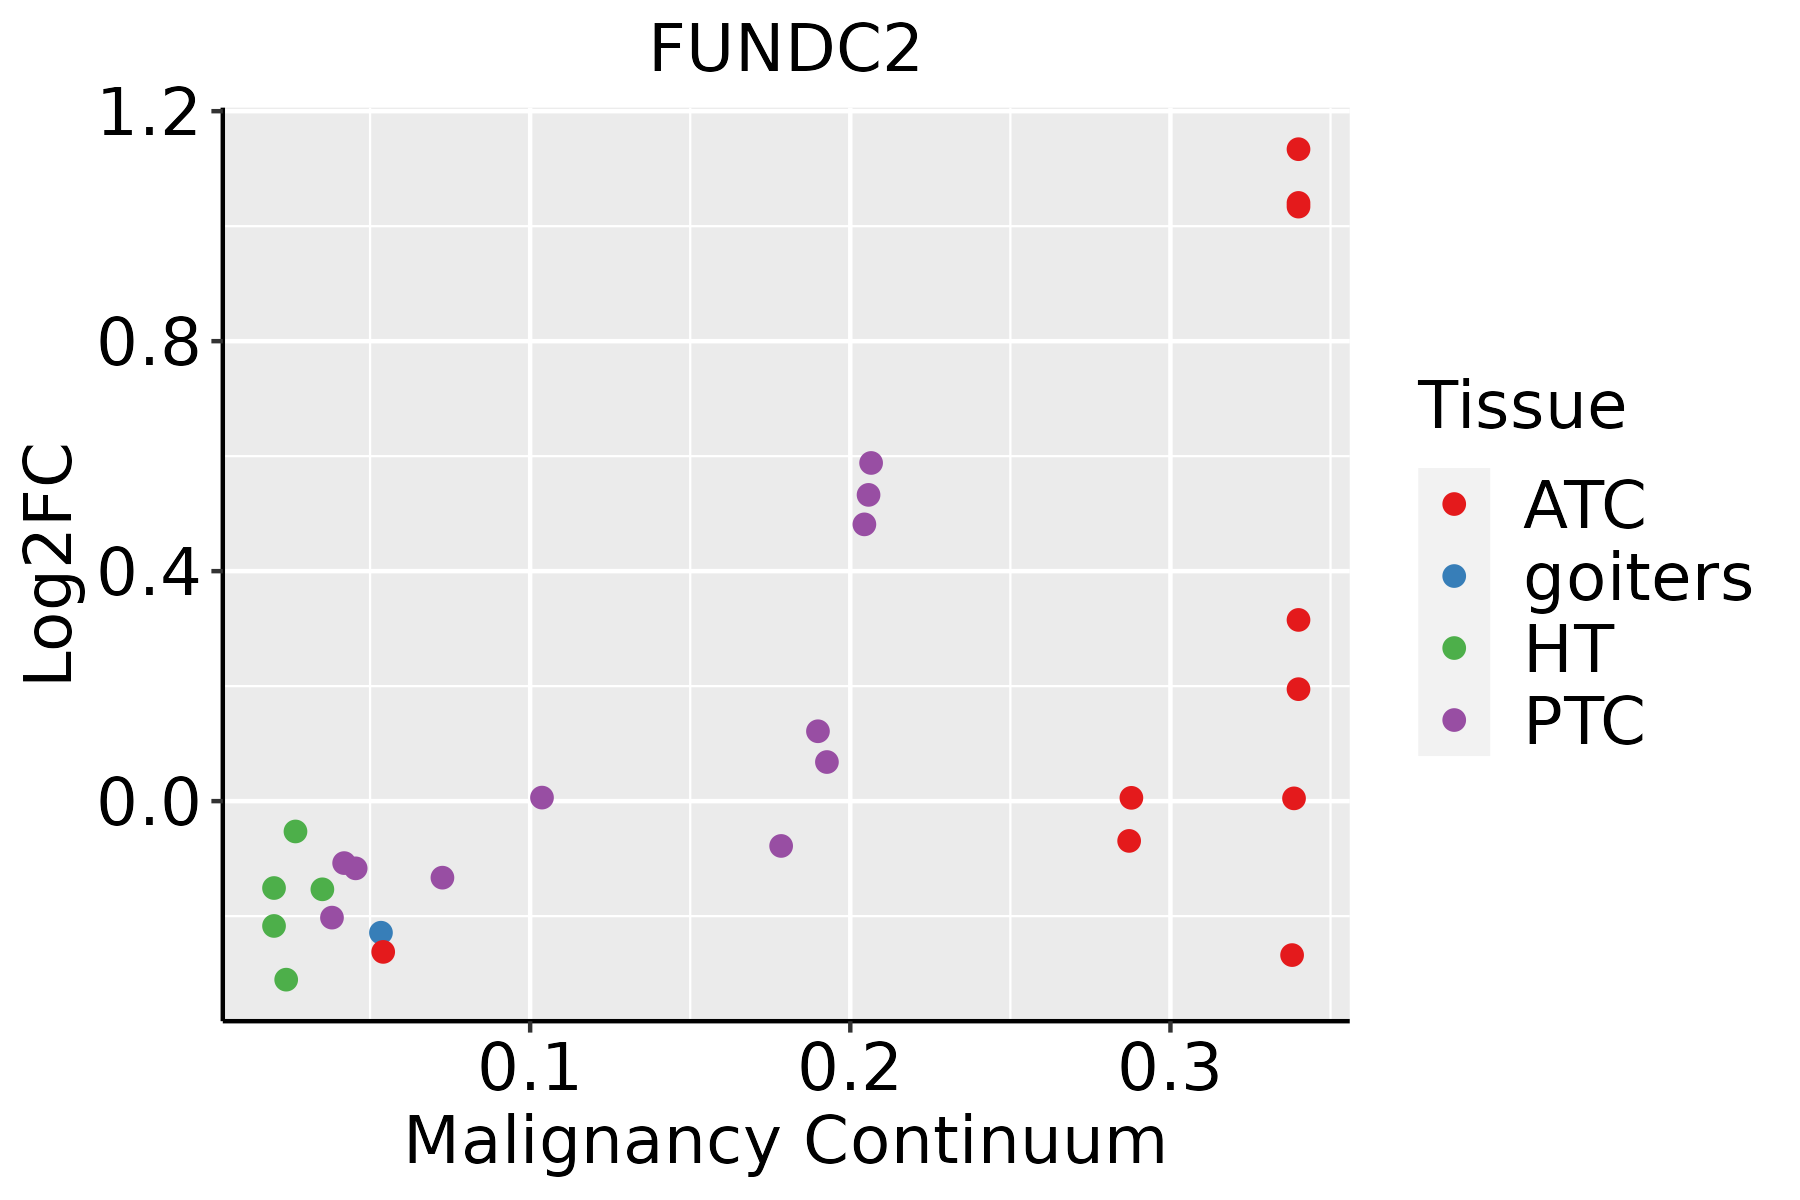
ATC: Anaplastic thyroid cancer
HT: Hashimoto's thyroiditis
PTC: Papillary thyroid cancer
∗log2FC in expression of this searched gene in stem-like cells from each diseased tissue sample relative to stem-like cells in normal samples in each tissue plotted against the malignancy continuum. Samples are colored based on if they are from different disease stage.

Top

Malignant transformation related pathway analysis

check buttonFind out the enriched GO biological processes and KEGG pathways involved in transition from healthy to precancer to cancer
check button Figure of enriched GO biological processes.
TissueDisease StageEnriched GO biological Processes
ColorectumADGO analysis - Figure of enriched GO biological processes: Top 15 enriched GO BP terms are showed in the bar plot of each disease state in each tissue. Each row represents a significant GO biological process which is colored according to the -log10(p.adjust).
ColorectumSERGO analysis - Figure of enriched GO biological processes: Top 15 enriched GO BP terms are showed in the bar plot of each disease state in each tissue. Each row represents a significant GO biological process which is colored according to the -log10(p.adjust).
ColorectumMSSGO analysis - Figure of enriched GO biological processes: Top 15 enriched GO BP terms are showed in the bar plot of each disease state in each tissue. Each row represents a significant GO biological process which is colored according to the -log10(p.adjust).
ColorectumMSI-HGO analysis - Figure of enriched GO biological processes: Top 15 enriched GO BP terms are showed in the bar plot of each disease state in each tissue. Each row represents a significant GO biological process which is colored according to the -log10(p.adjust).
ColorectumFAPGO analysis - Figure of enriched GO biological processes: Top 15 enriched GO BP terms are showed in the bar plot of each disease state in each tissue. Each row represents a significant GO biological process which is colored according to the -log10(p.adjust).
∗Top 15 enriched GO BP terms are showed in the bar plot of each disease state in each tissue. Each row represents a significant GO biological process which is colored according to the -log10(p.adjust).
Page: 1 2 3 4 5 6 7 8 9 

check button Enriched GO biological processes.
GO IDTissueDisease StageDescriptionGene RatioBg Ratiopvaluep.adjustCount
GO:002241120EsophagusHGINcellular component disassembly102/2587443/187238.31e-084.33e-06102
GO:19030089EsophagusHGINorganelle disassembly36/2587114/187238.60e-073.58e-0536
GO:000042216EsophagusHGINautophagy of mitochondrion25/258781/187235.95e-051.38e-0325
GO:006172616EsophagusHGINmitochondrion disassembly25/258781/187235.95e-051.38e-0325
GO:0022411111EsophagusESCCcellular component disassembly305/8552443/187231.94e-234.57e-21305
GO:190300816EsophagusESCCorganelle disassembly89/8552114/187231.36e-125.80e-1189
GO:000042217EsophagusESCCautophagy of mitochondrion63/855281/187233.41e-097.24e-0863
GO:006172617EsophagusESCCmitochondrion disassembly63/855281/187233.41e-097.24e-0863
GO:00224117LiverCirrhoticcellular component disassembly182/4634443/187231.59e-141.54e-12182
GO:19030084LiverCirrhoticorganelle disassembly59/4634114/187234.82e-102.27e-0859
GO:00004225LiverCirrhoticautophagy of mitochondrion43/463481/187234.02e-081.31e-0643
GO:00617265LiverCirrhoticmitochondrion disassembly43/463481/187234.02e-081.31e-0643
GO:002241112LiverHCCcellular component disassembly282/7958443/187231.02e-191.38e-17282
GO:190300811LiverHCCorganelle disassembly89/7958114/187238.68e-155.73e-1389
GO:000042211LiverHCCautophagy of mitochondrion64/795881/187231.96e-117.72e-1064
GO:006172611LiverHCCmitochondrion disassembly64/795881/187231.96e-117.72e-1064
GO:002241119Oral cavityOSCCcellular component disassembly283/7305443/187239.57e-273.37e-24283
GO:19030088Oral cavityOSCCorganelle disassembly85/7305114/187231.15e-146.93e-1385
GO:000042210Oral cavityOSCCautophagy of mitochondrion59/730581/187236.40e-101.63e-0859
GO:006172610Oral cavityOSCCmitochondrion disassembly59/730581/187236.40e-101.63e-0859
Page: 1 2 3 

check button Enriched KEGG pathways.
Pathway IDTissueDisease StageDescriptionGene RatioBg Ratiopvaluep.adjustqvalueCount
Page: 1 

Top

Cell-cell communication analysis

check buttonIdentification of potential cell-cell interactions between two cell types and their ligand-receptor pairs for different disease states
LigandReceptorLRpairPathwayTissueDisease Stage
Page: 1 

Top

Single-cell gene regulatory network inference analysis

check buttonFind out the significant the regulons (TFs) and the target genes of each regulon across cell types for different disease states
TFCell TypeTissueDisease StageTarget GeneRSSRegulon Activity
∗The dot plots of a searched regulon are shown for all cell subpopulations in each disease state of each tissue based on the regulon specific score inferred using pySCENIC and by calculating the average expression.
Page: 1 

Top

Somatic mutation of malignant transformation related genes

check buttonAnnotation of somatic variants for genes involved in malignant transformation
Hugo SymbolVariant ClassVariant ClassificationdbSNP RSHGVScHGVSpHGVSp ShortSWISSPROTBIOTYPESIFTPolyPhenTumor Sample BarcodeTissueHistologySexAgeStageTherapy TypesDrugsOutcome
FUNDC2SNVMissense_Mutationrs782780466c.170N>Tp.Ala57Valp.A57VQ9BWH2protein_codingdeleterious(0.04)benign(0.03)TCGA-AR-A5QP-01Breastbreast invasive carcinomaFemale<65I/IIHormone TherapytamoxiphenSD
FUNDC2insertionFrame_Shift_Insnovelc.328_329insGAAAATCATTCAGTTGCTTGGTGAGCCTCAGTAAACACCACp.Thr110ArgfsTer44p.T110Rfs*44Q9BWH2protein_codingTCGA-A7-A26G-01Breastbreast invasive carcinomaFemale<65I/IIChemotherapytaxotereSD
FUNDC2insertionFrame_Shift_Insnovelc.534_535insTp.Gly181ArgfsTer56p.G181Rfs*56Q9BWH2protein_codingTCGA-AR-A255-01Breastbreast invasive carcinomaFemale<65I/IITargeted Molecular therapytrastuzumabSD
FUNDC2SNVMissense_Mutationc.387N>Cp.Lys129Asnp.K129NQ9BWH2protein_codingtolerated(0.07)possibly_damaging(0.869)TCGA-Q1-A73O-01Cervixcervical & endocervical cancerFemale<65I/IIChemotherapycisplatinCR
FUNDC2SNVMissense_Mutationc.263N>Gp.Phe88Cysp.F88CQ9BWH2protein_codingdeleterious(0.02)possibly_damaging(0.518)TCGA-AA-3831-01Colorectumcolon adenocarcinomaMale>=65I/IIUnknownUnknownSD
FUNDC2SNVMissense_Mutationc.86G>Ap.Arg29Hisp.R29HQ9BWH2protein_codingdeleterious_low_confidence(0.04)benign(0.277)TCGA-WS-AB45-01Colorectumcolon adenocarcinomaFemale<65I/IIUnknownUnknownSD
FUNDC2SNVMissense_Mutationc.533G>Ap.Gly178Glup.G178EQ9BWH2protein_codingdeleterious(0)probably_damaging(1)TCGA-A5-A0G9-01Endometriumuterine corpus endometrioid carcinomaFemale>=65I/IIUnknownUnknownSD
FUNDC2SNVMissense_Mutationnovelc.432G>Tp.Glu144Aspp.E144DQ9BWH2protein_codingtolerated(0.05)benign(0.111)TCGA-A5-A1OF-01Endometriumuterine corpus endometrioid carcinomaFemale<65I/IIUnknownUnknownSD
FUNDC2SNVMissense_Mutationc.500C>Tp.Ser167Leup.S167LQ9BWH2protein_codingtolerated(0.19)benign(0.001)TCGA-B5-A3FA-01Endometriumuterine corpus endometrioid carcinomaFemale>=65I/IIUnknownUnknownSD
FUNDC2SNVMissense_Mutationnovelc.57C>Ap.His19Glnp.H19QQ9BWH2protein_codingtolerated_low_confidence(0.32)benign(0.003)TCGA-B5-A3FC-01Endometriumuterine corpus endometrioid carcinomaFemale<65I/IIUnknownUnknownSD
Page: 1 2 3 

Top

Related drugs of malignant transformation related genes

check buttonIdentification of chemicals and drugs interact with genes involved in malignant transfromation
(DGIdb 4.0)
Entrez IDSymbolCategoryInteraction TypesDrug Claim NameDrug NamePMIDs
Page: 1