
|
|||||
|
 | |
| |
| |
| |
| |
| |
|
Gene: FGFR1OP |
Gene summary for FGFR1OP |
| Gene information | Species | Human | Gene symbol | FGFR1OP | Gene ID | 11116 |
| Gene name | centrosomal protein 43 | |
| Gene Alias | FGFR1OP | |
| Cytomap | 6q27 | |
| Gene Type | protein-coding | GO ID | GO:0000226 | UniProtAcc | A0A087WV25 |
Top |
Malignant transformation analysis |
| Identification of the aberrant gene expression in precancerous and cancerous lesions by comparing the gene expression of stem-like cells in diseased tissues with normal stem cells |
| Entrez ID | Symbol | Replicates | Species | Organ | Tissue | Adj P-value | Log2FC | Malignancy |
| 11116 | FGFR1OP | P42T-E | Human | Esophagus | ESCC | 1.37e-14 | 2.10e-01 | 0.1175 |
| 11116 | FGFR1OP | P44T-E | Human | Esophagus | ESCC | 3.32e-04 | 1.15e-01 | 0.1096 |
| 11116 | FGFR1OP | P47T-E | Human | Esophagus | ESCC | 8.17e-15 | 1.20e-01 | 0.1067 |
| 11116 | FGFR1OP | P48T-E | Human | Esophagus | ESCC | 8.58e-13 | 1.40e-01 | 0.0959 |
| 11116 | FGFR1OP | P49T-E | Human | Esophagus | ESCC | 2.34e-06 | 3.64e-01 | 0.1768 |
| 11116 | FGFR1OP | P52T-E | Human | Esophagus | ESCC | 3.41e-17 | 2.79e-01 | 0.1555 |
| 11116 | FGFR1OP | P54T-E | Human | Esophagus | ESCC | 4.87e-20 | 2.58e-01 | 0.0975 |
| 11116 | FGFR1OP | P56T-E | Human | Esophagus | ESCC | 6.93e-09 | 1.04e+00 | 0.1613 |
| 11116 | FGFR1OP | P57T-E | Human | Esophagus | ESCC | 9.56e-10 | 1.60e-01 | 0.0926 |
| 11116 | FGFR1OP | P61T-E | Human | Esophagus | ESCC | 6.12e-11 | 1.87e-01 | 0.099 |
| 11116 | FGFR1OP | P62T-E | Human | Esophagus | ESCC | 5.59e-22 | 2.55e-01 | 0.1302 |
| 11116 | FGFR1OP | P65T-E | Human | Esophagus | ESCC | 2.05e-12 | 1.19e-01 | 0.0978 |
| 11116 | FGFR1OP | P74T-E | Human | Esophagus | ESCC | 9.01e-19 | 5.52e-01 | 0.1479 |
| 11116 | FGFR1OP | P75T-E | Human | Esophagus | ESCC | 1.88e-18 | 3.32e-01 | 0.1125 |
| 11116 | FGFR1OP | P76T-E | Human | Esophagus | ESCC | 8.53e-16 | 2.60e-01 | 0.1207 |
| 11116 | FGFR1OP | P79T-E | Human | Esophagus | ESCC | 2.39e-21 | 3.40e-01 | 0.1154 |
| 11116 | FGFR1OP | P80T-E | Human | Esophagus | ESCC | 2.11e-22 | 5.52e-01 | 0.155 |
| 11116 | FGFR1OP | P82T-E | Human | Esophagus | ESCC | 7.30e-13 | 3.80e-01 | 0.1072 |
| 11116 | FGFR1OP | P83T-E | Human | Esophagus | ESCC | 8.90e-23 | 5.26e-01 | 0.1738 |
| 11116 | FGFR1OP | P84T-E | Human | Esophagus | ESCC | 9.51e-09 | 2.92e-01 | 0.0933 |
| Page: 1 2 3 4 5 6 7 |
| Tissue | Expression Dynamics | Abbreviation |
| Colorectum (GSE201348) |  | FAP: Familial adenomatous polyposis |
| CRC: Colorectal cancer | ||
| Colorectum (HTA11) | 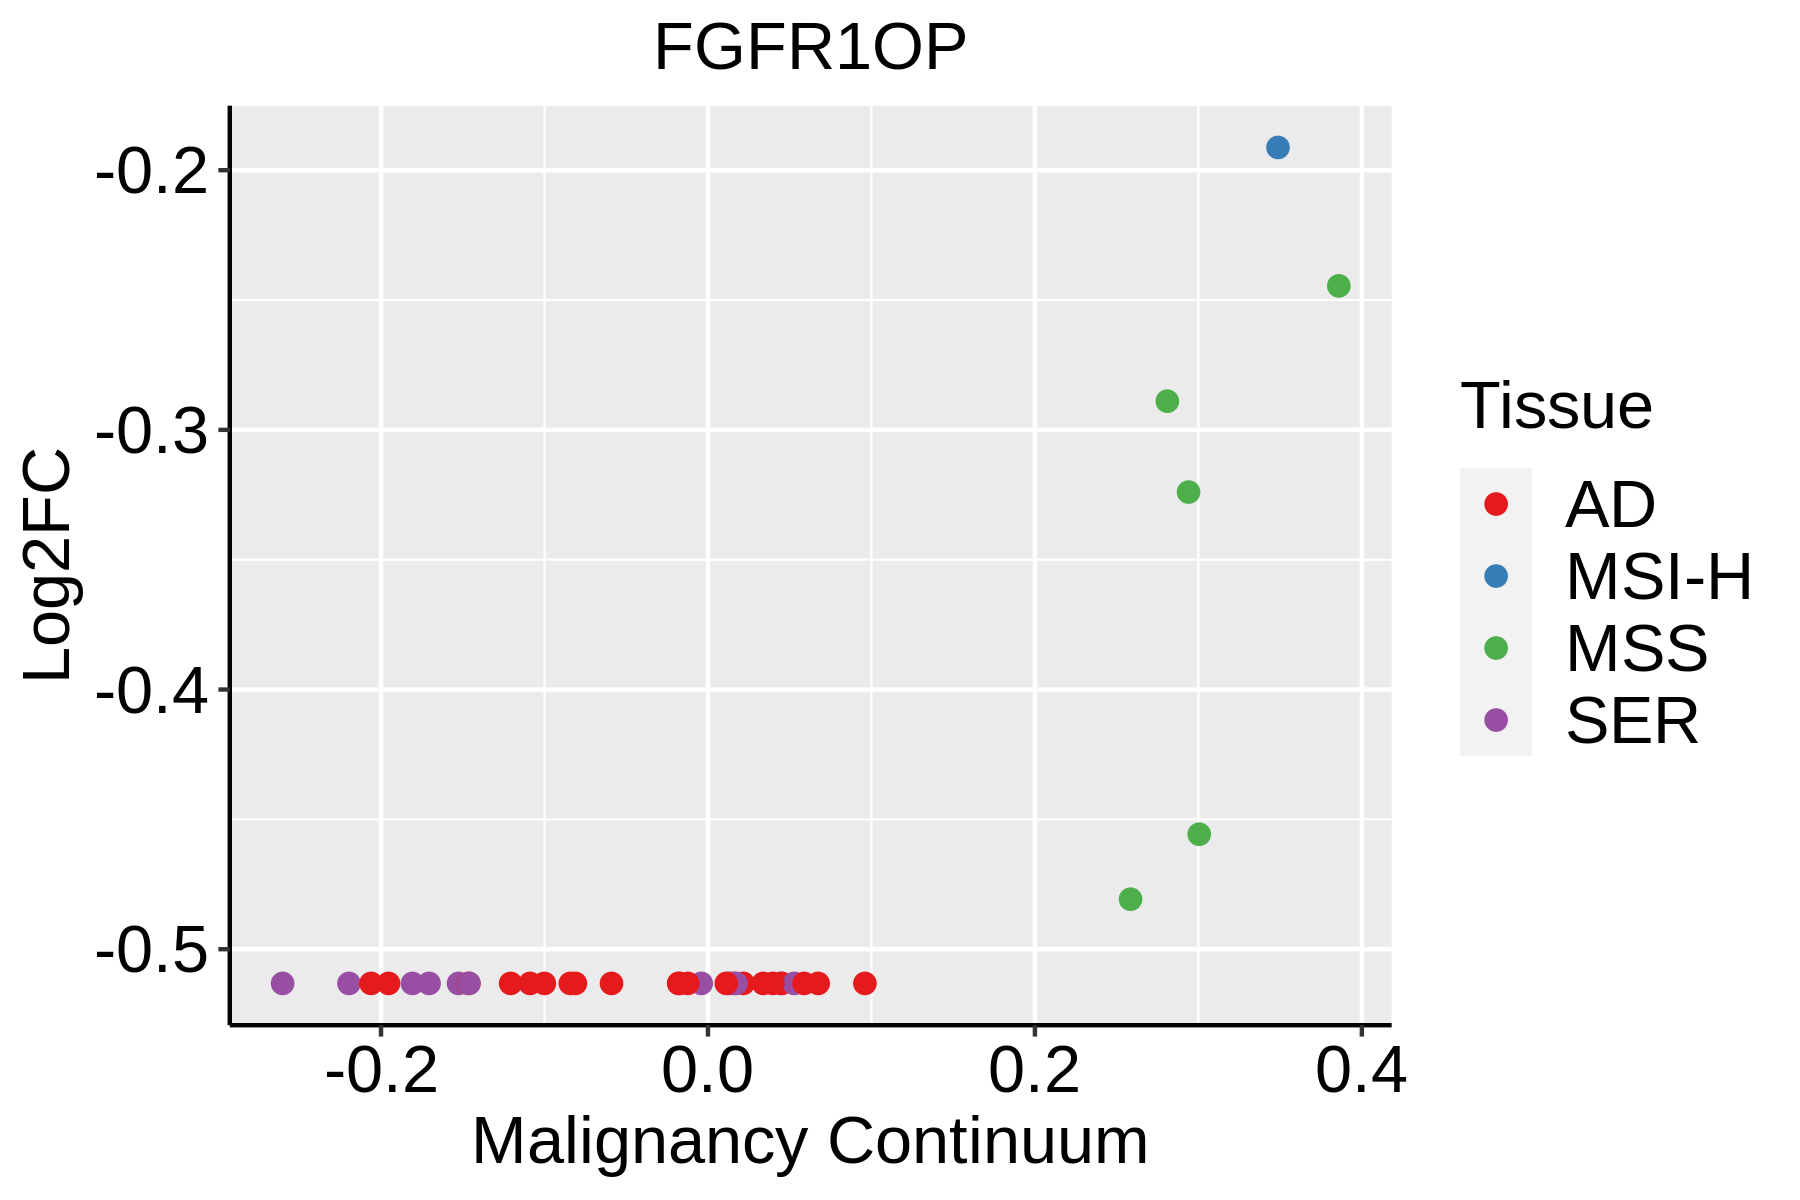 | AD: Adenomas |
| SER: Sessile serrated lesions | ||
| MSI-H: Microsatellite-high colorectal cancer | ||
| MSS: Microsatellite stable colorectal cancer | ||
| Esophagus | 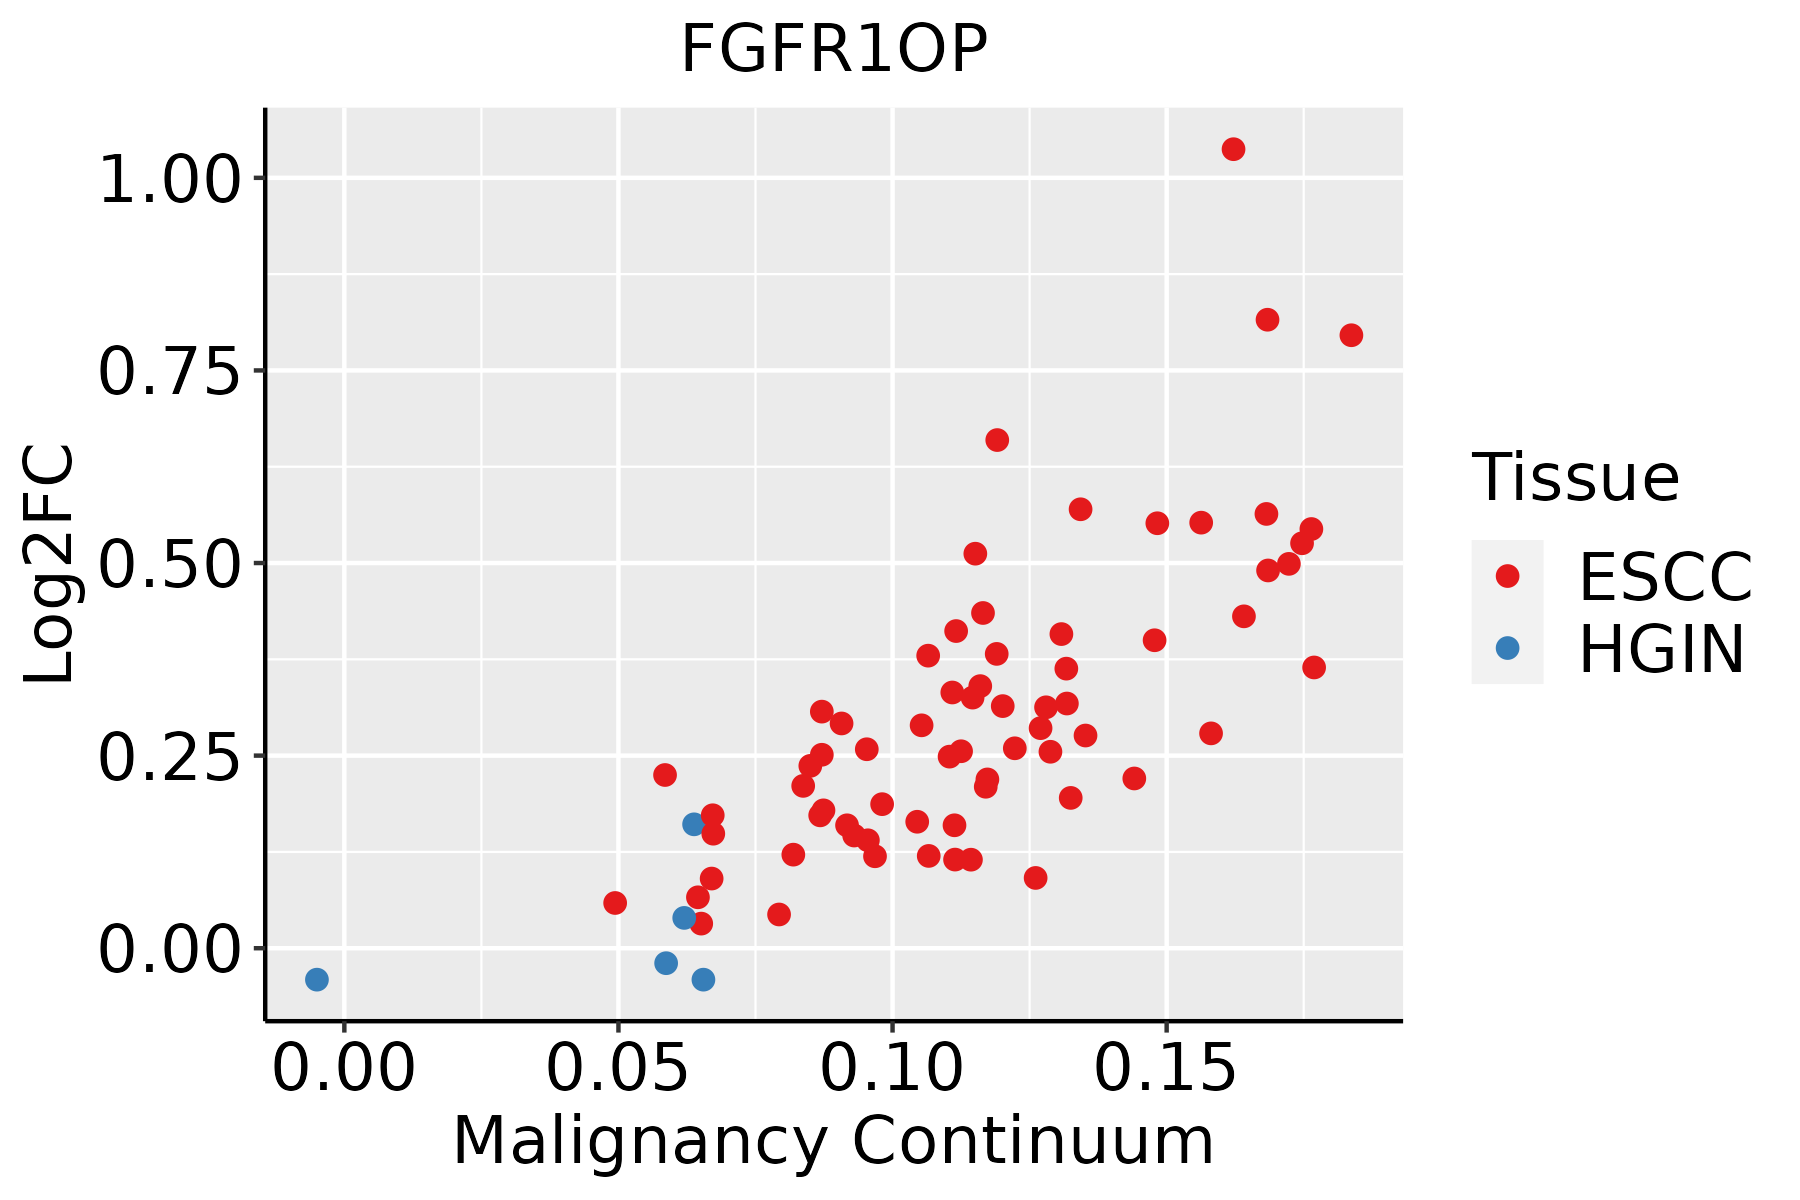 | ESCC: Esophageal squamous cell carcinoma |
| HGIN: High-grade intraepithelial neoplasias | ||
| LGIN: Low-grade intraepithelial neoplasias | ||
| Liver |  | HCC: Hepatocellular carcinoma |
| NAFLD: Non-alcoholic fatty liver disease | ||
| Oral Cavity | 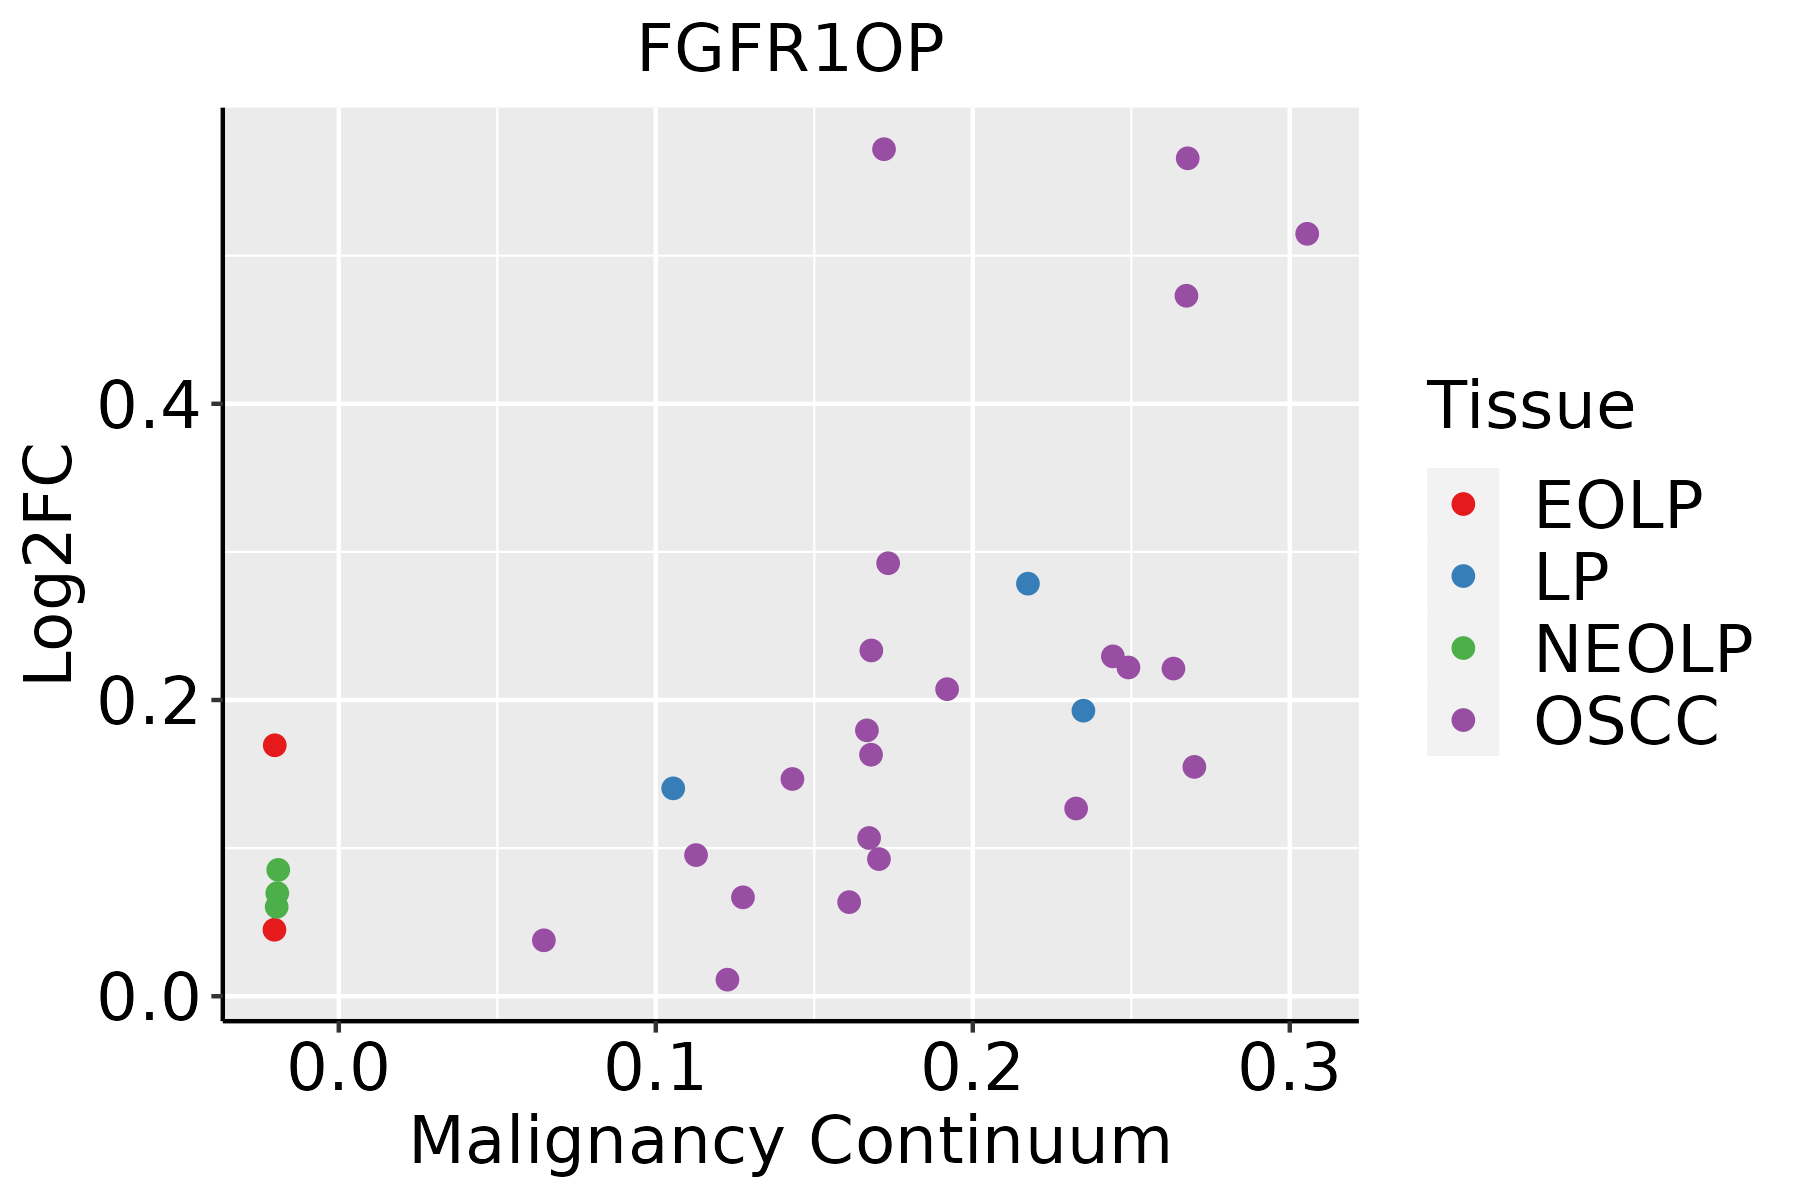 | EOLP: Erosive Oral lichen planus |
| LP: leukoplakia | ||
| NEOLP: Non-erosive oral lichen planus | ||
| OSCC: Oral squamous cell carcinoma |
| ∗log2FC in expression of this searched gene in stem-like cells from each diseased tissue sample relative to stem-like cells in normal samples in each tissue plotted against the malignancy continuum. Samples are colored based on if they are from different disease stage. |
Top |
Malignant transformation related pathway analysis |
| Find out the enriched GO biological processes and KEGG pathways involved in transition from healthy to precancer to cancer |
| Tissue | Disease Stage | Enriched GO biological Processes |
| Colorectum | AD |  |
| Colorectum | SER |  |
| Colorectum | MSS |  |
| Colorectum | MSI-H |  |
| Colorectum | FAP |  |
| ∗Top 15 enriched GO BP terms are showed in the bar plot of each disease state in each tissue. Each row represents a significant GO biological process which is colored according to the -log10(p.adjust). |
| Page: 1 2 3 4 5 6 7 8 9 |
| GO ID | Tissue | Disease Stage | Description | Gene Ratio | Bg Ratio | pvalue | p.adjust | Count |
| GO:004206027 | Esophagus | ESCC | wound healing | 243/8552 | 422/18723 | 4.62e-07 | 6.25e-06 | 243 |
| GO:004206012 | Liver | Cirrhotic | wound healing | 155/4634 | 422/18723 | 2.12e-08 | 7.56e-07 | 155 |
| GO:004206022 | Liver | HCC | wound healing | 219/7958 | 422/18723 | 5.34e-05 | 5.04e-04 | 219 |
| GO:004206020 | Oral cavity | OSCC | wound healing | 237/7305 | 422/18723 | 4.51e-13 | 2.18e-11 | 237 |
| GO:0042060110 | Oral cavity | LP | wound healing | 139/4623 | 422/18723 | 7.10e-05 | 9.48e-04 | 139 |
| GO:004206030 | Thyroid | HT | wound healing | 60/1272 | 422/18723 | 4.06e-08 | 2.69e-06 | 60 |
| GO:0042060112 | Thyroid | PTC | wound healing | 190/5968 | 422/18723 | 7.72e-09 | 1.92e-07 | 190 |
| GO:004206034 | Thyroid | ATC | wound healing | 210/6293 | 422/18723 | 3.33e-12 | 1.37e-10 | 210 |
| Page: 1 |
| Pathway ID | Tissue | Disease Stage | Description | Gene Ratio | Bg Ratio | pvalue | p.adjust | qvalue | Count |
| Page: 1 |
Top |
Cell-cell communication analysis |
| Identification of potential cell-cell interactions between two cell types and their ligand-receptor pairs for different disease states |
| Ligand | Receptor | LRpair | Pathway | Tissue | Disease Stage |
| Page: 1 |
Top |
Single-cell gene regulatory network inference analysis |
| Find out the significant the regulons (TFs) and the target genes of each regulon across cell types for different disease states |
| TF | Cell Type | Tissue | Disease Stage | Target Gene | RSS | Regulon Activity |
| ∗The dot plots of a searched regulon are shown for all cell subpopulations in each disease state of each tissue based on the regulon specific score inferred using pySCENIC and by calculating the average expression. |
| Page: 1 |
Top |
Somatic mutation of malignant transformation related genes |
| Annotation of somatic variants for genes involved in malignant transformation |
| Hugo Symbol | Variant Class | Variant Classification | dbSNP RS | HGVSc | HGVSp | HGVSp Short | SWISSPROT | BIOTYPE | SIFT | PolyPhen | Tumor Sample Barcode | Tissue | Histology | Sex | Age | Stage | Therapy Types | Drugs | Outcome |
| FGFR1OP | SNV | Missense_Mutation | novel | c.715N>C | p.Asp239His | p.D239H | O95684 | protein_coding | deleterious(0.01) | possibly_damaging(0.681) | TCGA-A8-A097-01 | Breast | breast invasive carcinoma | Female | >=65 | I/II | Hormone Therapy | tamoxiphen | SD |
| FGFR1OP | insertion | Nonsense_Mutation | novel | c.253_254insCGTAGCCCGCGCGCGGAGCGTACCCTGCTGCGGCCGTTGGCCG | p.Phe85SerfsTer2 | p.F85Sfs*2 | O95684 | protein_coding | TCGA-A8-A07G-01 | Breast | breast invasive carcinoma | Female | >=65 | I/II | Chemotherapy | 5-fluorouracil | CR | ||
| FGFR1OP | SNV | Missense_Mutation | novel | c.1018N>A | p.Asp340Asn | p.D340N | O95684 | protein_coding | deleterious(0) | probably_damaging(0.958) | TCGA-VS-A959-01 | Cervix | cervical & endocervical cancer | Female | >=65 | I/II | Unknown | Unknown | SD |
| FGFR1OP | SNV | Missense_Mutation | novel | c.467N>A | p.Ser156Tyr | p.S156Y | O95684 | protein_coding | deleterious(0.04) | possibly_damaging(0.499) | TCGA-AA-3984-01 | Colorectum | colon adenocarcinoma | Female | <65 | I/II | Unknown | Unknown | SD |
| FGFR1OP | SNV | Missense_Mutation | c.446T>G | p.Leu149Arg | p.L149R | O95684 | protein_coding | tolerated(0.23) | possibly_damaging(0.451) | TCGA-F4-6809-01 | Colorectum | colon adenocarcinoma | Female | <65 | I/II | Unknown | Unknown | PD | |
| FGFR1OP | deletion | Frame_Shift_Del | c.859delN | p.Leu289Ter | p.L289* | O95684 | protein_coding | TCGA-WS-AB45-01 | Colorectum | colon adenocarcinoma | Female | <65 | I/II | Unknown | Unknown | SD | |||
| FGFR1OP | SNV | Missense_Mutation | rs377028909 | c.215N>A | p.Arg72His | p.R72H | O95684 | protein_coding | tolerated(0.07) | probably_damaging(0.99) | TCGA-AJ-A3BH-01 | Endometrium | uterine corpus endometrioid carcinoma | Female | Unknown | I/II | Unknown | Unknown | SD |
| FGFR1OP | SNV | Missense_Mutation | c.242N>G | p.Phe81Cys | p.F81C | O95684 | protein_coding | deleterious(0) | probably_damaging(1) | TCGA-AP-A0LM-01 | Endometrium | uterine corpus endometrioid carcinoma | Female | <65 | III/IV | Chemotherapy | cisplatin | SD | |
| FGFR1OP | SNV | Missense_Mutation | novel | c.337N>T | p.Asp113Tyr | p.D113Y | O95684 | protein_coding | deleterious(0) | probably_damaging(0.992) | TCGA-AX-A2HD-01 | Endometrium | uterine corpus endometrioid carcinoma | Female | >=65 | III/IV | Unknown | Unknown | SD |
| FGFR1OP | SNV | Missense_Mutation | rs528148538 | c.400N>T | p.Arg134Cys | p.R134C | O95684 | protein_coding | tolerated(0.07) | benign(0.36) | TCGA-B5-A11H-01 | Endometrium | uterine corpus endometrioid carcinoma | Female | >=65 | III/IV | Hormone Therapy | megace | SD |
| Page: 1 2 3 |
Top |
Related drugs of malignant transformation related genes |
| Identification of chemicals and drugs interact with genes involved in malignant transfromation |
| (DGIdb 4.0) |
| Entrez ID | Symbol | Category | Interaction Types | Drug Claim Name | Drug Name | PMIDs |
| Page: 1 |

Copyright 2023-Present -The University of Texas Health Science Center at Houston |