
|
|||||
|
 | |
| |
| |
| |
| |
| |
|
Gene: FAM32A |
Gene summary for FAM32A |
| Gene information | Species | Human | Gene symbol | FAM32A | Gene ID | 26017 |
| Gene name | family with sequence similarity 32 member A | |
| Gene Alias | OTAG-12 | |
| Cytomap | 19p13.11 | |
| Gene Type | protein-coding | GO ID | GO:0006915 | UniProtAcc | A0A024R7I4 |
Top |
Malignant transformation analysis |
| Identification of the aberrant gene expression in precancerous and cancerous lesions by comparing the gene expression of stem-like cells in diseased tissues with normal stem cells |
| Entrez ID | Symbol | Replicates | Species | Organ | Tissue | Adj P-value | Log2FC | Malignancy |
| 26017 | FAM32A | P56T-E | Human | Esophagus | ESCC | 1.54e-09 | 1.08e+00 | 0.1613 |
| 26017 | FAM32A | P57T-E | Human | Esophagus | ESCC | 2.22e-20 | 3.10e-01 | 0.0926 |
| 26017 | FAM32A | P61T-E | Human | Esophagus | ESCC | 1.77e-28 | 7.78e-01 | 0.099 |
| 26017 | FAM32A | P62T-E | Human | Esophagus | ESCC | 3.74e-68 | 1.21e+00 | 0.1302 |
| 26017 | FAM32A | P65T-E | Human | Esophagus | ESCC | 1.02e-20 | 3.93e-01 | 0.0978 |
| 26017 | FAM32A | P74T-E | Human | Esophagus | ESCC | 1.26e-40 | 1.09e+00 | 0.1479 |
| 26017 | FAM32A | P75T-E | Human | Esophagus | ESCC | 7.58e-55 | 1.15e+00 | 0.1125 |
| 26017 | FAM32A | P76T-E | Human | Esophagus | ESCC | 2.56e-27 | 5.36e-01 | 0.1207 |
| 26017 | FAM32A | P79T-E | Human | Esophagus | ESCC | 5.92e-26 | 7.03e-01 | 0.1154 |
| 26017 | FAM32A | P80T-E | Human | Esophagus | ESCC | 4.31e-45 | 1.32e+00 | 0.155 |
| 26017 | FAM32A | P82T-E | Human | Esophagus | ESCC | 7.02e-14 | 1.04e+00 | 0.1072 |
| 26017 | FAM32A | P83T-E | Human | Esophagus | ESCC | 5.01e-45 | 1.38e+00 | 0.1738 |
| 26017 | FAM32A | P84T-E | Human | Esophagus | ESCC | 2.34e-20 | 1.06e+00 | 0.0933 |
| 26017 | FAM32A | P89T-E | Human | Esophagus | ESCC | 1.73e-23 | 1.64e+00 | 0.1752 |
| 26017 | FAM32A | P91T-E | Human | Esophagus | ESCC | 3.04e-16 | 1.76e+00 | 0.1828 |
| 26017 | FAM32A | P94T-E | Human | Esophagus | ESCC | 1.12e-03 | 6.67e-01 | 0.0879 |
| 26017 | FAM32A | P107T-E | Human | Esophagus | ESCC | 4.66e-55 | 1.35e+00 | 0.171 |
| 26017 | FAM32A | P126T-E | Human | Esophagus | ESCC | 1.62e-10 | 1.25e+00 | 0.1125 |
| 26017 | FAM32A | P127T-E | Human | Esophagus | ESCC | 2.63e-27 | 3.57e-01 | 0.0826 |
| 26017 | FAM32A | P128T-E | Human | Esophagus | ESCC | 2.79e-41 | 1.44e+00 | 0.1241 |
| Page: 1 2 3 4 5 6 7 8 9 |
| Tissue | Expression Dynamics | Abbreviation |
| Colorectum (GSE201348) |  | FAP: Familial adenomatous polyposis |
| CRC: Colorectal cancer | ||
| Colorectum (HTA11) |  | AD: Adenomas |
| SER: Sessile serrated lesions | ||
| MSI-H: Microsatellite-high colorectal cancer | ||
| MSS: Microsatellite stable colorectal cancer | ||
| Esophagus | 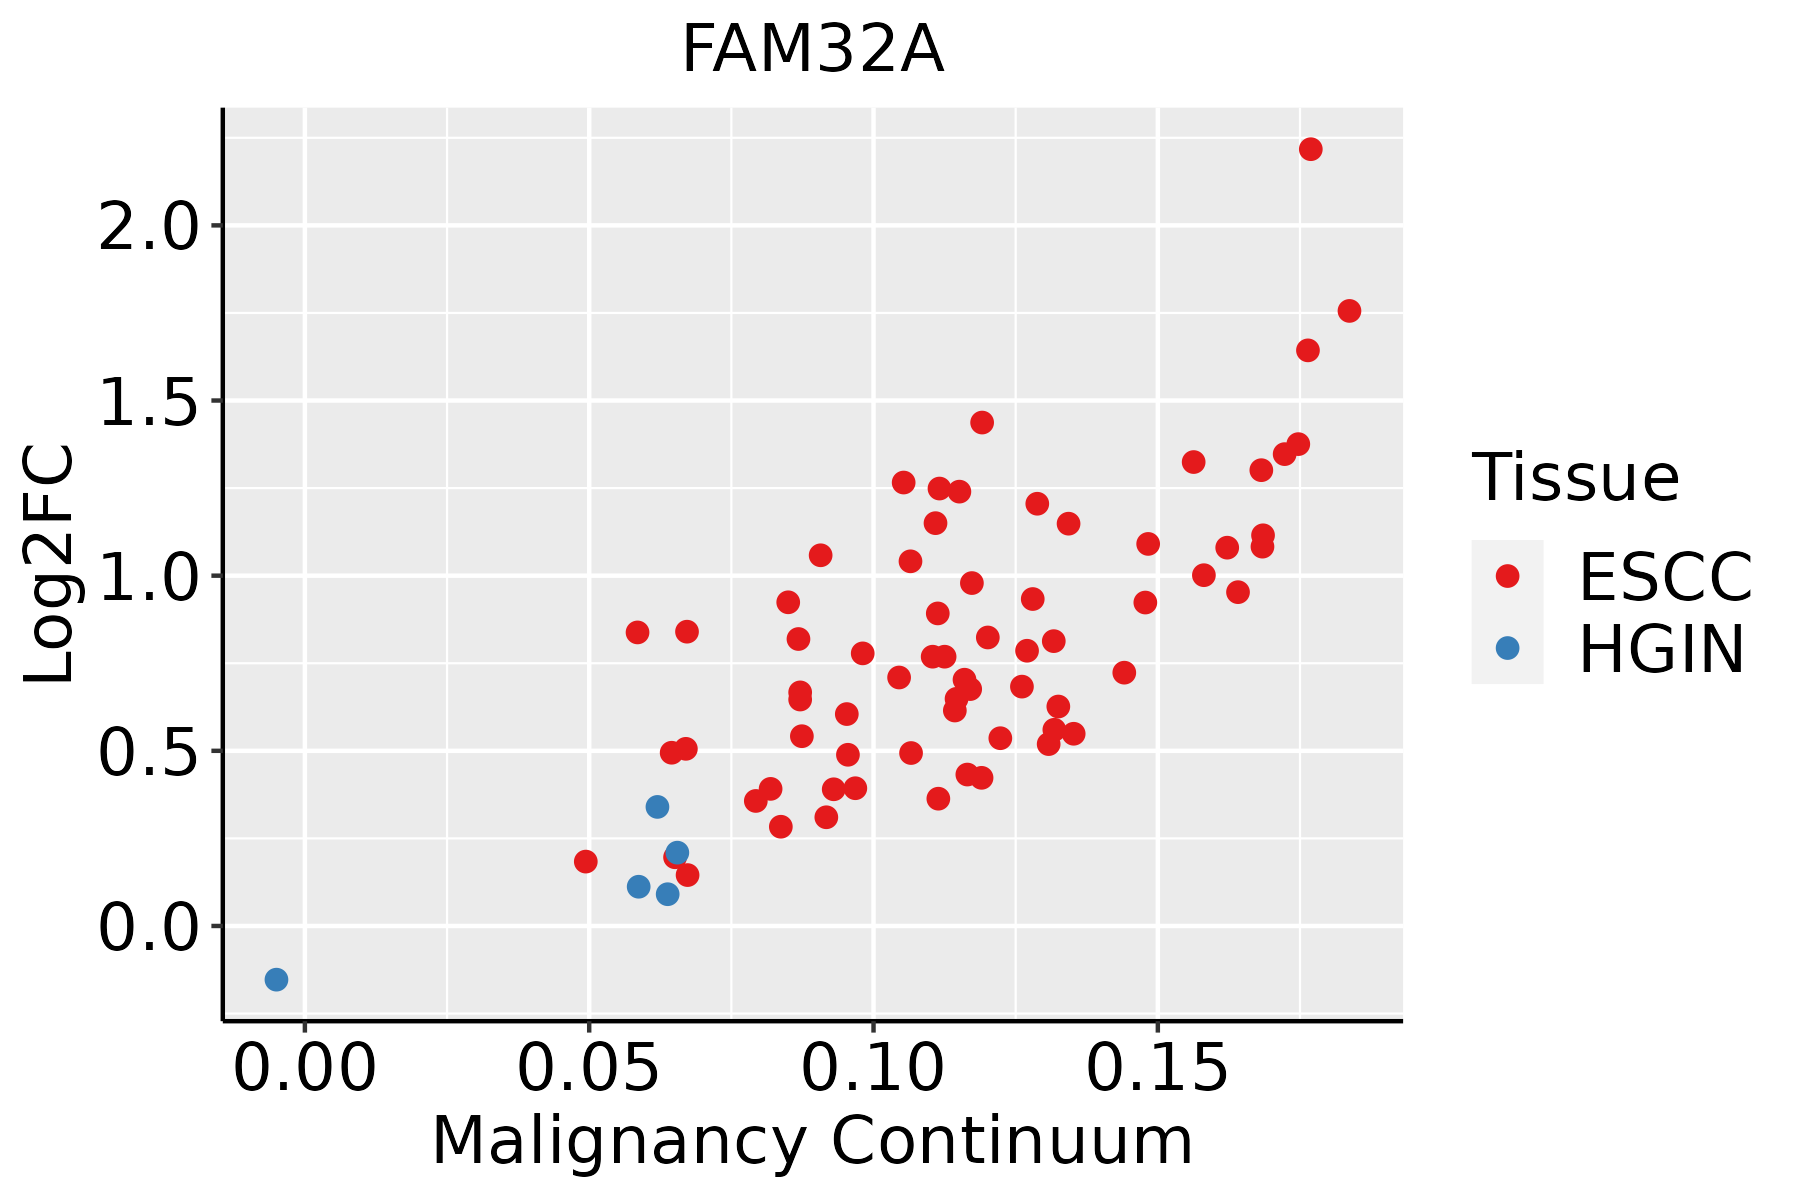 | ESCC: Esophageal squamous cell carcinoma |
| HGIN: High-grade intraepithelial neoplasias | ||
| LGIN: Low-grade intraepithelial neoplasias | ||
| Liver |  | HCC: Hepatocellular carcinoma |
| NAFLD: Non-alcoholic fatty liver disease | ||
| Oral Cavity |  | EOLP: Erosive Oral lichen planus |
| LP: leukoplakia | ||
| NEOLP: Non-erosive oral lichen planus | ||
| OSCC: Oral squamous cell carcinoma | ||
| Skin | 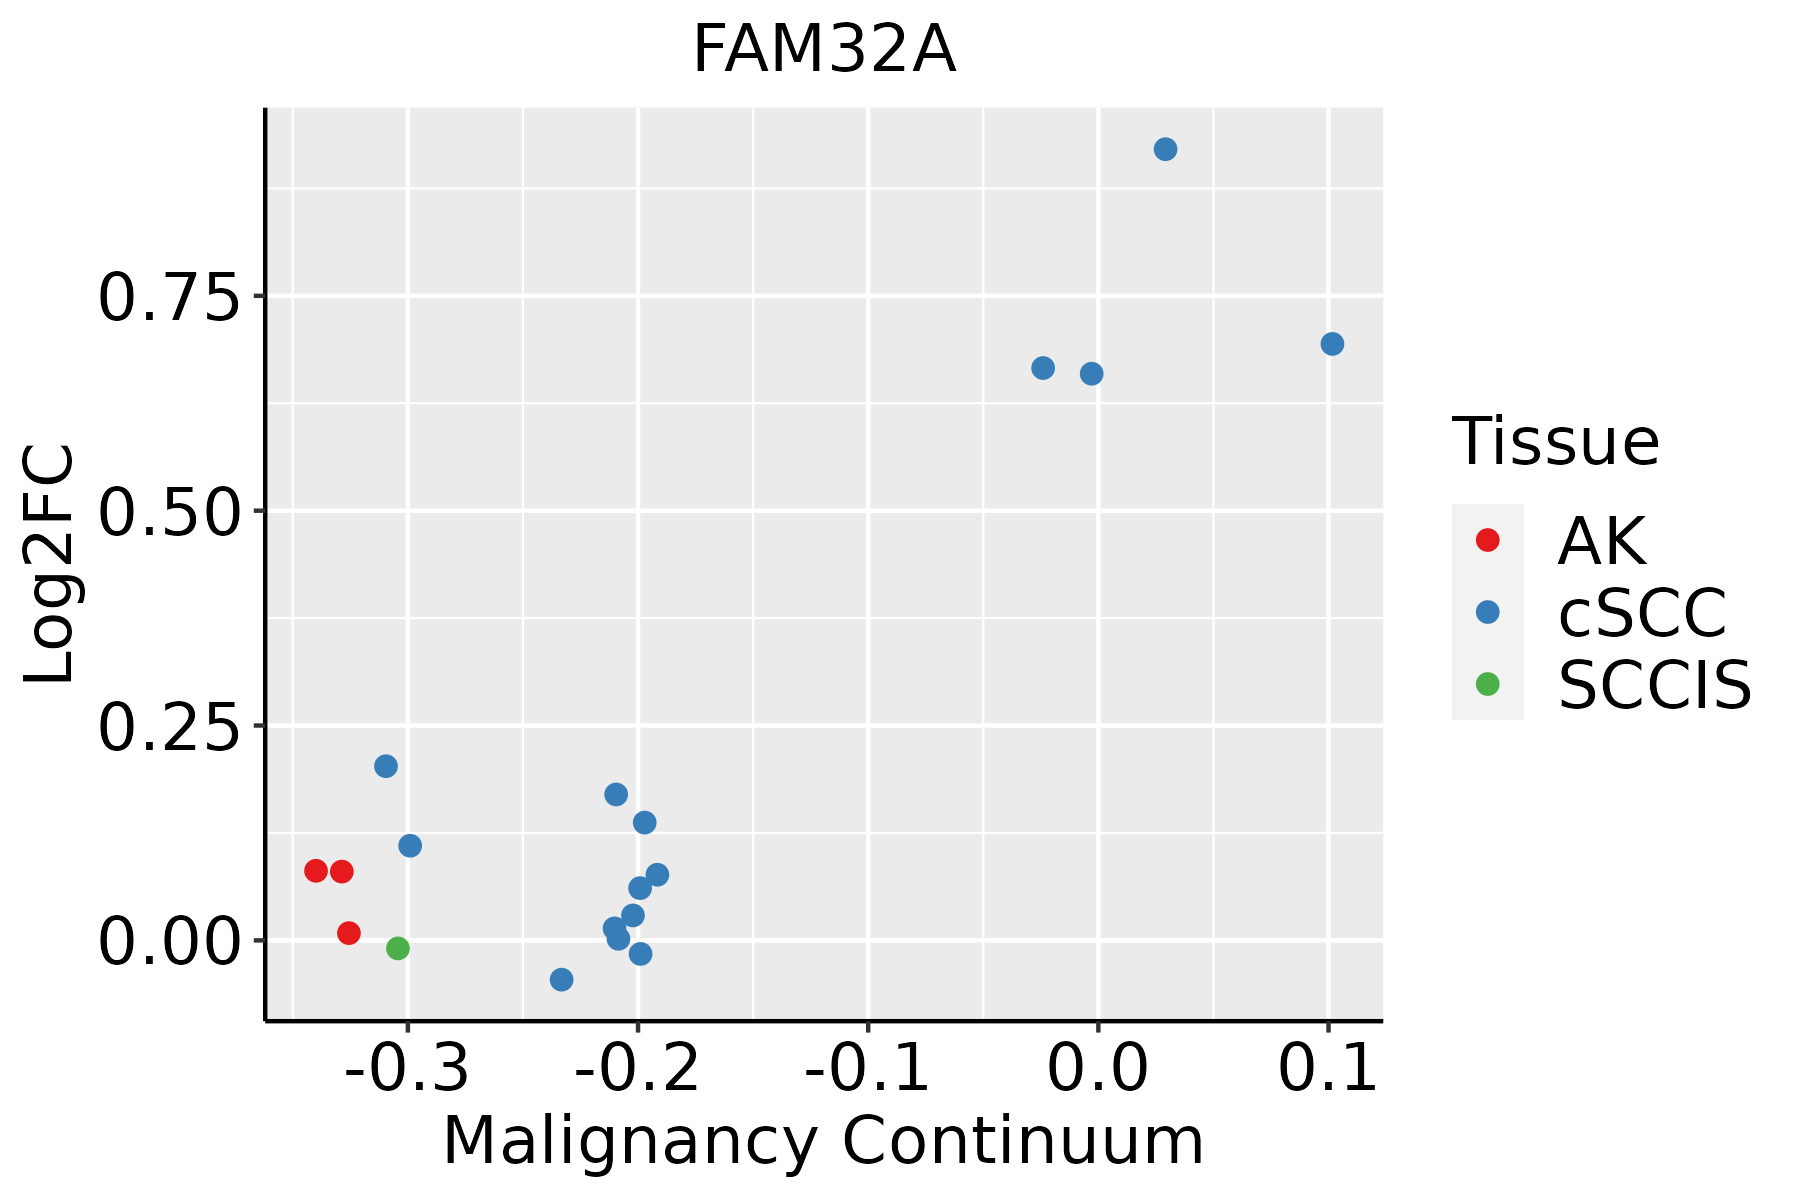 | AK: Actinic keratosis |
| cSCC: Cutaneous squamous cell carcinoma | ||
| SCCIS:squamous cell carcinoma in situ | ||
| Thyroid |  | ATC: Anaplastic thyroid cancer |
| HT: Hashimoto's thyroiditis | ||
| PTC: Papillary thyroid cancer |
| ∗log2FC in expression of this searched gene in stem-like cells from each diseased tissue sample relative to stem-like cells in normal samples in each tissue plotted against the malignancy continuum. Samples are colored based on if they are from different disease stage. |
Top |
Malignant transformation related pathway analysis |
| Find out the enriched GO biological processes and KEGG pathways involved in transition from healthy to precancer to cancer |
| Tissue | Disease Stage | Enriched GO biological Processes |
| Colorectum | AD |  |
| Colorectum | SER |  |
| Colorectum | MSS |  |
| Colorectum | MSI-H |  |
| Colorectum | FAP |  |
| ∗Top 15 enriched GO BP terms are showed in the bar plot of each disease state in each tissue. Each row represents a significant GO biological process which is colored according to the -log10(p.adjust). |
| Page: 1 2 3 4 5 6 7 8 9 |
| GO ID | Tissue | Disease Stage | Description | Gene Ratio | Bg Ratio | pvalue | p.adjust | Count |
| Page: 1 |
| Pathway ID | Tissue | Disease Stage | Description | Gene Ratio | Bg Ratio | pvalue | p.adjust | qvalue | Count |
| Page: 1 |
Top |
Cell-cell communication analysis |
| Identification of potential cell-cell interactions between two cell types and their ligand-receptor pairs for different disease states |
| Ligand | Receptor | LRpair | Pathway | Tissue | Disease Stage |
| Page: 1 |
Top |
Single-cell gene regulatory network inference analysis |
| Find out the significant the regulons (TFs) and the target genes of each regulon across cell types for different disease states |
| TF | Cell Type | Tissue | Disease Stage | Target Gene | RSS | Regulon Activity |
| ∗The dot plots of a searched regulon are shown for all cell subpopulations in each disease state of each tissue based on the regulon specific score inferred using pySCENIC and by calculating the average expression. |
| Page: 1 |
Top |
Somatic mutation of malignant transformation related genes |
| Annotation of somatic variants for genes involved in malignant transformation |
| Hugo Symbol | Variant Class | Variant Classification | dbSNP RS | HGVSc | HGVSp | HGVSp Short | SWISSPROT | BIOTYPE | SIFT | PolyPhen | Tumor Sample Barcode | Tissue | Histology | Sex | Age | Stage | Therapy Types | Drugs | Outcome |
| FAM32A | SNV | Missense_Mutation | c.196N>C | p.Glu66Gln | p.E66Q | Q9Y421 | protein_coding | tolerated(0.32) | probably_damaging(0.987) | TCGA-AC-A23H-01 | Breast | breast invasive carcinoma | Female | >=65 | I/II | Unknown | Unknown | PD | |
| FAM32A | SNV | Missense_Mutation | novel | c.271N>A | p.Asp91Asn | p.D91N | Q9Y421 | protein_coding | tolerated(0.09) | benign(0.041) | TCGA-BH-A0B6-01 | Breast | breast invasive carcinoma | Female | <65 | I/II | Unknown | Unknown | SD |
| FAM32A | SNV | Missense_Mutation | c.182N>T | p.Ala61Val | p.A61V | Q9Y421 | protein_coding | deleterious(0.01) | probably_damaging(0.984) | TCGA-A6-6653-01 | Colorectum | colon adenocarcinoma | Male | >=65 | I/II | Unknown | Unknown | SD | |
| FAM32A | SNV | Missense_Mutation | novel | c.38A>C | p.Lys13Thr | p.K13T | Q9Y421 | protein_coding | deleterious(0) | probably_damaging(0.961) | TCGA-AA-A00N-01 | Colorectum | colon adenocarcinoma | Male | >=65 | I/II | Unknown | Unknown | PD |
| FAM32A | SNV | Missense_Mutation | c.138G>T | p.Lys46Asn | p.K46N | Q9Y421 | protein_coding | tolerated(0.27) | probably_damaging(0.911) | TCGA-BS-A0UV-01 | Endometrium | uterine corpus endometrioid carcinoma | Female | <65 | III/IV | Unknown | Unknown | SD | |
| FAM32A | SNV | Missense_Mutation | novel | c.121N>G | p.Met41Val | p.M41V | Q9Y421 | protein_coding | tolerated(0.48) | benign(0.028) | TCGA-WX-AA44-01 | Liver | liver hepatocellular carcinoma | Female | <65 | I/II | Targeted Molecular therapy | sorafenib | PR |
| FAM32A | SNV | Missense_Mutation | c.332C>T | p.Thr111Met | p.T111M | Q9Y421 | protein_coding | deleterious(0.02) | benign(0.09) | TCGA-44-2657-01 | Lung | lung adenocarcinoma | Female | >=65 | I/II | Unknown | Unknown | SD | |
| FAM32A | SNV | Missense_Mutation | novel | c.305N>G | p.His102Arg | p.H102R | Q9Y421 | protein_coding | deleterious(0) | benign(0.029) | TCGA-VQ-A8E3-01 | Stomach | stomach adenocarcinoma | Male | >=65 | I/II | Unknown | Unknown | PD |
| Page: 1 |
Top |
Related drugs of malignant transformation related genes |
| Identification of chemicals and drugs interact with genes involved in malignant transfromation |
| (DGIdb 4.0) |
| Entrez ID | Symbol | Category | Interaction Types | Drug Claim Name | Drug Name | PMIDs |
| Page: 1 |

Copyright 2023-Present -The University of Texas Health Science Center at Houston |