
|
|||||
|
 | |
| |
| |
| |
| |
| |
|
Gene: FAM234A |
Gene summary for FAM234A |
| Gene information | Species | Human | Gene symbol | FAM234A | Gene ID | 83986 |
| Gene name | family with sequence similarity 234 member A | |
| Gene Alias | C16orf9 | |
| Cytomap | 16p13.3 | |
| Gene Type | protein-coding | GO ID | GO:0008150 | UniProtAcc | Q9H0X4 |
Top |
Malignant transformation analysis |
| Identification of the aberrant gene expression in precancerous and cancerous lesions by comparing the gene expression of stem-like cells in diseased tissues with normal stem cells |
| Entrez ID | Symbol | Replicates | Species | Organ | Tissue | Adj P-value | Log2FC | Malignancy |
| 83986 | FAM234A | HCC1 | Human | Liver | HCC | 7.50e-10 | 4.27e+00 | 0.5336 |
| 83986 | FAM234A | HCC2 | Human | Liver | HCC | 1.20e-18 | 3.63e+00 | 0.5341 |
| 83986 | FAM234A | S014 | Human | Liver | HCC | 2.63e-10 | 4.55e-01 | 0.2254 |
| 83986 | FAM234A | S015 | Human | Liver | HCC | 3.05e-06 | 4.06e-01 | 0.2375 |
| 83986 | FAM234A | S016 | Human | Liver | HCC | 7.12e-08 | 3.24e-01 | 0.2243 |
| 83986 | FAM234A | S027 | Human | Liver | HCC | 4.45e-03 | 4.33e-01 | 0.2446 |
| 83986 | FAM234A | S028 | Human | Liver | HCC | 4.39e-15 | 5.81e-01 | 0.2503 |
| 83986 | FAM234A | S029 | Human | Liver | HCC | 6.65e-11 | 5.00e-01 | 0.2581 |
| 83986 | FAM234A | C04 | Human | Oral cavity | OSCC | 1.46e-11 | 7.14e-01 | 0.2633 |
| 83986 | FAM234A | C21 | Human | Oral cavity | OSCC | 6.21e-43 | 1.15e+00 | 0.2678 |
| 83986 | FAM234A | C30 | Human | Oral cavity | OSCC | 6.11e-34 | 1.34e+00 | 0.3055 |
| 83986 | FAM234A | C38 | Human | Oral cavity | OSCC | 7.03e-05 | 8.84e-01 | 0.172 |
| 83986 | FAM234A | C43 | Human | Oral cavity | OSCC | 1.38e-54 | 9.73e-01 | 0.1704 |
| 83986 | FAM234A | C46 | Human | Oral cavity | OSCC | 5.27e-21 | 5.25e-01 | 0.1673 |
| 83986 | FAM234A | C51 | Human | Oral cavity | OSCC | 1.32e-15 | 9.09e-01 | 0.2674 |
| 83986 | FAM234A | C57 | Human | Oral cavity | OSCC | 2.24e-09 | 4.97e-01 | 0.1679 |
| 83986 | FAM234A | C06 | Human | Oral cavity | OSCC | 5.52e-12 | 1.36e+00 | 0.2699 |
| 83986 | FAM234A | C08 | Human | Oral cavity | OSCC | 3.68e-38 | 7.27e-01 | 0.1919 |
| 83986 | FAM234A | LN22 | Human | Oral cavity | OSCC | 1.43e-02 | 6.46e-01 | 0.1733 |
| 83986 | FAM234A | LN46 | Human | Oral cavity | OSCC | 2.23e-05 | 3.79e-01 | 0.1666 |
| Page: 1 2 3 4 5 6 |
| Tissue | Expression Dynamics | Abbreviation |
| Colorectum (GSE201348) |  | FAP: Familial adenomatous polyposis |
| CRC: Colorectal cancer | ||
| Colorectum (HTA11) | 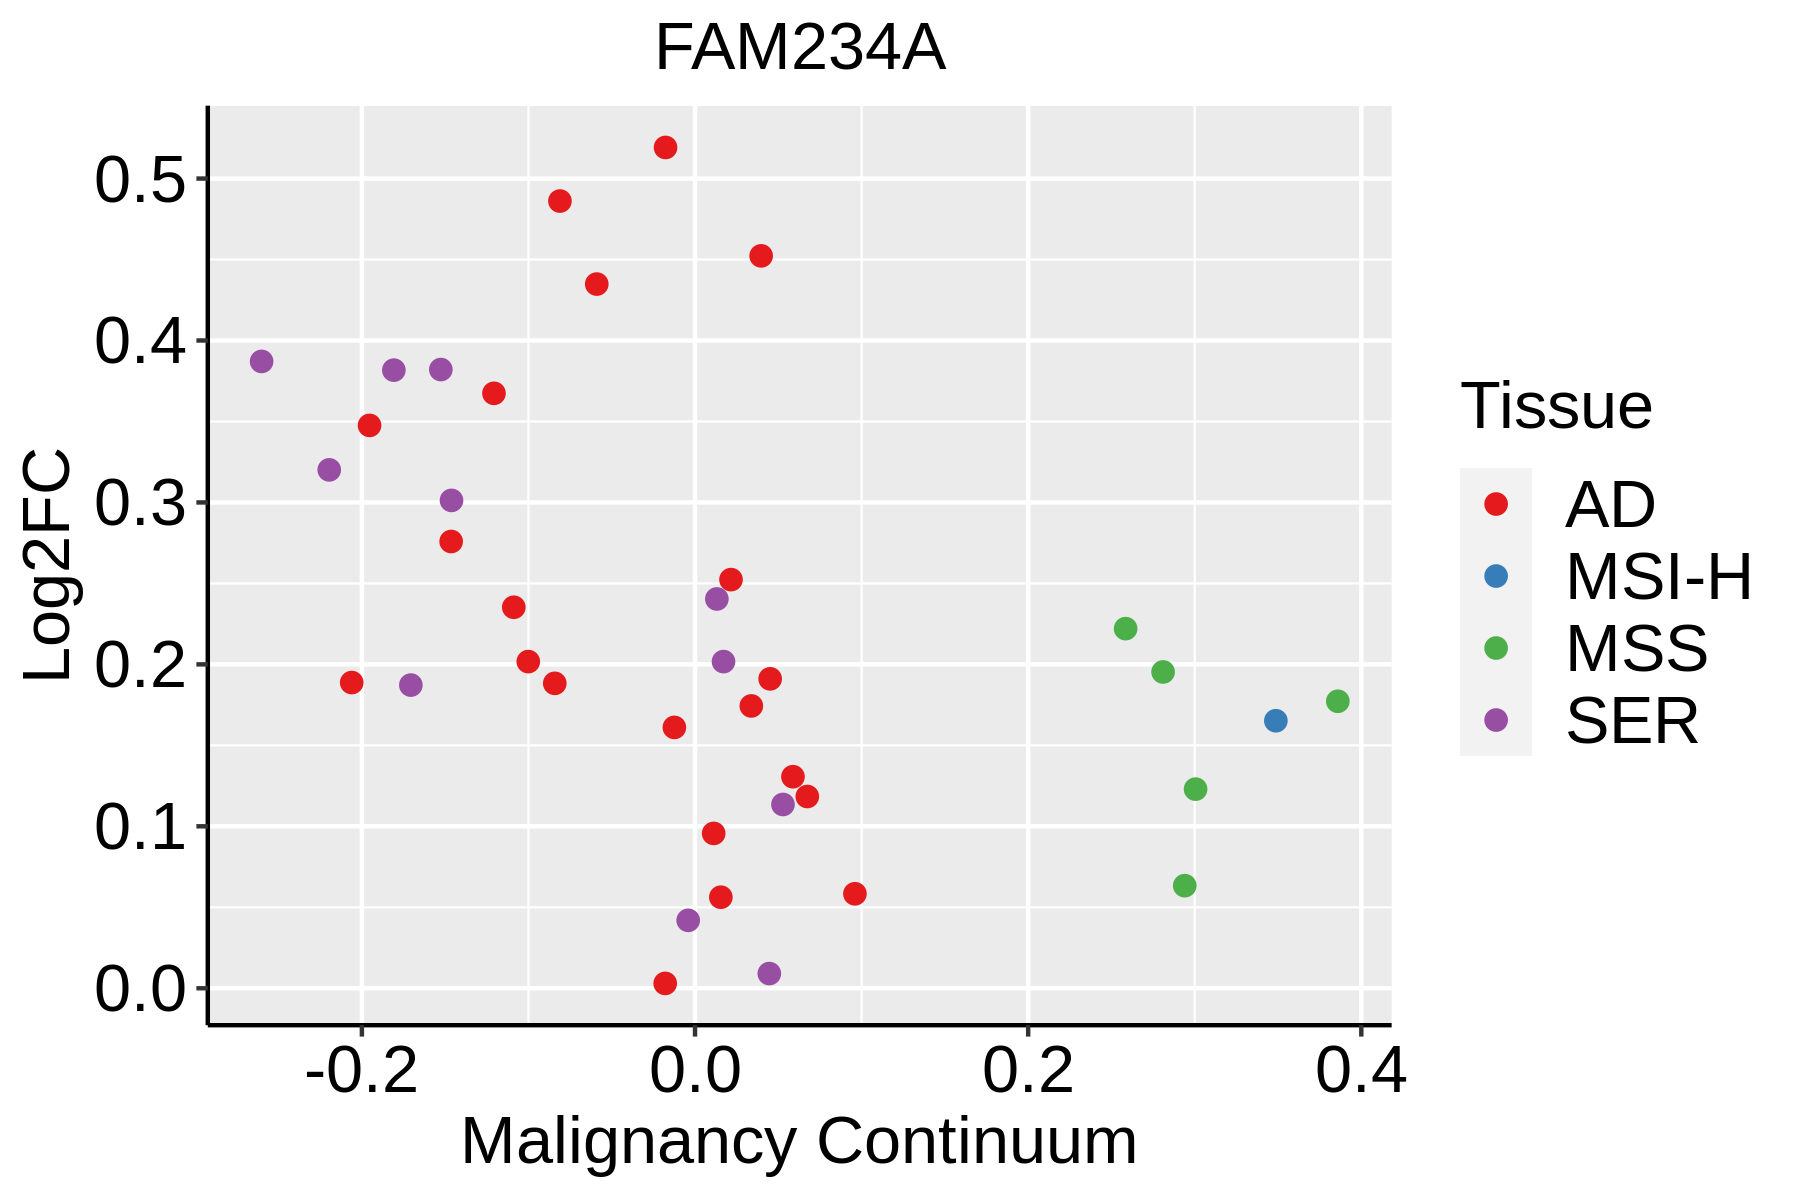 | AD: Adenomas |
| SER: Sessile serrated lesions | ||
| MSI-H: Microsatellite-high colorectal cancer | ||
| MSS: Microsatellite stable colorectal cancer | ||
| Esophagus | 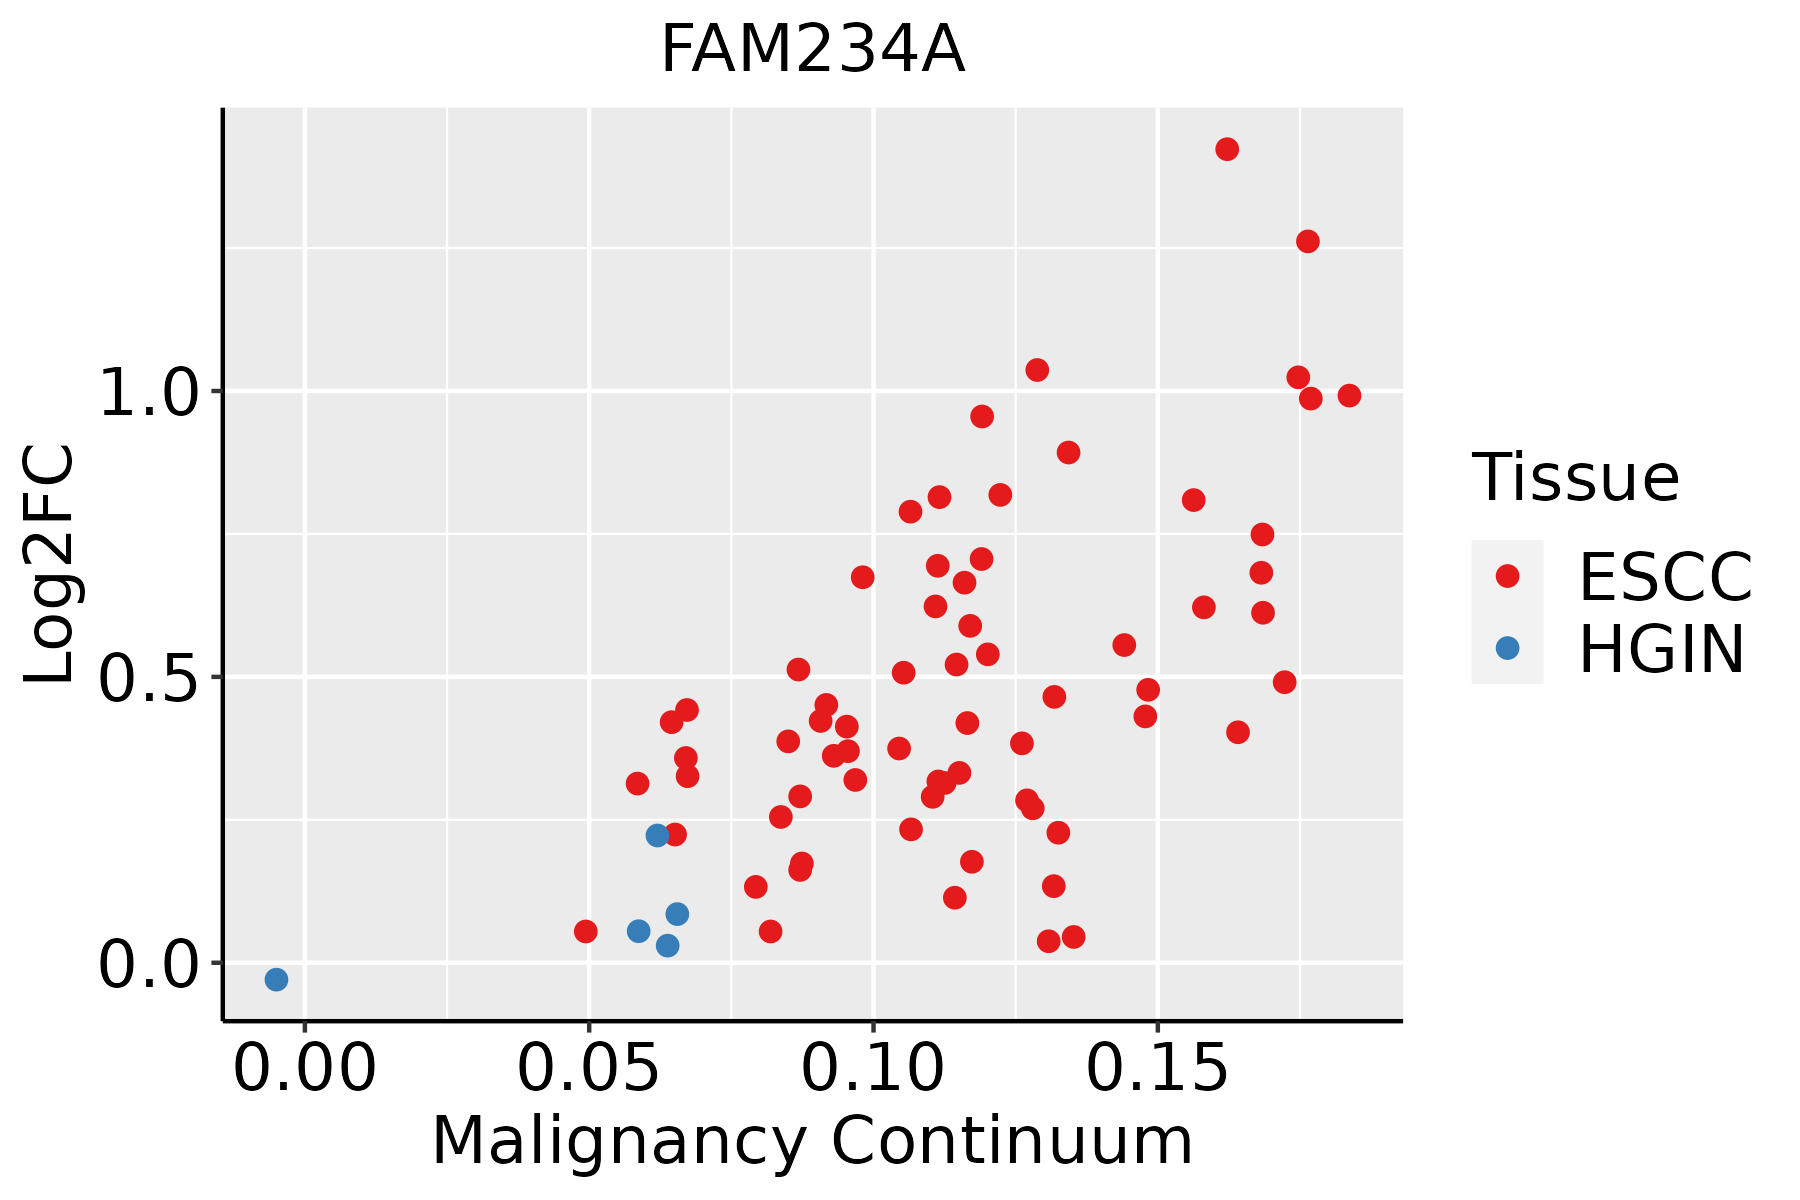 | ESCC: Esophageal squamous cell carcinoma |
| HGIN: High-grade intraepithelial neoplasias | ||
| LGIN: Low-grade intraepithelial neoplasias | ||
| Liver |  | HCC: Hepatocellular carcinoma |
| NAFLD: Non-alcoholic fatty liver disease | ||
| Oral Cavity | 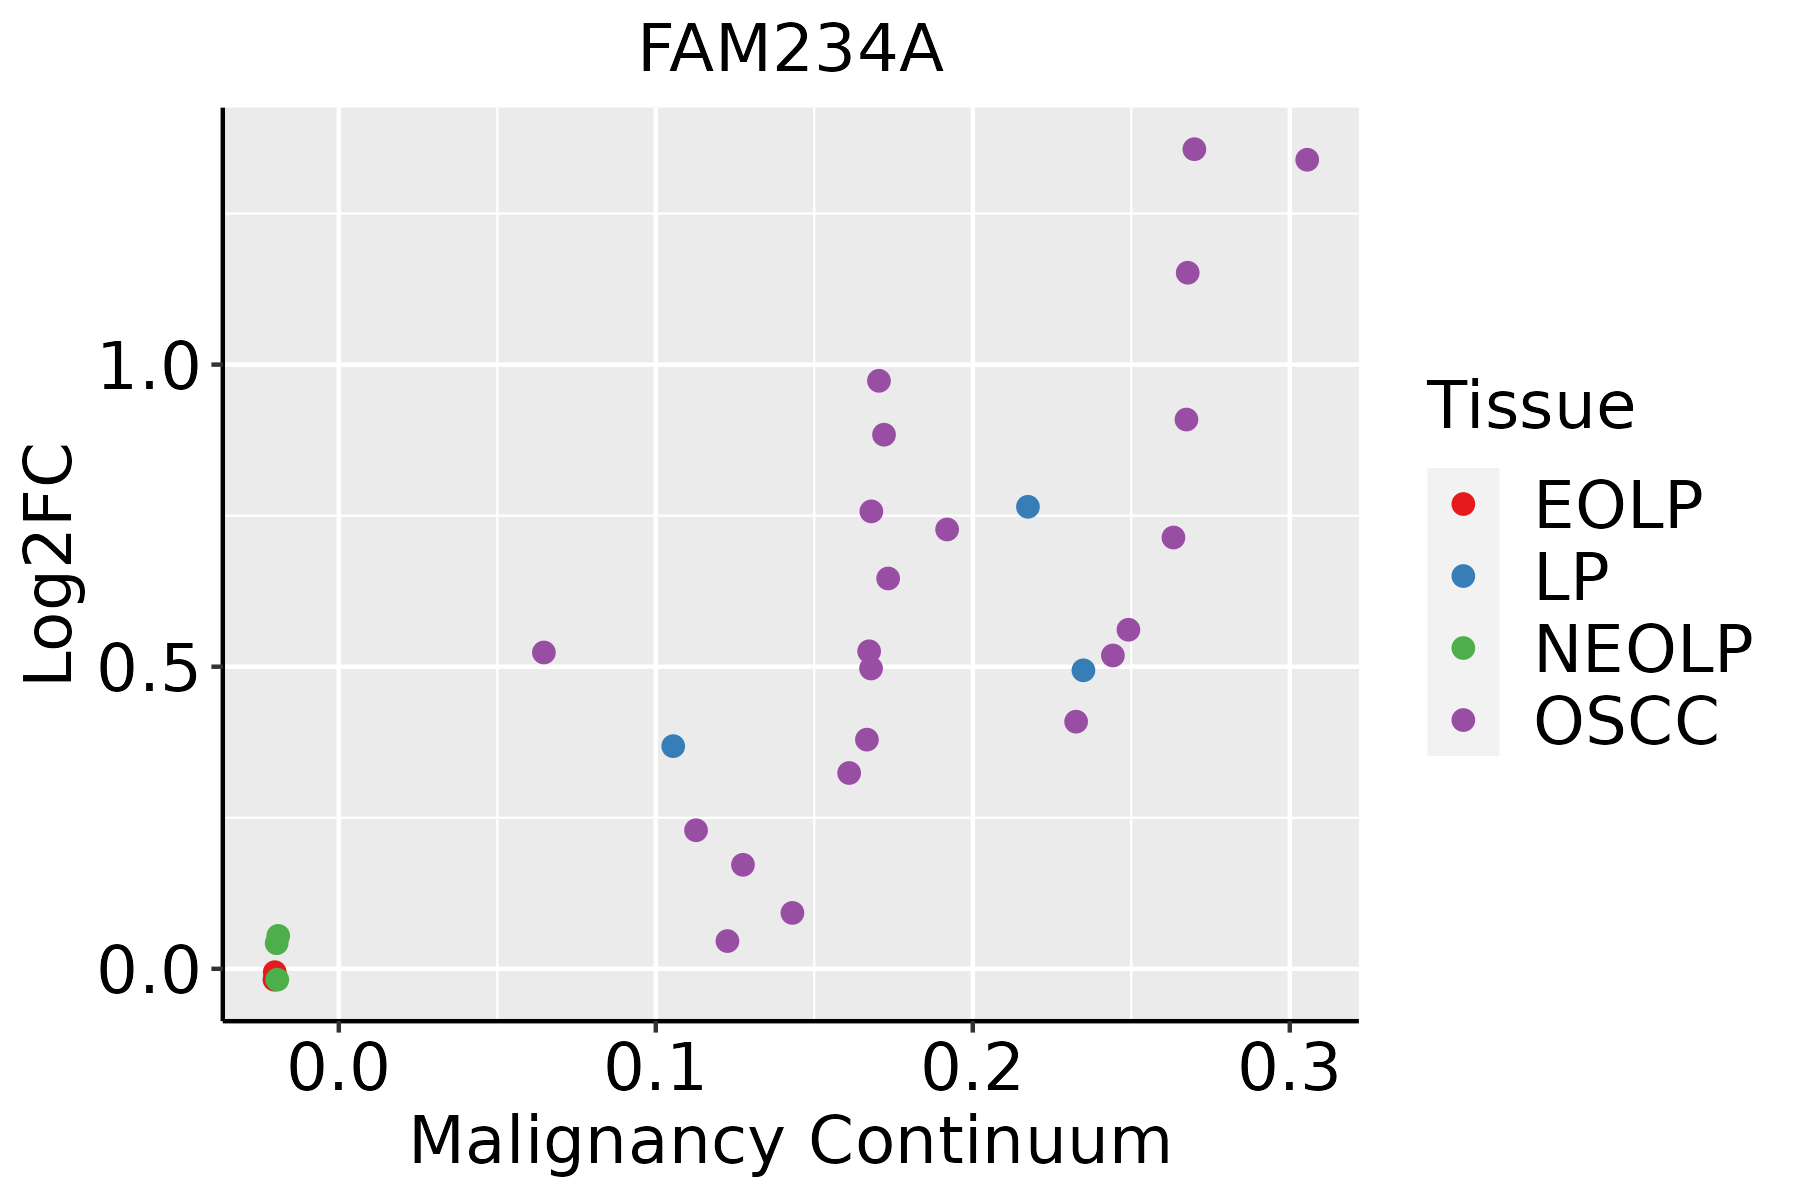 | EOLP: Erosive Oral lichen planus |
| LP: leukoplakia | ||
| NEOLP: Non-erosive oral lichen planus | ||
| OSCC: Oral squamous cell carcinoma | ||
| Thyroid |  | ATC: Anaplastic thyroid cancer |
| HT: Hashimoto's thyroiditis | ||
| PTC: Papillary thyroid cancer |
| ∗log2FC in expression of this searched gene in stem-like cells from each diseased tissue sample relative to stem-like cells in normal samples in each tissue plotted against the malignancy continuum. Samples are colored based on if they are from different disease stage. |
Top |
Malignant transformation related pathway analysis |
| Find out the enriched GO biological processes and KEGG pathways involved in transition from healthy to precancer to cancer |
| Tissue | Disease Stage | Enriched GO biological Processes |
| Colorectum | AD |  |
| Colorectum | SER |  |
| Colorectum | MSS |  |
| Colorectum | MSI-H |  |
| Colorectum | FAP |  |
| ∗Top 15 enriched GO BP terms are showed in the bar plot of each disease state in each tissue. Each row represents a significant GO biological process which is colored according to the -log10(p.adjust). |
| Page: 1 2 3 4 5 6 7 8 9 |
| GO ID | Tissue | Disease Stage | Description | Gene Ratio | Bg Ratio | pvalue | p.adjust | Count |
| Page: 1 |
| Pathway ID | Tissue | Disease Stage | Description | Gene Ratio | Bg Ratio | pvalue | p.adjust | qvalue | Count |
| Page: 1 |
Top |
Cell-cell communication analysis |
| Identification of potential cell-cell interactions between two cell types and their ligand-receptor pairs for different disease states |
| Ligand | Receptor | LRpair | Pathway | Tissue | Disease Stage |
| Page: 1 |
Top |
Single-cell gene regulatory network inference analysis |
| Find out the significant the regulons (TFs) and the target genes of each regulon across cell types for different disease states |
| TF | Cell Type | Tissue | Disease Stage | Target Gene | RSS | Regulon Activity |
| ∗The dot plots of a searched regulon are shown for all cell subpopulations in each disease state of each tissue based on the regulon specific score inferred using pySCENIC and by calculating the average expression. |
| Page: 1 |
Top |
Somatic mutation of malignant transformation related genes |
| Annotation of somatic variants for genes involved in malignant transformation |
| Hugo Symbol | Variant Class | Variant Classification | dbSNP RS | HGVSc | HGVSp | HGVSp Short | SWISSPROT | BIOTYPE | SIFT | PolyPhen | Tumor Sample Barcode | Tissue | Histology | Sex | Age | Stage | Therapy Types | Drugs | Outcome |
| FAM234A | SNV | Missense_Mutation | rs758150908 | c.1282N>A | p.Ala428Thr | p.A428T | Q9H0X4 | protein_coding | deleterious(0) | benign(0.437) | TCGA-A7-A3RF-01 | Breast | breast invasive carcinoma | Female | >=65 | I/II | Hormone Therapy | anastrozole | PD |
| FAM234A | SNV | Missense_Mutation | c.331C>G | p.Leu111Val | p.L111V | Q9H0X4 | protein_coding | tolerated(0.22) | benign(0.203) | TCGA-EW-A1J5-01 | Breast | breast invasive carcinoma | Female | <65 | I/II | Chemotherapy | adriamycin | SD | |
| FAM234A | deletion | Frame_Shift_Del | novel | c.1473_1474delNN | p.Ala492ArgfsTer38 | p.A492Rfs*38 | Q9H0X4 | protein_coding | TCGA-A2-A25F-01 | Breast | breast invasive carcinoma | Female | >=65 | I/II | Chemotherapy | taxotere | SD | ||
| FAM234A | insertion | Frame_Shift_Ins | novel | c.813_814insCATCT | p.Gly272HisfsTer20 | p.G272Hfs*20 | Q9H0X4 | protein_coding | TCGA-A8-A07J-01 | Breast | breast invasive carcinoma | Female | <65 | I/II | Chemotherapy | 5-fluorouracil | CR | ||
| FAM234A | insertion | In_Frame_Ins | novel | c.1059_1060insTCCCCAAGAATGGTGGAGTACACACTTCCCATTTGTGCT | p.Leu353_Asp354insSerProArgMetValGluTyrThrLeuProIleCysAla | p.L353_D354insSPRMVEYTLPICA | Q9H0X4 | protein_coding | TCGA-AO-A0JB-01 | Breast | breast invasive carcinoma | Female | <65 | III/IV | Chemotherapy | cyclophosphamide | SD | ||
| FAM234A | SNV | Missense_Mutation | novel | c.1617C>G | p.Ile539Met | p.I539M | Q9H0X4 | protein_coding | deleterious(0) | probably_damaging(0.923) | TCGA-C5-A1BQ-01 | Cervix | cervical & endocervical cancer | Female | >=65 | III/IV | Chemotherapy | cisplatin | CR |
| FAM234A | SNV | Missense_Mutation | novel | c.1617N>G | p.Ile539Met | p.I539M | Q9H0X4 | protein_coding | deleterious(0) | probably_damaging(0.923) | TCGA-C5-A3HL-01 | Cervix | cervical & endocervical cancer | Female | >=65 | I/II | Unknown | Unknown | SD |
| FAM234A | SNV | Missense_Mutation | c.481G>C | p.Glu161Gln | p.E161Q | Q9H0X4 | protein_coding | tolerated(0.44) | benign(0.007) | TCGA-EK-A3GK-01 | Cervix | cervical & endocervical cancer | Female | <65 | I/II | Unknown | Unknown | SD | |
| FAM234A | SNV | Missense_Mutation | c.1408N>C | p.Glu470Gln | p.E470Q | Q9H0X4 | protein_coding | deleterious(0.02) | possibly_damaging(0.903) | TCGA-IR-A3LK-01 | Cervix | cervical & endocervical cancer | Female | >=65 | I/II | Chemotherapy | cisplatin | PD | |
| FAM234A | SNV | Missense_Mutation | c.983N>C | p.Val328Ala | p.V328A | Q9H0X4 | protein_coding | tolerated(0.08) | benign(0.292) | TCGA-AY-6197-01 | Colorectum | colon adenocarcinoma | Male | <65 | I/II | Unknown | Unknown | SD |
| Page: 1 2 3 4 5 |
Top |
Related drugs of malignant transformation related genes |
| Identification of chemicals and drugs interact with genes involved in malignant transfromation |
| (DGIdb 4.0) |
| Entrez ID | Symbol | Category | Interaction Types | Drug Claim Name | Drug Name | PMIDs |
| Page: 1 |

Copyright 2023-Present -The University of Texas Health Science Center at Houston |