
|
|||||
|
 | |
| |
| |
| |
| |
| |
|
Gene: FAM120A |
Gene summary for FAM120A |
| Gene information | Species | Human | Gene symbol | FAM120A | Gene ID | 23196 |
| Gene name | family with sequence similarity 120A | |
| Gene Alias | C9orf10 | |
| Cytomap | 9q22.31 | |
| Gene Type | protein-coding | GO ID | GO:0005575 | UniProtAcc | Q9NZB2 |
Top |
Malignant transformation analysis |
| Identification of the aberrant gene expression in precancerous and cancerous lesions by comparing the gene expression of stem-like cells in diseased tissues with normal stem cells |
| Entrez ID | Symbol | Replicates | Species | Organ | Tissue | Adj P-value | Log2FC | Malignancy |
| 23196 | FAM120A | P39T-E | Human | Esophagus | ESCC | 2.26e-12 | 2.22e-02 | 0.0894 |
| 23196 | FAM120A | P40T-E | Human | Esophagus | ESCC | 1.16e-08 | 2.41e-01 | 0.109 |
| 23196 | FAM120A | P42T-E | Human | Esophagus | ESCC | 6.55e-21 | 3.67e-01 | 0.1175 |
| 23196 | FAM120A | P44T-E | Human | Esophagus | ESCC | 2.87e-07 | 8.86e-02 | 0.1096 |
| 23196 | FAM120A | P47T-E | Human | Esophagus | ESCC | 3.98e-14 | 1.37e-01 | 0.1067 |
| 23196 | FAM120A | P48T-E | Human | Esophagus | ESCC | 6.50e-11 | 2.95e-01 | 0.0959 |
| 23196 | FAM120A | P49T-E | Human | Esophagus | ESCC | 5.34e-09 | 8.64e-01 | 0.1768 |
| 23196 | FAM120A | P52T-E | Human | Esophagus | ESCC | 2.21e-17 | 4.51e-01 | 0.1555 |
| 23196 | FAM120A | P54T-E | Human | Esophagus | ESCC | 1.56e-17 | 3.86e-01 | 0.0975 |
| 23196 | FAM120A | P57T-E | Human | Esophagus | ESCC | 9.99e-13 | 5.92e-02 | 0.0926 |
| 23196 | FAM120A | P61T-E | Human | Esophagus | ESCC | 1.75e-05 | 5.98e-02 | 0.099 |
| 23196 | FAM120A | P62T-E | Human | Esophagus | ESCC | 1.90e-26 | 5.93e-01 | 0.1302 |
| 23196 | FAM120A | P65T-E | Human | Esophagus | ESCC | 6.89e-11 | 6.66e-02 | 0.0978 |
| 23196 | FAM120A | P74T-E | Human | Esophagus | ESCC | 1.45e-24 | 7.35e-01 | 0.1479 |
| 23196 | FAM120A | P75T-E | Human | Esophagus | ESCC | 2.08e-27 | 6.22e-01 | 0.1125 |
| 23196 | FAM120A | P76T-E | Human | Esophagus | ESCC | 8.26e-08 | 4.30e-02 | 0.1207 |
| 23196 | FAM120A | P79T-E | Human | Esophagus | ESCC | 3.21e-12 | 1.14e-01 | 0.1154 |
| 23196 | FAM120A | P80T-E | Human | Esophagus | ESCC | 2.02e-26 | 1.00e+00 | 0.155 |
| 23196 | FAM120A | P82T-E | Human | Esophagus | ESCC | 1.85e-06 | 5.12e-01 | 0.1072 |
| 23196 | FAM120A | P83T-E | Human | Esophagus | ESCC | 1.62e-11 | 4.95e-01 | 0.1738 |
| Page: 1 2 3 4 5 6 7 8 9 |
| Tissue | Expression Dynamics | Abbreviation |
| Cervix | 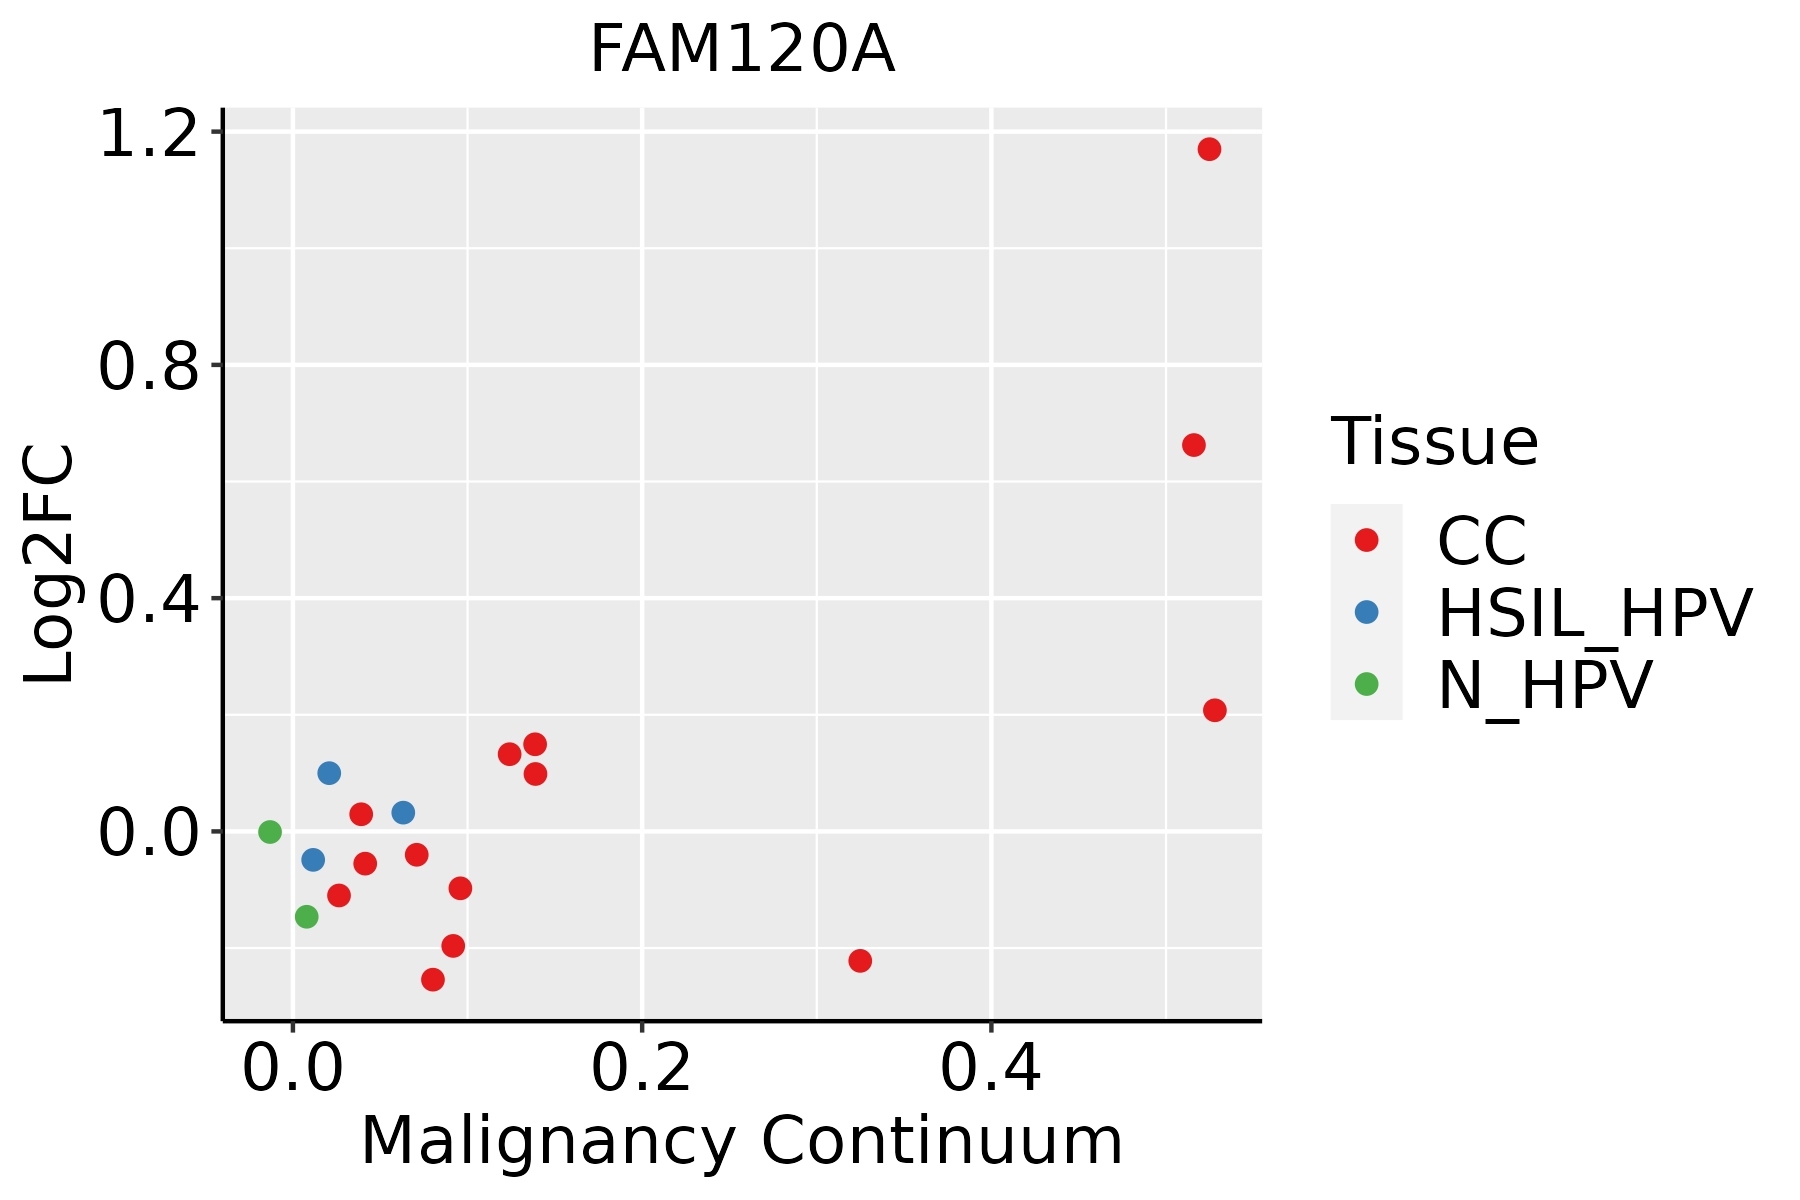 | CC: Cervix cancer |
| HSIL_HPV: HPV-infected high-grade squamous intraepithelial lesions | ||
| N_HPV: HPV-infected normal cervix | ||
| Colorectum (GSE201348) |  | FAP: Familial adenomatous polyposis |
| CRC: Colorectal cancer | ||
| Colorectum (HTA11) |  | AD: Adenomas |
| SER: Sessile serrated lesions | ||
| MSI-H: Microsatellite-high colorectal cancer | ||
| MSS: Microsatellite stable colorectal cancer | ||
| Esophagus | 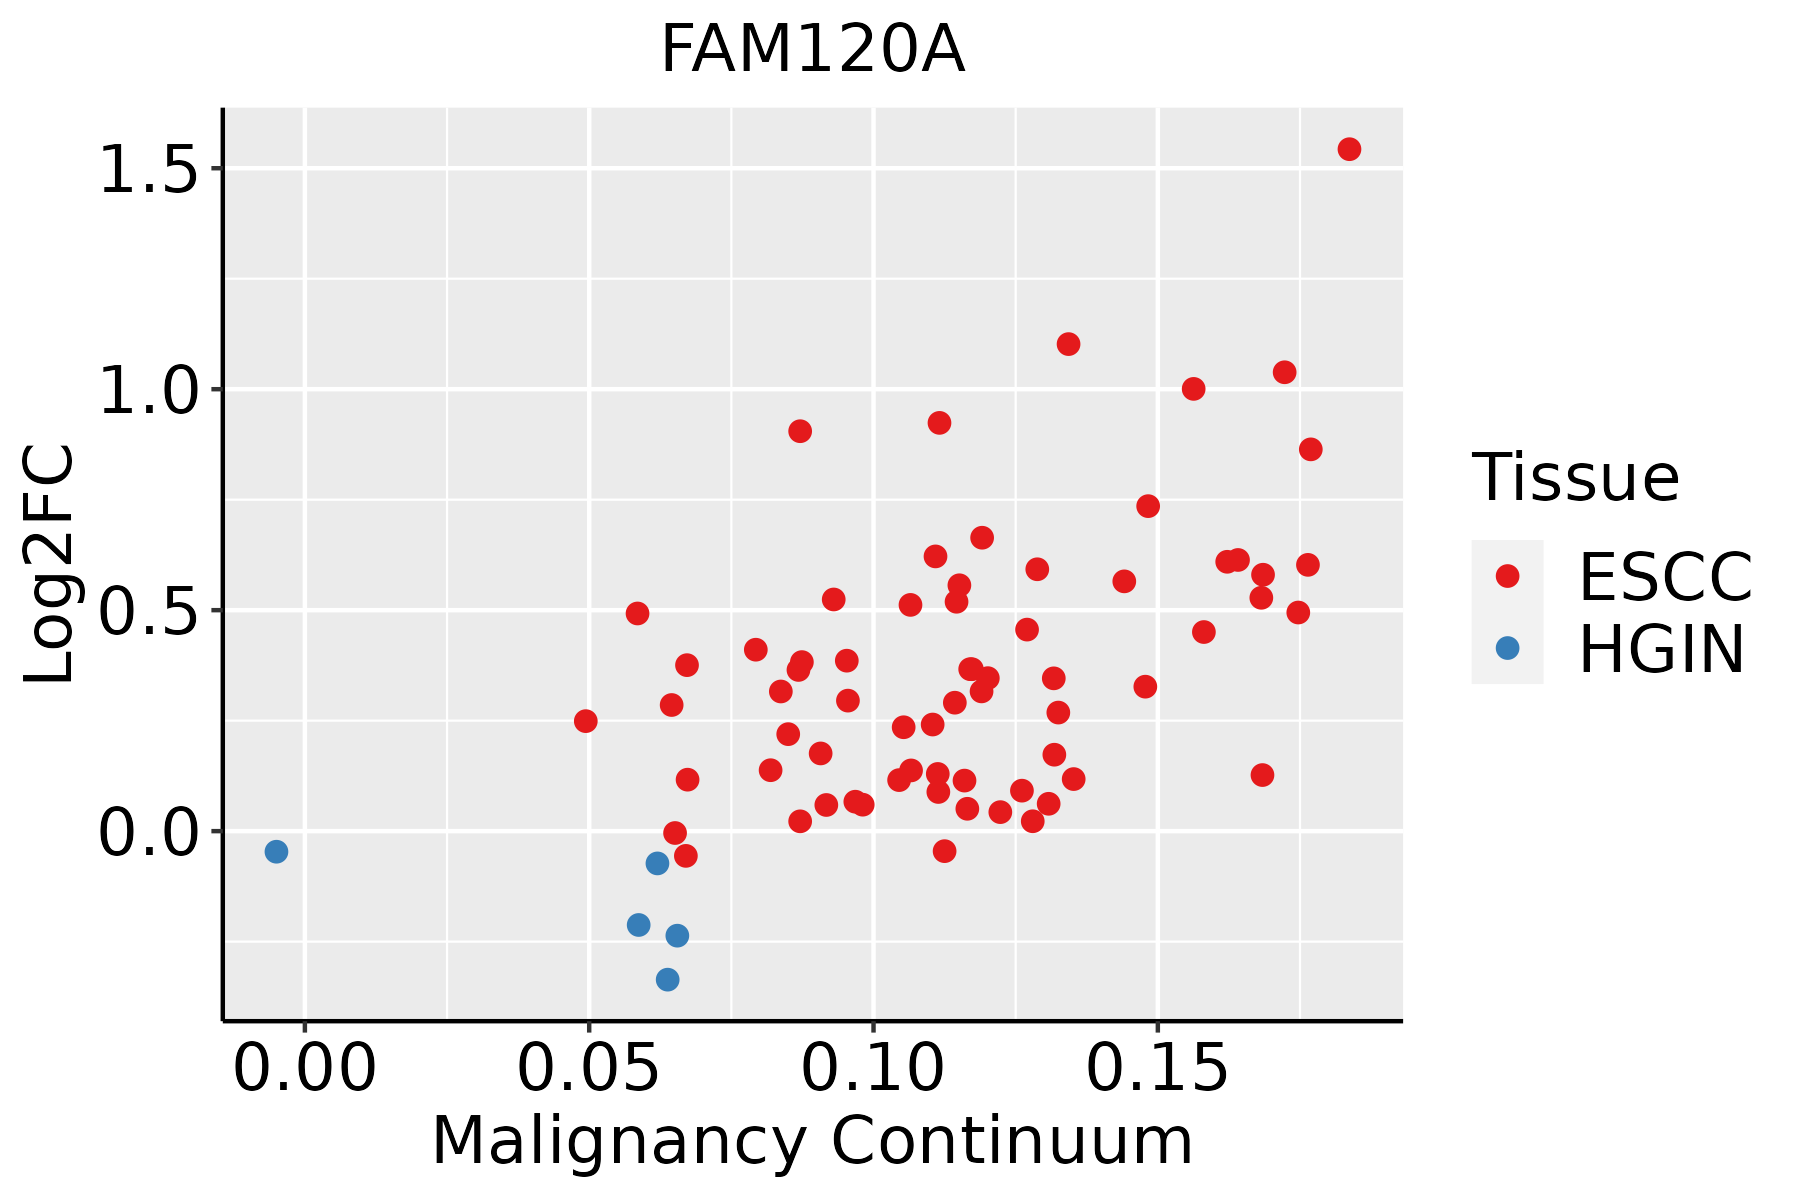 | ESCC: Esophageal squamous cell carcinoma |
| HGIN: High-grade intraepithelial neoplasias | ||
| LGIN: Low-grade intraepithelial neoplasias | ||
| Liver | 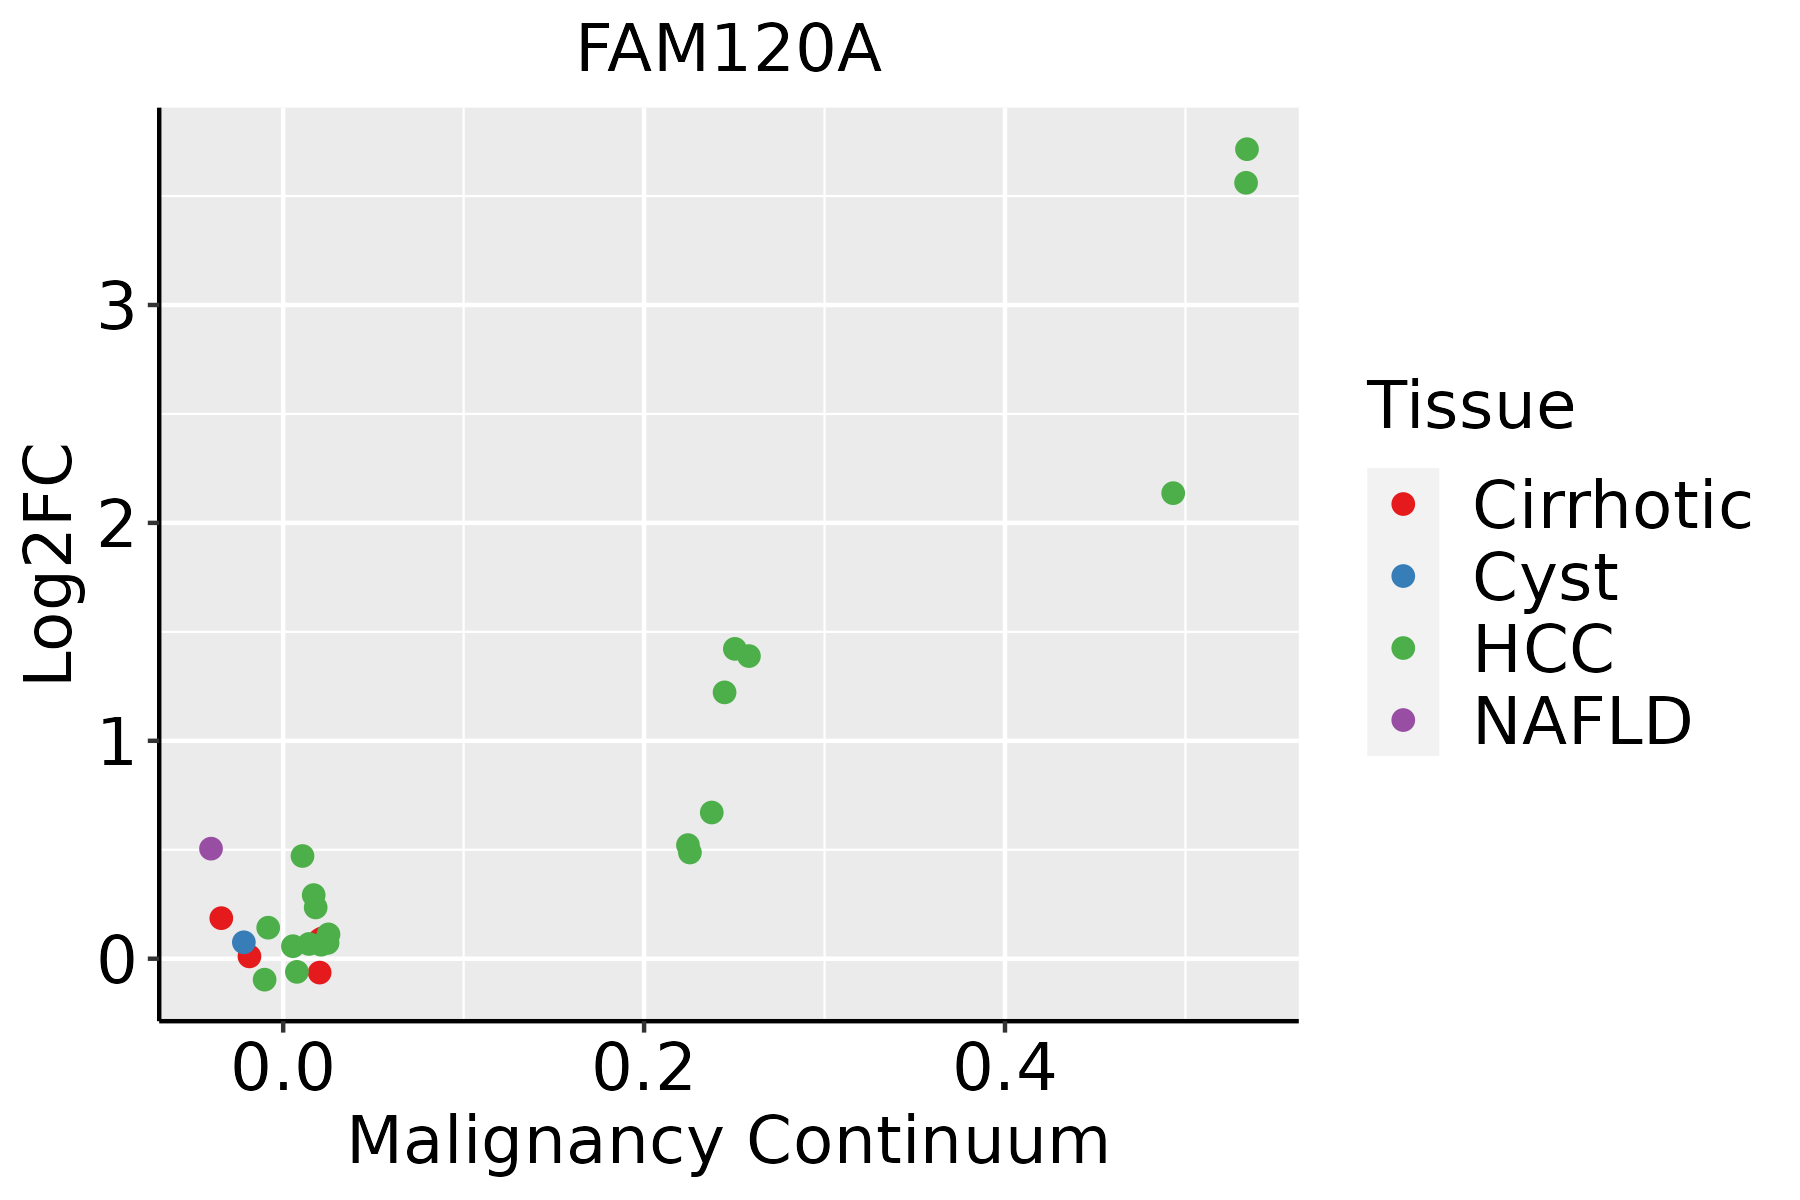 | HCC: Hepatocellular carcinoma |
| NAFLD: Non-alcoholic fatty liver disease | ||
| Oral Cavity | 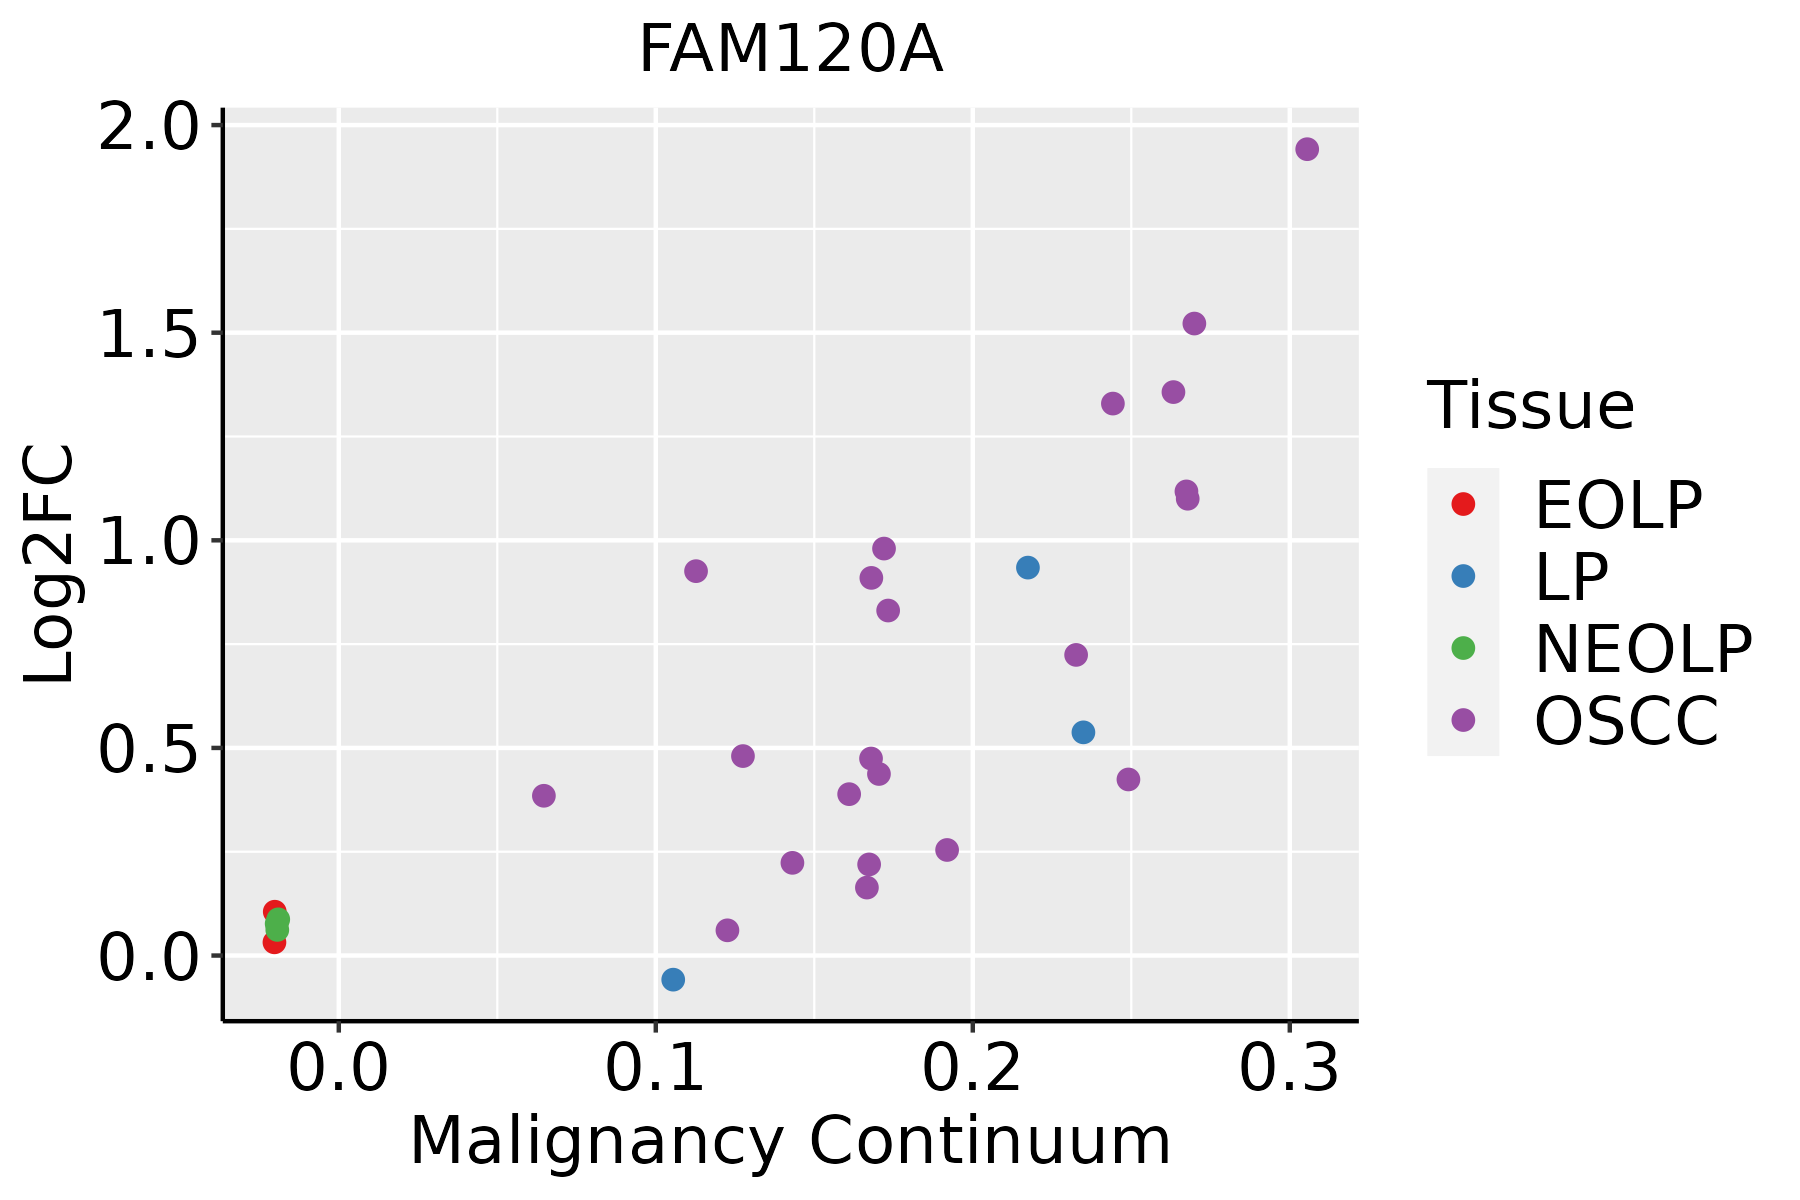 | EOLP: Erosive Oral lichen planus |
| LP: leukoplakia | ||
| NEOLP: Non-erosive oral lichen planus | ||
| OSCC: Oral squamous cell carcinoma | ||
| Prostate | 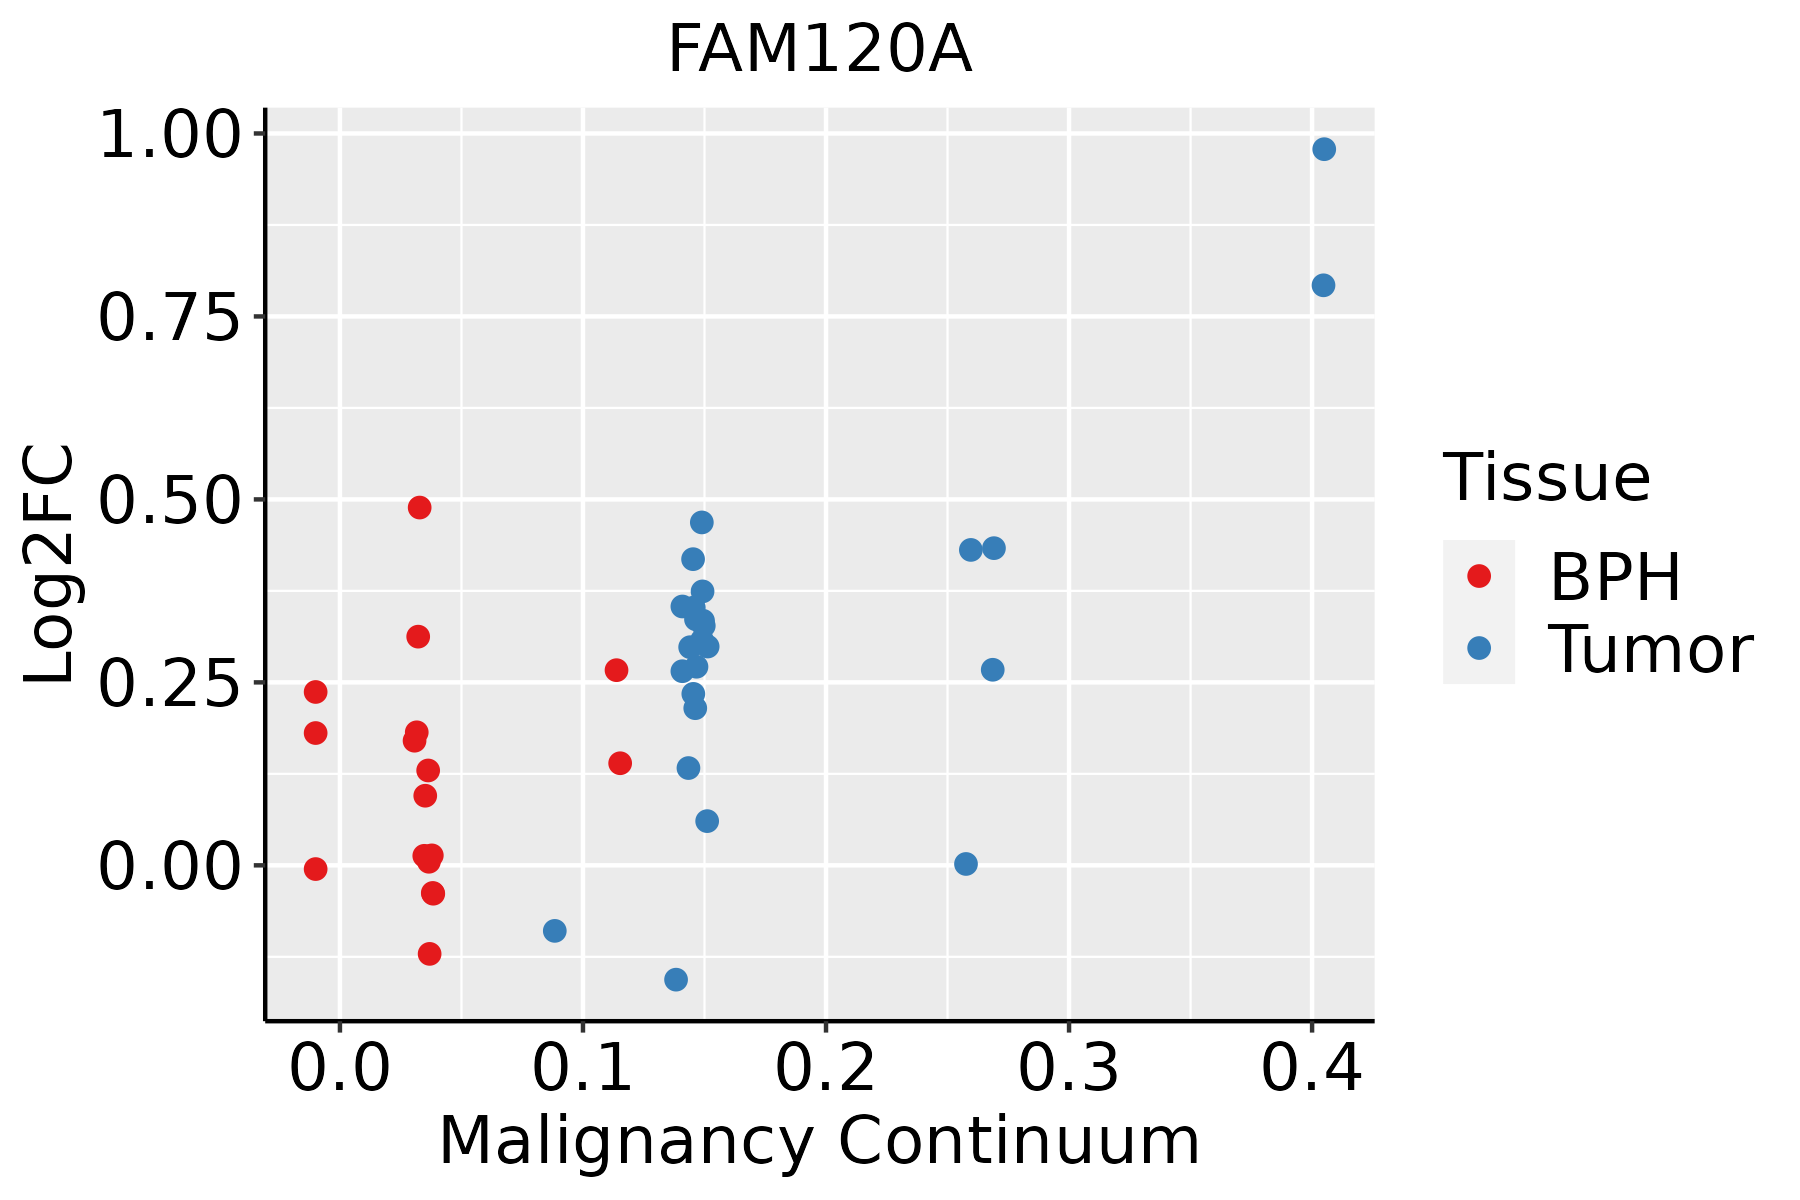 | BPH: Benign Prostatic Hyperplasia |
| Skin |  | AK: Actinic keratosis |
| cSCC: Cutaneous squamous cell carcinoma | ||
| SCCIS:squamous cell carcinoma in situ | ||
| Thyroid | 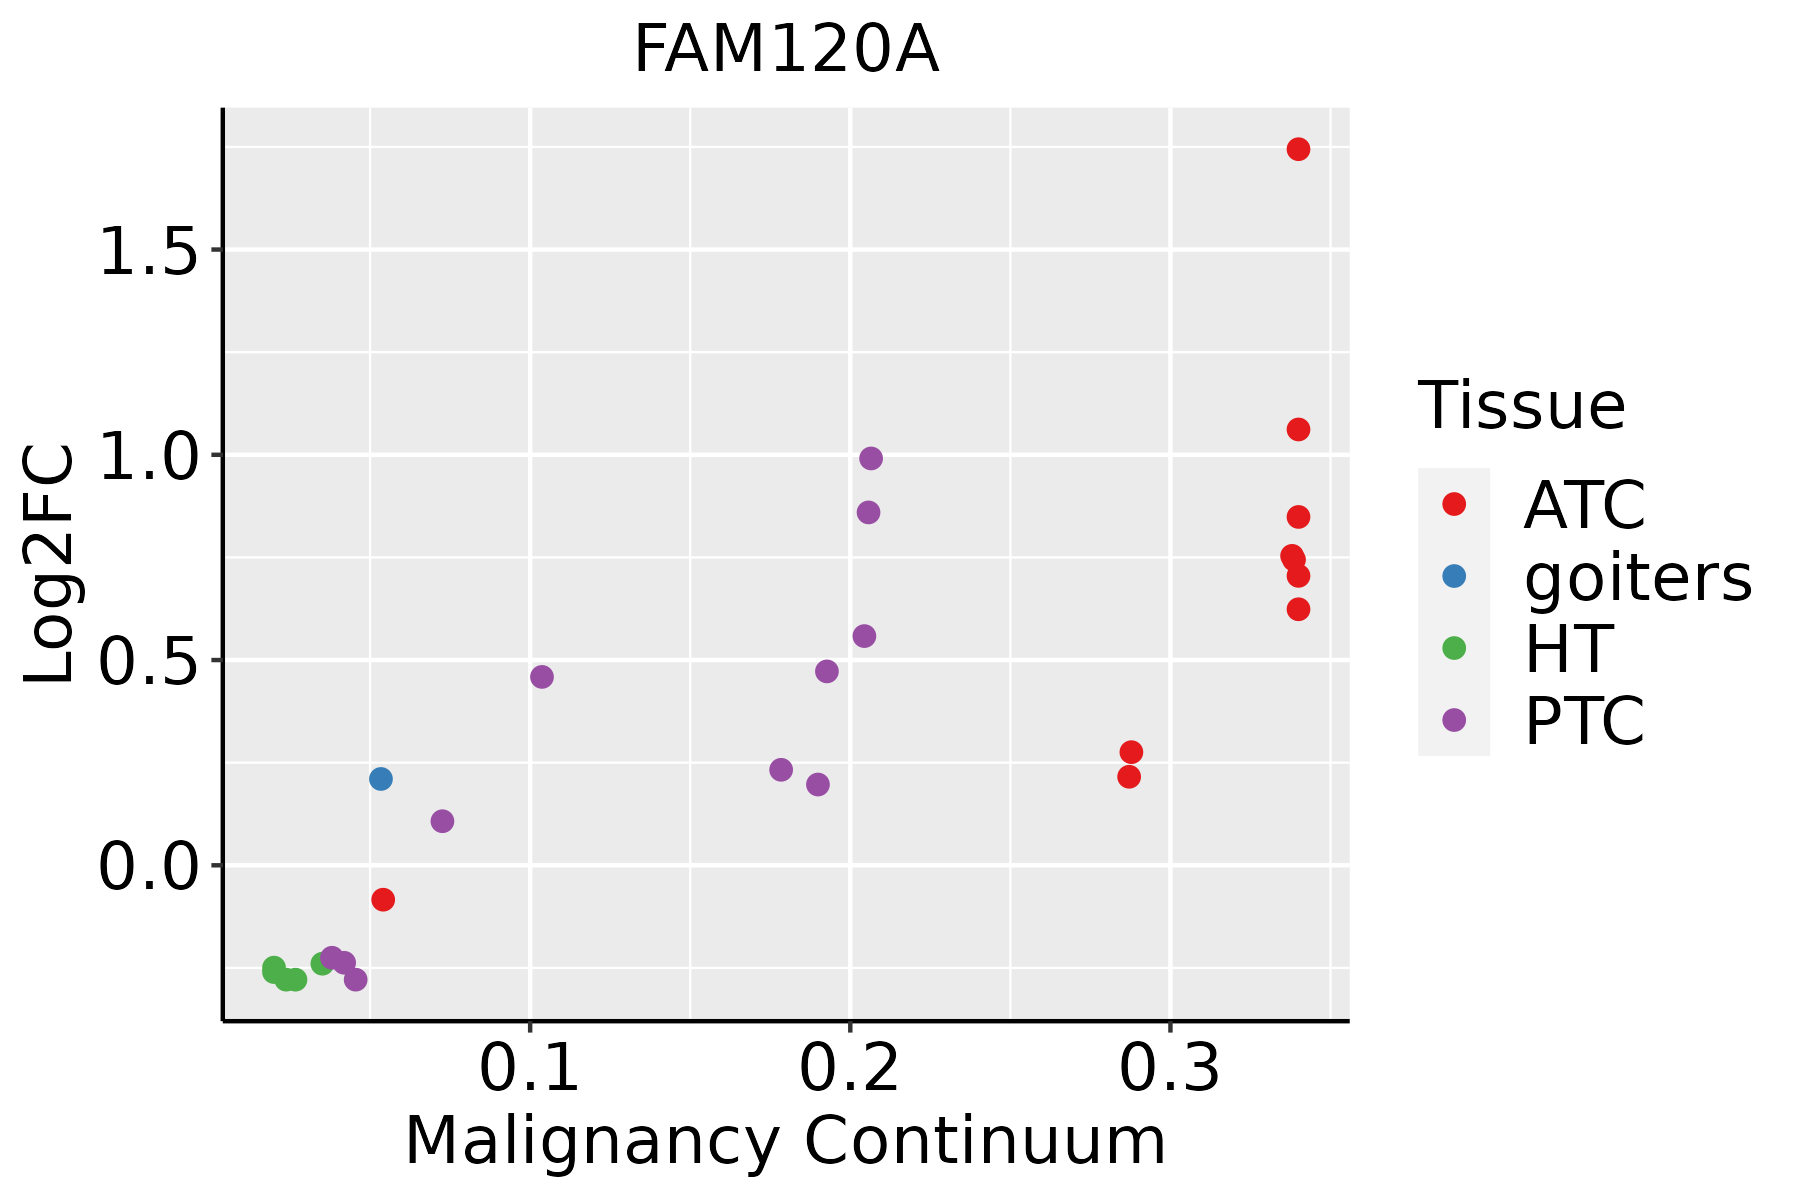 | ATC: Anaplastic thyroid cancer |
| HT: Hashimoto's thyroiditis | ||
| PTC: Papillary thyroid cancer |
| ∗log2FC in expression of this searched gene in stem-like cells from each diseased tissue sample relative to stem-like cells in normal samples in each tissue plotted against the malignancy continuum. Samples are colored based on if they are from different disease stage. |
Top |
Malignant transformation related pathway analysis |
| Find out the enriched GO biological processes and KEGG pathways involved in transition from healthy to precancer to cancer |
| Tissue | Disease Stage | Enriched GO biological Processes |
| Colorectum | AD |  |
| Colorectum | SER |  |
| Colorectum | MSS |  |
| Colorectum | MSI-H |  |
| Colorectum | FAP |  |
| ∗Top 15 enriched GO BP terms are showed in the bar plot of each disease state in each tissue. Each row represents a significant GO biological process which is colored according to the -log10(p.adjust). |
| Page: 1 2 3 4 5 6 7 8 9 |
| GO ID | Tissue | Disease Stage | Description | Gene Ratio | Bg Ratio | pvalue | p.adjust | Count |
| Page: 1 |
| Pathway ID | Tissue | Disease Stage | Description | Gene Ratio | Bg Ratio | pvalue | p.adjust | qvalue | Count |
| Page: 1 |
Top |
Cell-cell communication analysis |
| Identification of potential cell-cell interactions between two cell types and their ligand-receptor pairs for different disease states |
| Ligand | Receptor | LRpair | Pathway | Tissue | Disease Stage |
| Page: 1 |
Top |
Single-cell gene regulatory network inference analysis |
| Find out the significant the regulons (TFs) and the target genes of each regulon across cell types for different disease states |
| TF | Cell Type | Tissue | Disease Stage | Target Gene | RSS | Regulon Activity |
| ∗The dot plots of a searched regulon are shown for all cell subpopulations in each disease state of each tissue based on the regulon specific score inferred using pySCENIC and by calculating the average expression. |
| Page: 1 |
Top |
Somatic mutation of malignant transformation related genes |
| Annotation of somatic variants for genes involved in malignant transformation |
| Hugo Symbol | Variant Class | Variant Classification | dbSNP RS | HGVSc | HGVSp | HGVSp Short | SWISSPROT | BIOTYPE | SIFT | PolyPhen | Tumor Sample Barcode | Tissue | Histology | Sex | Age | Stage | Therapy Types | Drugs | Outcome |
| FAM120A | SNV | Missense_Mutation | novel | c.1193N>G | p.Ser398Cys | p.S398C | Q9NZB2 | protein_coding | deleterious(0.03) | benign(0.223) | TCGA-3C-AALI-01 | Breast | breast invasive carcinoma | Female | <65 | I/II | Unspecific | Poly E | Complete Response |
| FAM120A | SNV | Missense_Mutation | c.1828N>C | p.Tyr610His | p.Y610H | Q9NZB2 | protein_coding | deleterious(0) | probably_damaging(1) | TCGA-BH-A18G-01 | Breast | breast invasive carcinoma | Female | >=65 | I/II | Unknown | Unknown | SD | |
| FAM120A | SNV | Missense_Mutation | c.791N>C | p.Leu264Pro | p.L264P | Q9NZB2 | protein_coding | deleterious(0) | probably_damaging(0.999) | TCGA-E2-A1IF-01 | Breast | breast invasive carcinoma | Female | >=65 | I/II | Hormone Therapy | arimidex | SD | |
| FAM120A | SNV | Missense_Mutation | c.760N>T | p.His254Tyr | p.H254Y | Q9NZB2 | protein_coding | tolerated(0.26) | probably_damaging(0.986) | TCGA-EW-A1J5-01 | Breast | breast invasive carcinoma | Female | <65 | I/II | Chemotherapy | adriamycin | SD | |
| FAM120A | SNV | Missense_Mutation | c.1012N>T | p.His338Tyr | p.H338Y | Q9NZB2 | protein_coding | tolerated(1) | benign(0.359) | TCGA-EW-A1J5-01 | Breast | breast invasive carcinoma | Female | <65 | I/II | Chemotherapy | adriamycin | SD | |
| FAM120A | insertion | Nonsense_Mutation | novel | c.2963_2964insGAGTGTTCAGTTTTGACACTCTTTCTGT | p.Ile989SerfsTer5 | p.I989Sfs*5 | Q9NZB2 | protein_coding | TCGA-A8-A07R-01 | Breast | breast invasive carcinoma | Female | >=65 | III/IV | Ancillary | zoledronic | SD | ||
| FAM120A | insertion | Frame_Shift_Ins | novel | c.1480_1481insAACT | p.Arg494GlnfsTer62 | p.R494Qfs*62 | Q9NZB2 | protein_coding | TCGA-A8-A09D-01 | Breast | breast invasive carcinoma | Female | <65 | I/II | Chemotherapy | doxorubicin | CR | ||
| FAM120A | insertion | Nonsense_Mutation | novel | c.1481_1482insTCTGTAGCGTCGGCTCGGCTCTGCTGTGGTAGC | p.Arg494_Gly495insLeuTerArgArgLeuGlySerAlaValValAla | p.R494_G495insL*RRLGSAVVA | Q9NZB2 | protein_coding | TCGA-A8-A09D-01 | Breast | breast invasive carcinoma | Female | <65 | I/II | Chemotherapy | doxorubicin | CR | ||
| FAM120A | insertion | In_Frame_Ins | novel | c.2897_2898insAATACTGGT | p.Gly966_Arg967insIleLeuVal | p.G966_R967insILV | Q9NZB2 | protein_coding | TCGA-A8-A0A4-01 | Breast | breast invasive carcinoma | Female | >=65 | I/II | Hormone Therapy | tamoxiphen | CR | ||
| FAM120A | insertion | Frame_Shift_Ins | novel | c.2899_2900insCCAGGACCATGGGCACA | p.Arg967ProfsTer33 | p.R967Pfs*33 | Q9NZB2 | protein_coding | TCGA-A8-A0A4-01 | Breast | breast invasive carcinoma | Female | >=65 | I/II | Hormone Therapy | tamoxiphen | CR |
| Page: 1 2 3 4 5 6 7 8 9 10 11 |
Top |
Related drugs of malignant transformation related genes |
| Identification of chemicals and drugs interact with genes involved in malignant transfromation |
| (DGIdb 4.0) |
| Entrez ID | Symbol | Category | Interaction Types | Drug Claim Name | Drug Name | PMIDs |
| Page: 1 |

Copyright 2023-Present -The University of Texas Health Science Center at Houston |