
|
|||||
|
 | |
| |
| |
| |
| |
| |
|
Gene: ELK4 |
Gene summary for ELK4 |
| Gene information | Species | Human | Gene symbol | ELK4 | Gene ID | 2005 |
| Gene name | ETS transcription factor ELK4 | |
| Gene Alias | SAP1 | |
| Cytomap | 1q32.1 | |
| Gene Type | protein-coding | GO ID | GO:0000122 | UniProtAcc | A0A024R9C2 |
Top |
Malignant transformation analysis |
| Identification of the aberrant gene expression in precancerous and cancerous lesions by comparing the gene expression of stem-like cells in diseased tissues with normal stem cells |
| Entrez ID | Symbol | Replicates | Species | Organ | Tissue | Adj P-value | Log2FC | Malignancy |
| 2005 | ELK4 | SYSMH1 | Human | Oral cavity | OSCC | 1.32e-10 | 3.74e-01 | 0.1127 |
| 2005 | ELK4 | SYSMH2 | Human | Oral cavity | OSCC | 9.92e-09 | 2.80e-01 | 0.2326 |
| 2005 | ELK4 | SYSMH3 | Human | Oral cavity | OSCC | 5.56e-16 | 4.39e-01 | 0.2442 |
| 2005 | ELK4 | SYSMH5 | Human | Oral cavity | OSCC | 2.67e-02 | 9.96e-02 | 0.0647 |
| 2005 | ELK4 | SYSMH6 | Human | Oral cavity | OSCC | 3.31e-05 | 7.17e-02 | 0.1275 |
| 2005 | ELK4 | P1_cSCC | Human | Skin | cSCC | 6.76e-23 | 6.64e-01 | 0.0292 |
| 2005 | ELK4 | P2_cSCC | Human | Skin | cSCC | 3.03e-07 | 3.03e-01 | -0.024 |
| 2005 | ELK4 | P4_cSCC | Human | Skin | cSCC | 1.87e-06 | 3.10e-01 | -0.00290000000000005 |
| 2005 | ELK4 | P10_cSCC | Human | Skin | cSCC | 3.34e-18 | 5.30e-01 | 0.1017 |
| 2005 | ELK4 | male-WTA | Human | Thyroid | PTC | 4.30e-11 | 1.33e-01 | 0.1037 |
| 2005 | ELK4 | PTC01 | Human | Thyroid | PTC | 1.96e-03 | 9.95e-02 | 0.1899 |
| 2005 | ELK4 | PTC03 | Human | Thyroid | PTC | 7.48e-04 | 1.94e-01 | 0.1784 |
| 2005 | ELK4 | PTC04 | Human | Thyroid | PTC | 8.32e-14 | 2.93e-01 | 0.1927 |
| 2005 | ELK4 | PTC05 | Human | Thyroid | PTC | 1.75e-11 | 4.92e-01 | 0.2065 |
| 2005 | ELK4 | PTC06 | Human | Thyroid | PTC | 1.47e-22 | 5.00e-01 | 0.2057 |
| 2005 | ELK4 | PTC07 | Human | Thyroid | PTC | 1.58e-19 | 3.28e-01 | 0.2044 |
| 2005 | ELK4 | ATC09 | Human | Thyroid | ATC | 1.41e-02 | 1.26e-01 | 0.2871 |
| 2005 | ELK4 | ATC11 | Human | Thyroid | ATC | 5.21e-03 | 2.45e-01 | 0.3386 |
| 2005 | ELK4 | ATC12 | Human | Thyroid | ATC | 6.71e-14 | 1.68e-01 | 0.34 |
| 2005 | ELK4 | ATC13 | Human | Thyroid | ATC | 9.85e-29 | 5.60e-01 | 0.34 |
| Page: 1 2 3 4 5 6 |
| Tissue | Expression Dynamics | Abbreviation |
| Esophagus | 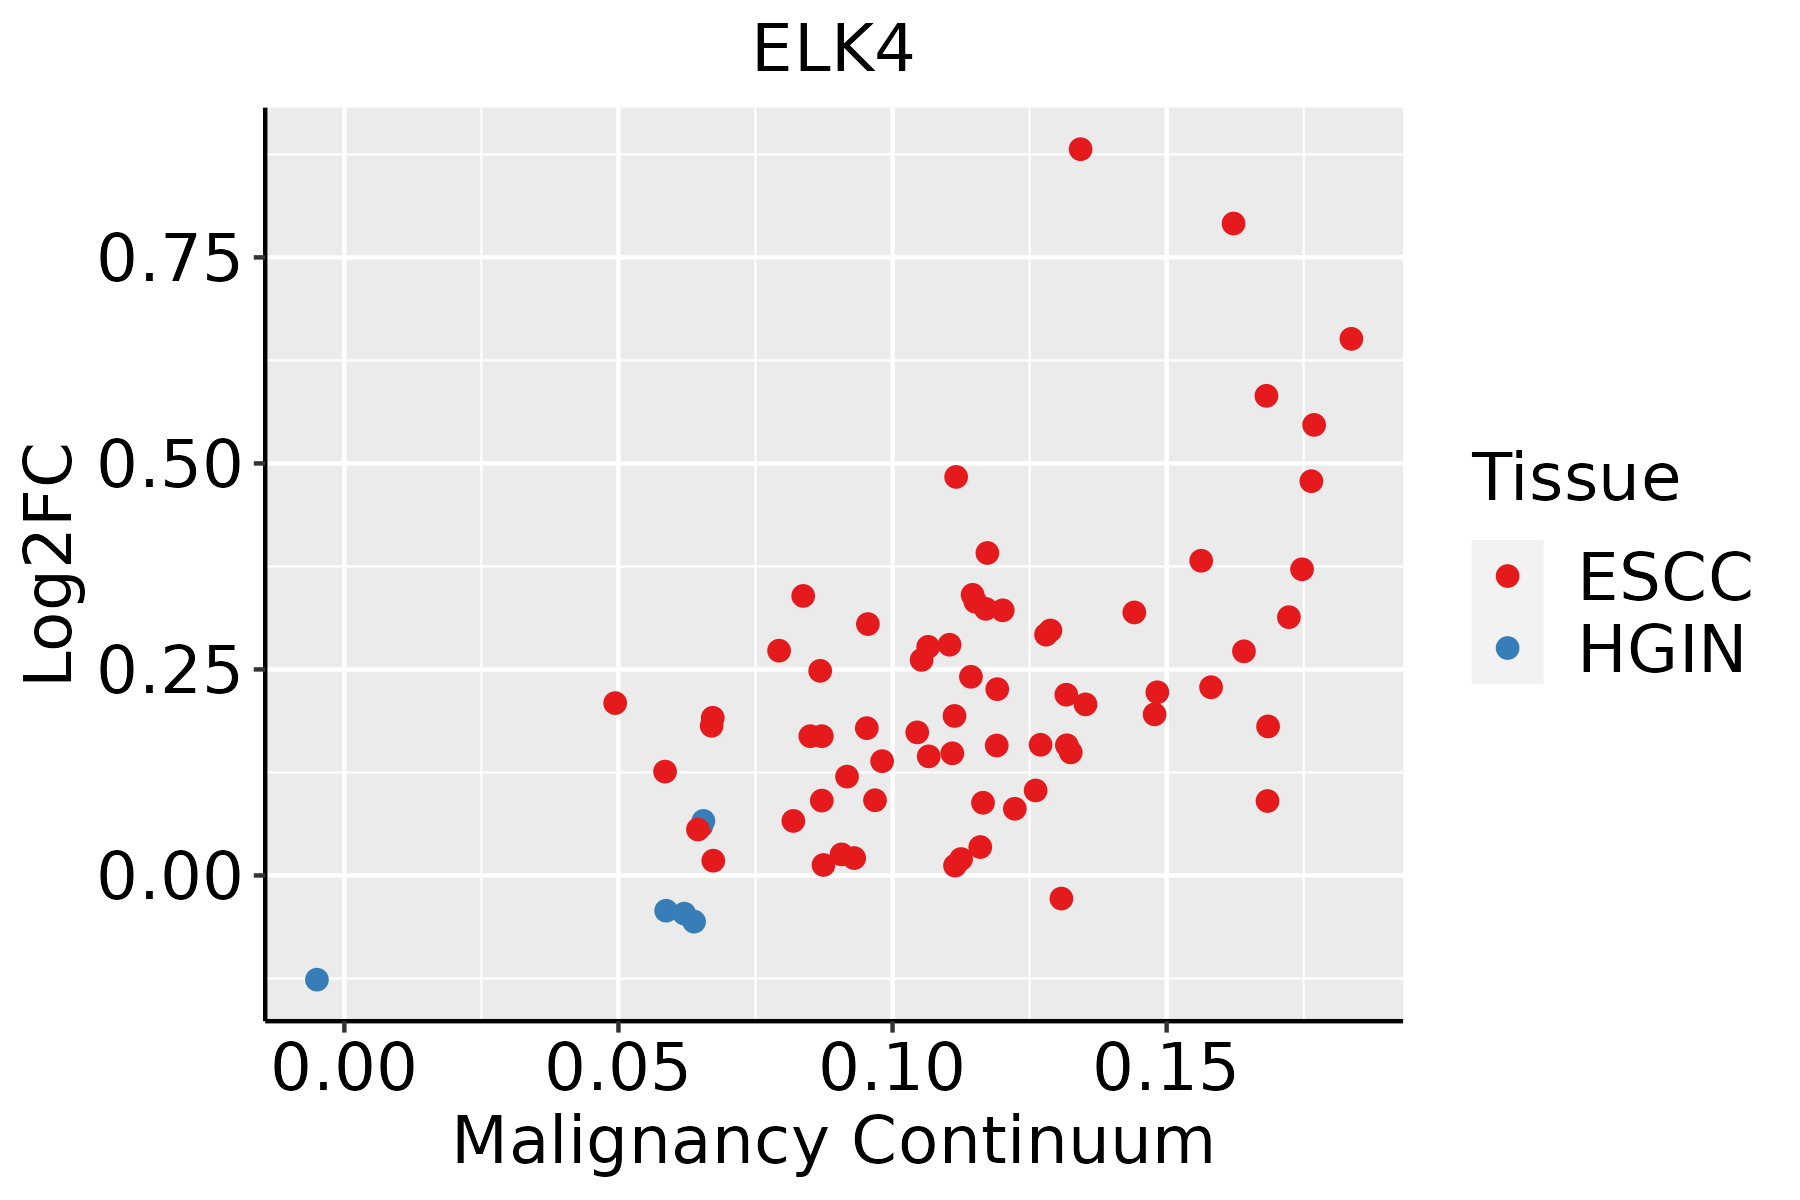 | ESCC: Esophageal squamous cell carcinoma |
| HGIN: High-grade intraepithelial neoplasias | ||
| LGIN: Low-grade intraepithelial neoplasias | ||
| Liver | 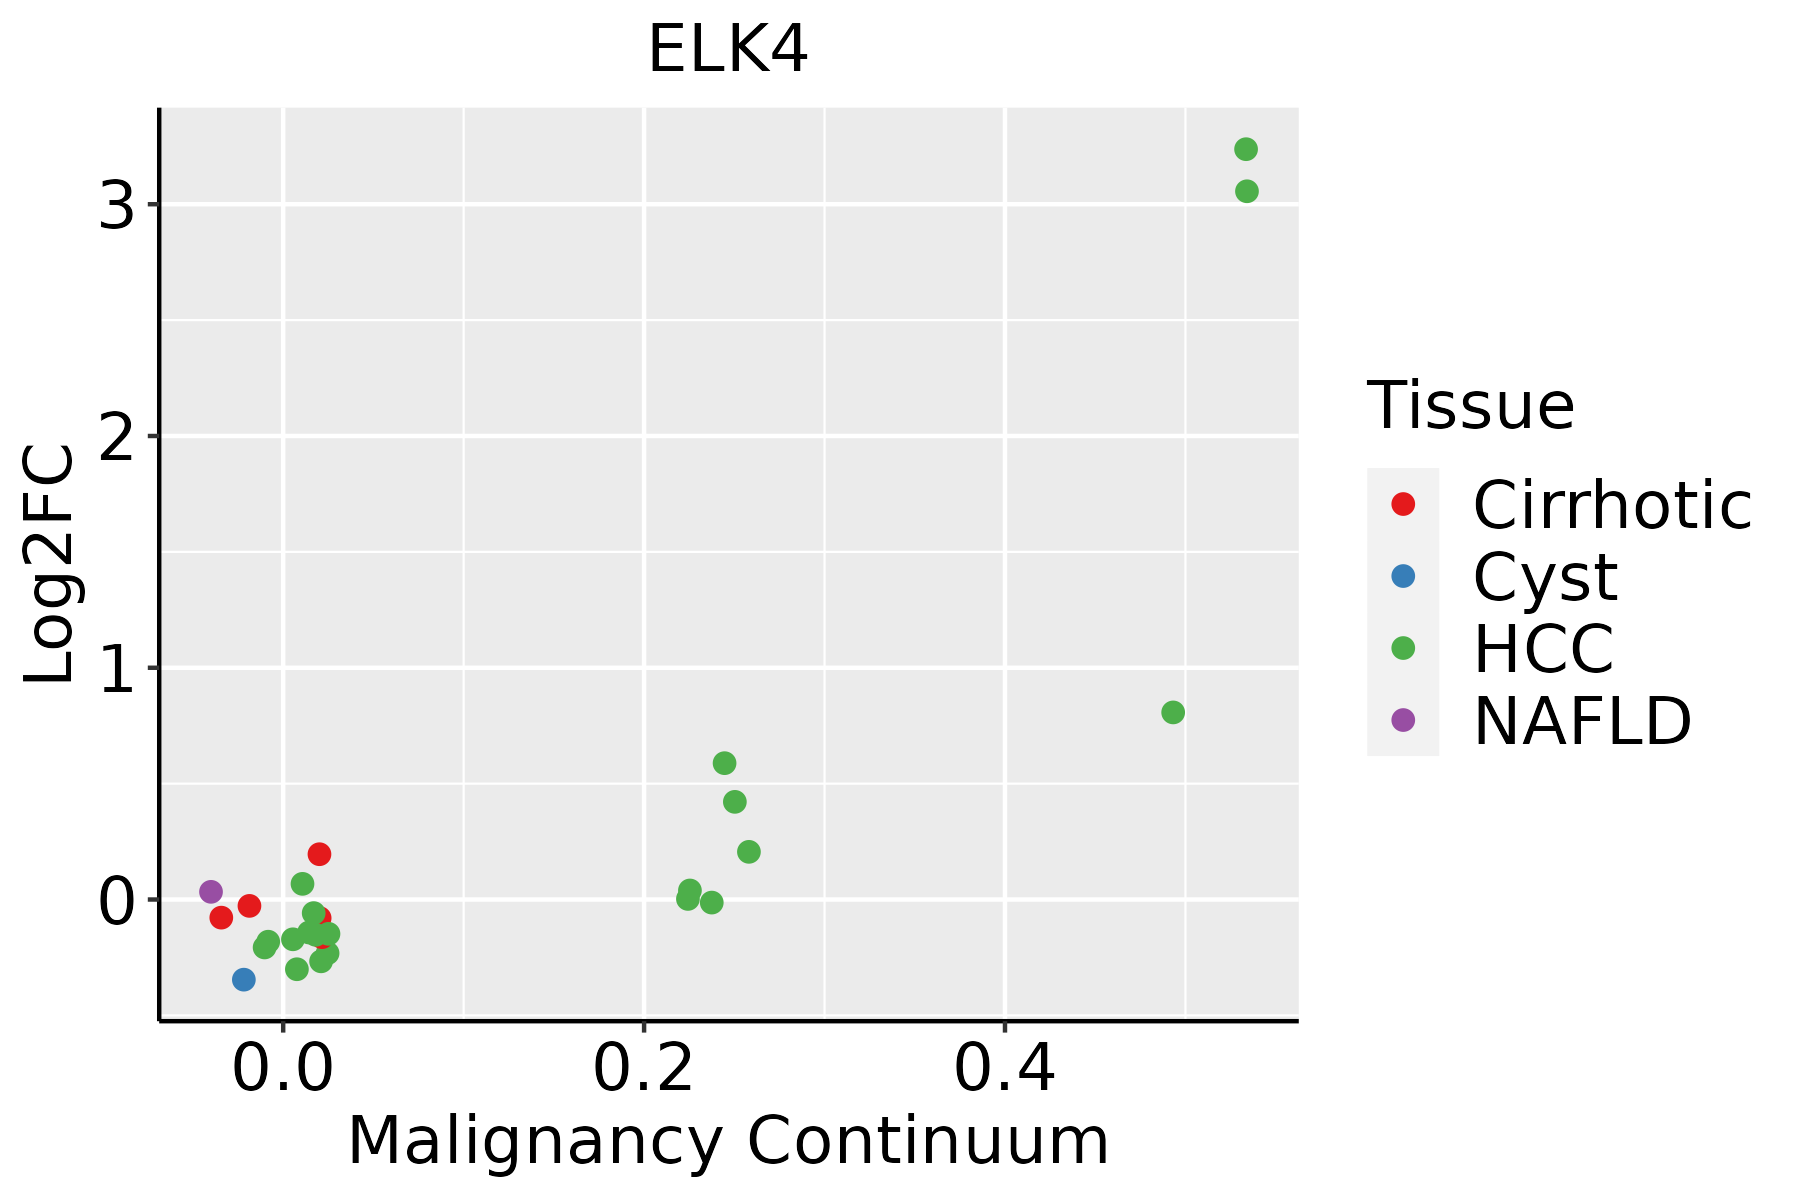 | HCC: Hepatocellular carcinoma |
| NAFLD: Non-alcoholic fatty liver disease | ||
| Oral Cavity | 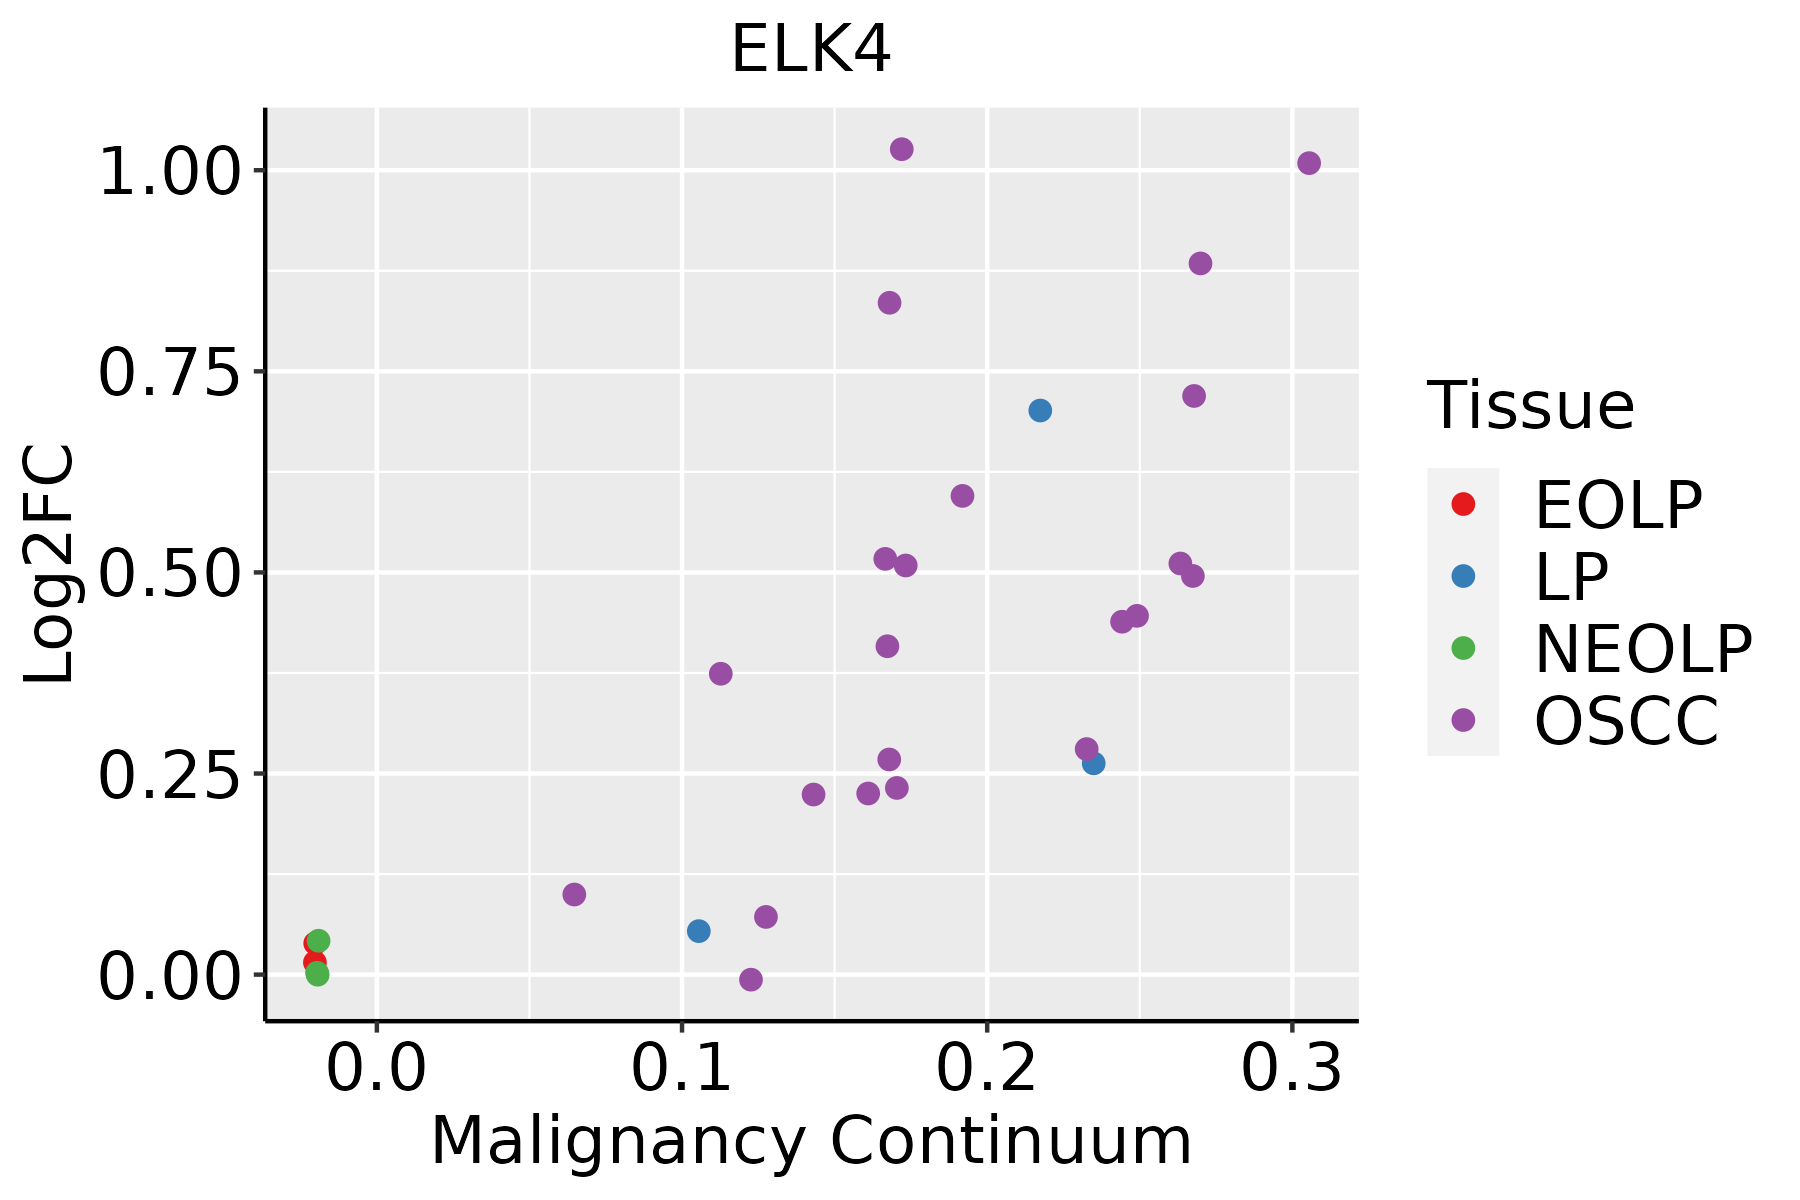 | EOLP: Erosive Oral lichen planus |
| LP: leukoplakia | ||
| NEOLP: Non-erosive oral lichen planus | ||
| OSCC: Oral squamous cell carcinoma | ||
| Prostate | 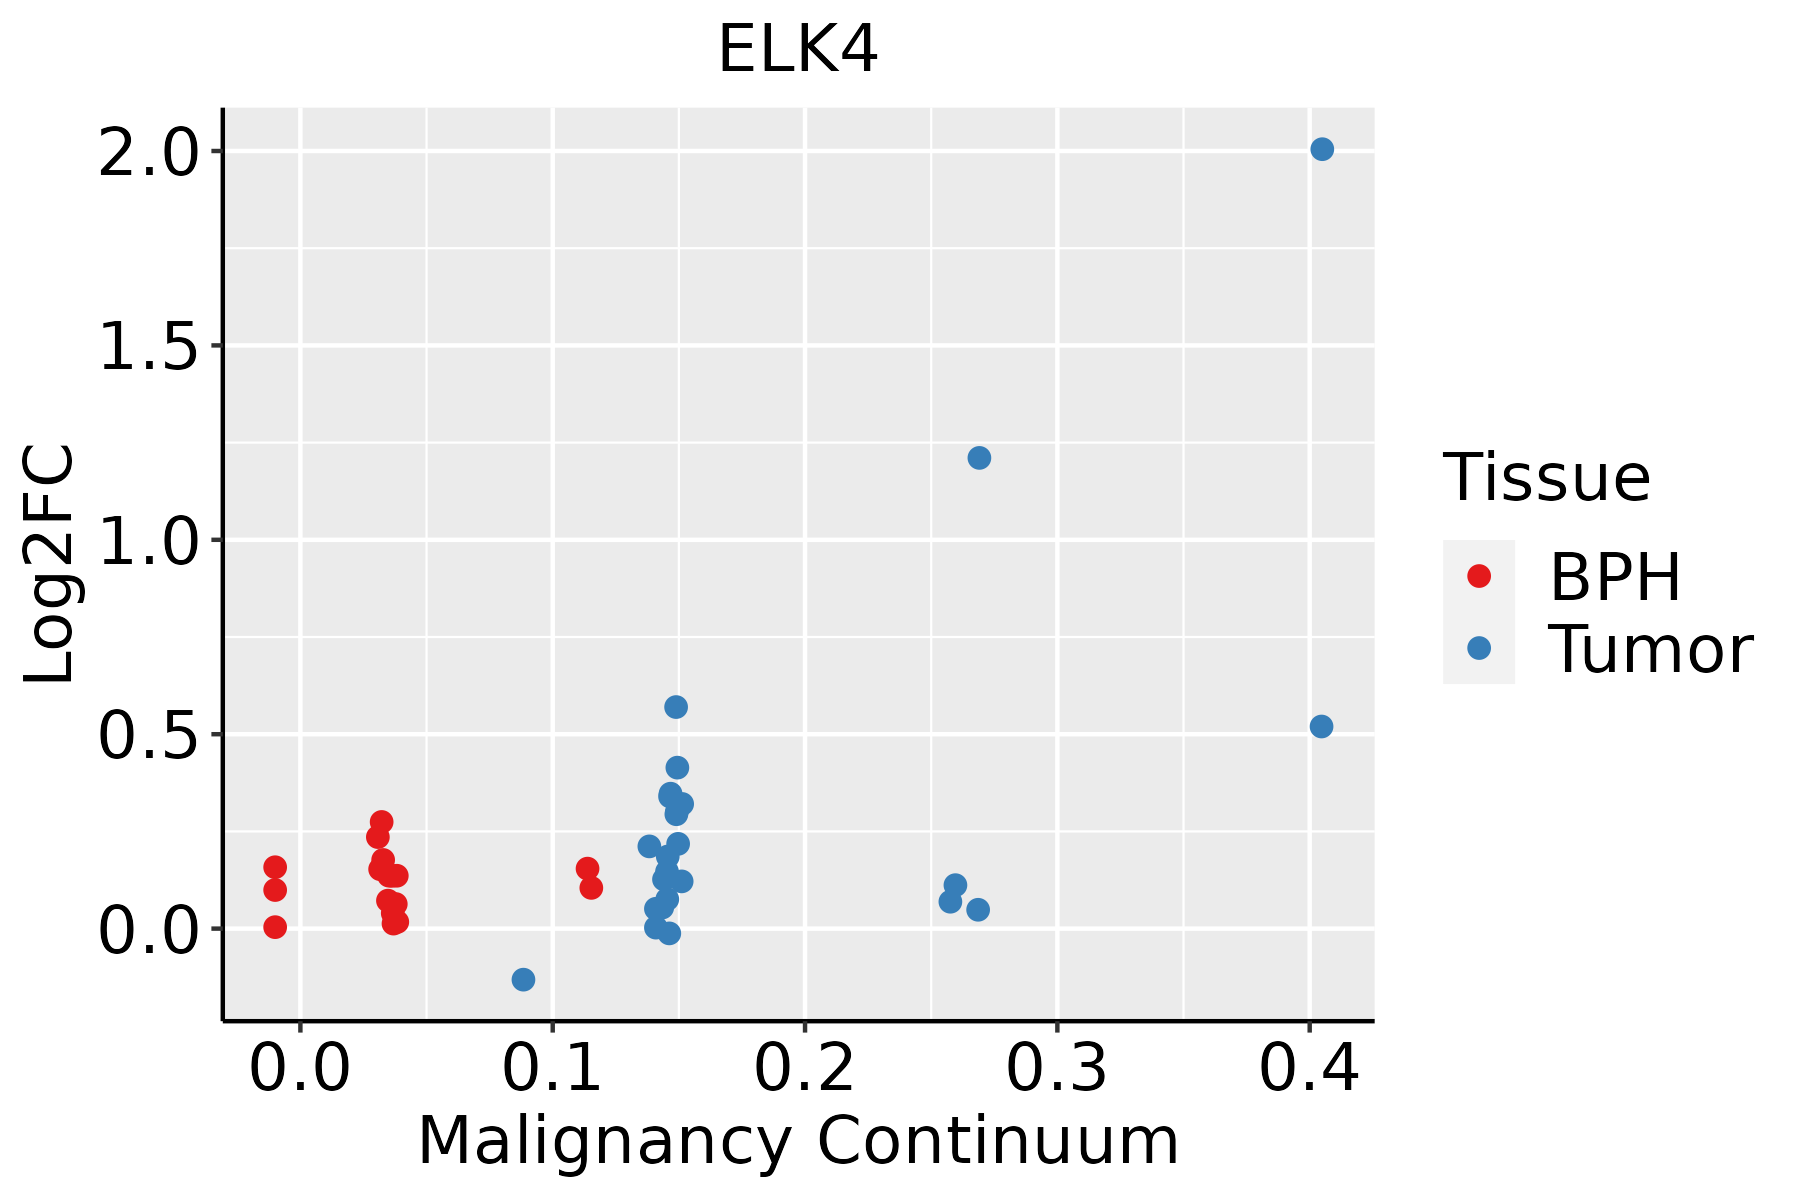 | BPH: Benign Prostatic Hyperplasia |
| Skin | 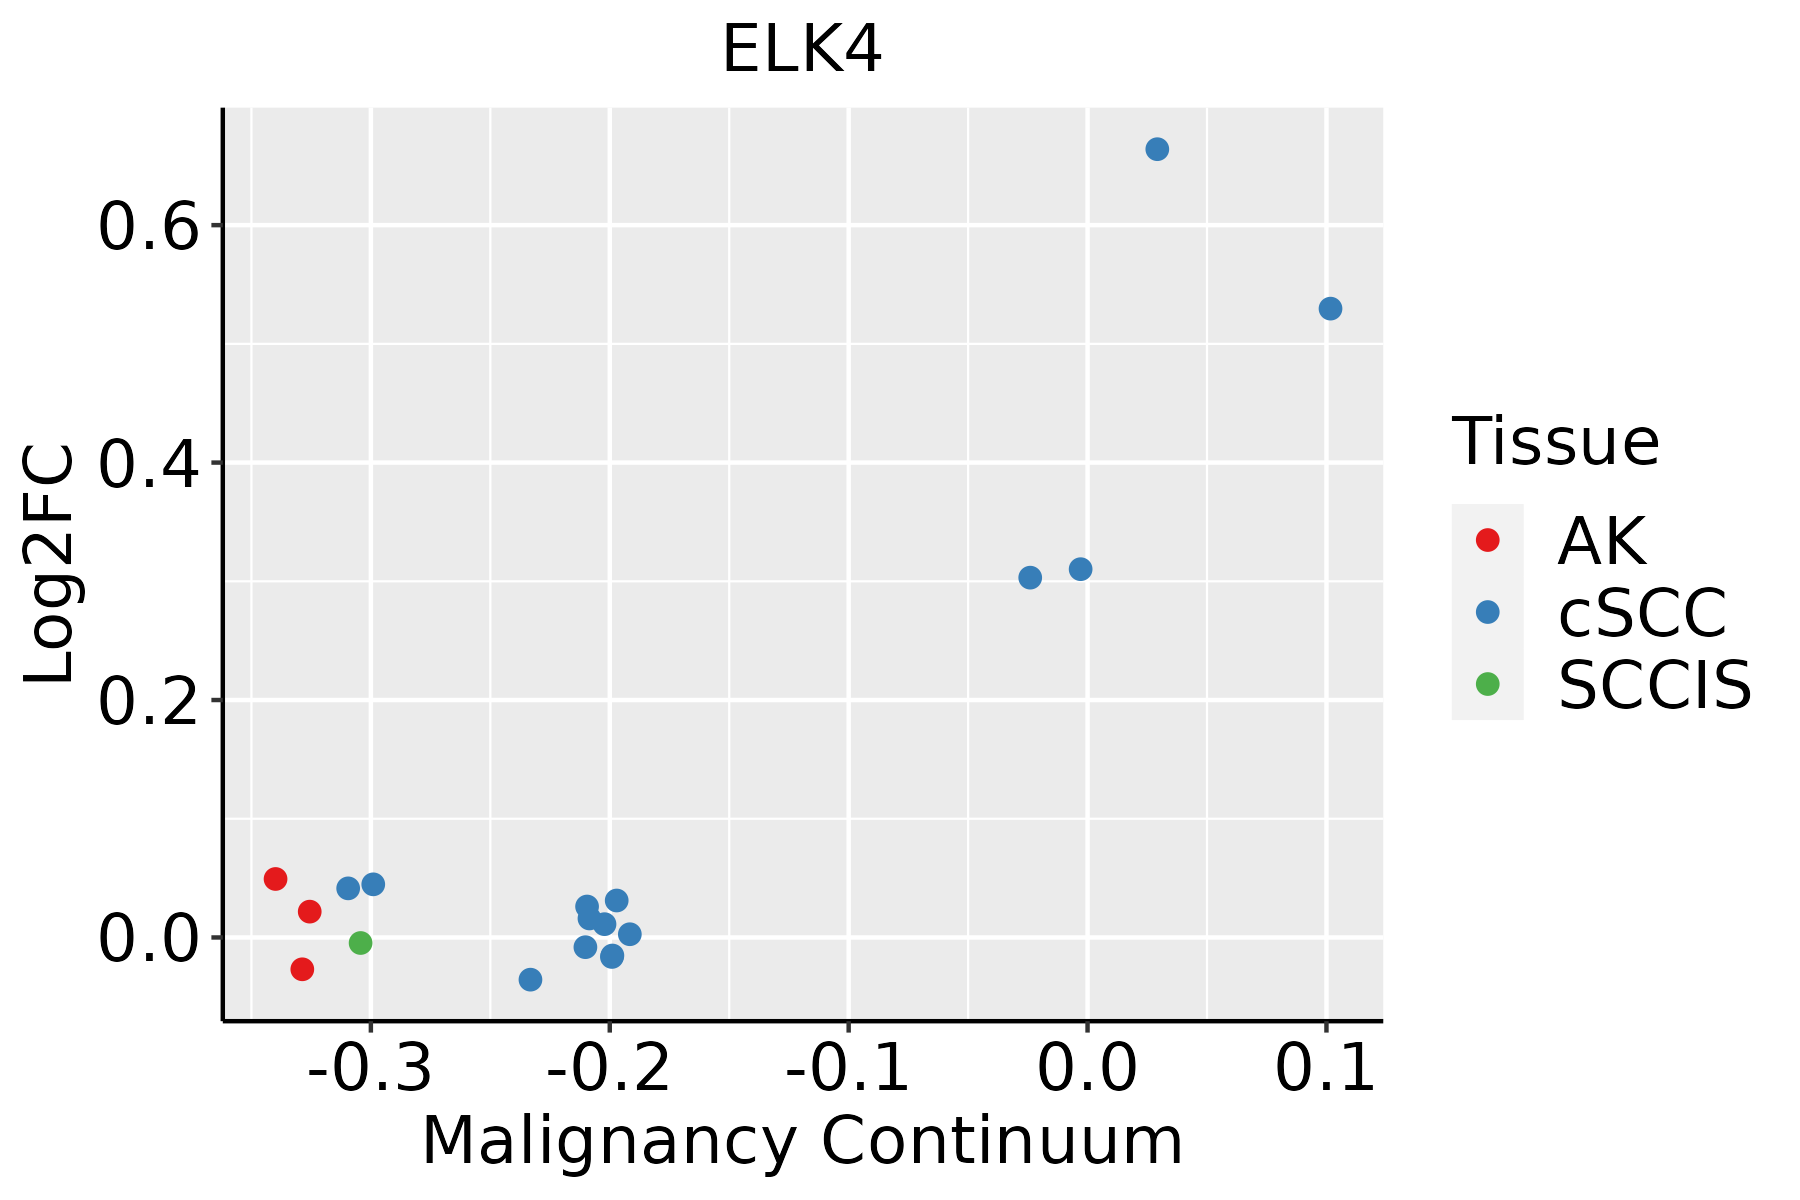 | AK: Actinic keratosis |
| cSCC: Cutaneous squamous cell carcinoma | ||
| SCCIS:squamous cell carcinoma in situ | ||
| Thyroid | 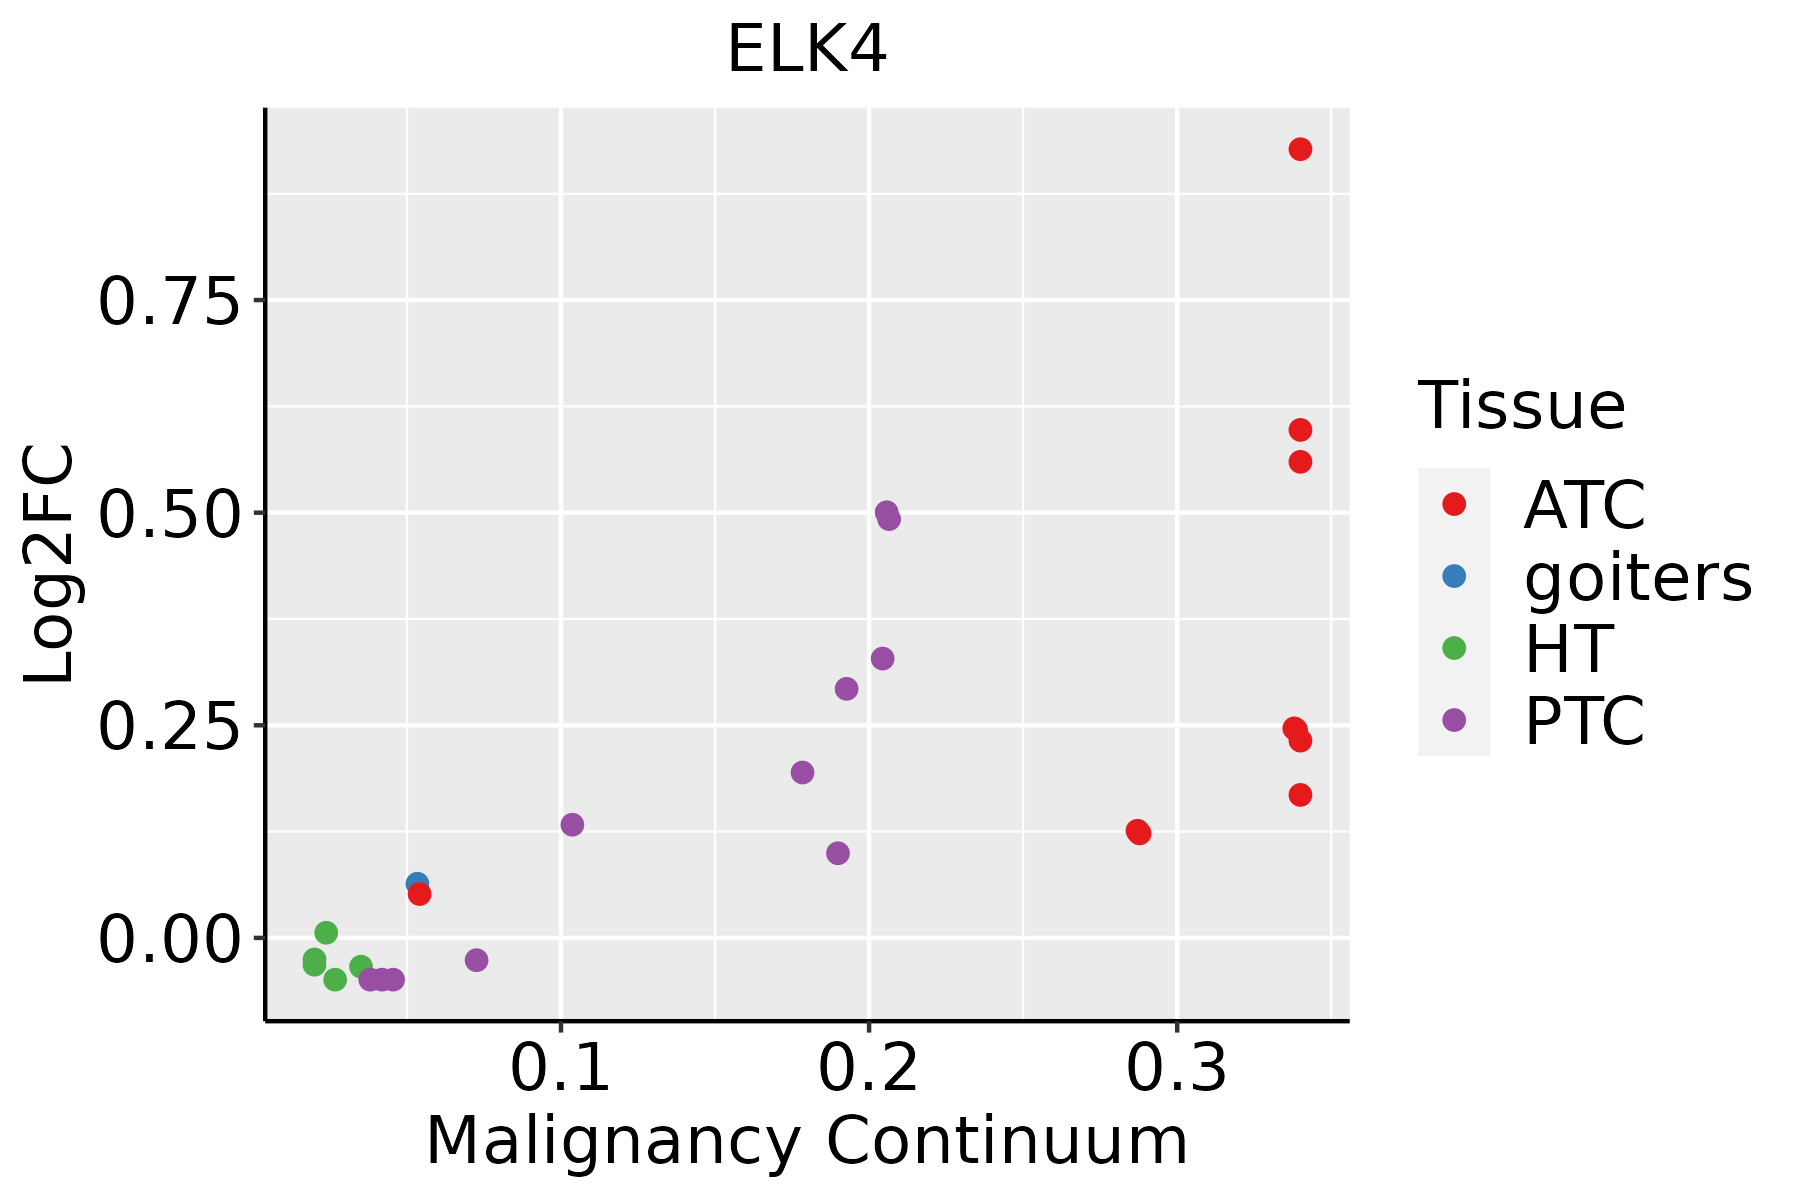 | ATC: Anaplastic thyroid cancer |
| HT: Hashimoto's thyroiditis | ||
| PTC: Papillary thyroid cancer |
| ∗log2FC in expression of this searched gene in stem-like cells from each diseased tissue sample relative to stem-like cells in normal samples in each tissue plotted against the malignancy continuum. Samples are colored based on if they are from different disease stage. |
Top |
Malignant transformation related pathway analysis |
| Find out the enriched GO biological processes and KEGG pathways involved in transition from healthy to precancer to cancer |
| Tissue | Disease Stage | Enriched GO biological Processes |
| Colorectum | AD |  |
| Colorectum | SER |  |
| Colorectum | MSS |  |
| Colorectum | MSI-H |  |
| Colorectum | FAP |  |
| ∗Top 15 enriched GO BP terms are showed in the bar plot of each disease state in each tissue. Each row represents a significant GO biological process which is colored according to the -log10(p.adjust). |
| Page: 1 2 3 4 5 6 7 8 9 |
| GO ID | Tissue | Disease Stage | Description | Gene Ratio | Bg Ratio | pvalue | p.adjust | Count |
| GO:001657015 | Esophagus | ESCC | histone modification | 323/8552 | 463/18723 | 2.61e-26 | 7.88e-24 | 323 |
| GO:00356015 | Esophagus | ESCC | protein deacylation | 79/8552 | 112/18723 | 8.30e-08 | 1.42e-06 | 79 |
| GO:00987325 | Esophagus | ESCC | macromolecule deacylation | 80/8552 | 116/18723 | 3.19e-07 | 4.50e-06 | 80 |
| GO:00165754 | Esophagus | ESCC | histone deacetylation | 60/8552 | 82/18723 | 3.85e-07 | 5.32e-06 | 60 |
| GO:00064765 | Esophagus | ESCC | protein deacetylation | 70/8552 | 101/18723 | 1.29e-06 | 1.58e-05 | 70 |
| GO:00709321 | Esophagus | ESCC | histone H3 deacetylation | 15/8552 | 20/18723 | 7.60e-03 | 2.71e-02 | 15 |
| GO:001657011 | Liver | Cirrhotic | histone modification | 154/4634 | 463/18723 | 1.92e-05 | 2.57e-04 | 154 |
| GO:0035601 | Liver | Cirrhotic | protein deacylation | 39/4634 | 112/18723 | 1.08e-02 | 4.75e-02 | 39 |
| GO:001657021 | Liver | HCC | histone modification | 283/7958 | 463/18723 | 2.68e-16 | 2.33e-14 | 283 |
| GO:0098732 | Liver | HCC | macromolecule deacylation | 67/7958 | 116/18723 | 6.46e-04 | 3.99e-03 | 67 |
| GO:00356011 | Liver | HCC | protein deacylation | 64/7958 | 112/18723 | 1.23e-03 | 6.83e-03 | 64 |
| GO:00064761 | Liver | HCC | protein deacetylation | 55/7958 | 101/18723 | 1.01e-02 | 3.79e-02 | 55 |
| GO:00165707 | Oral cavity | OSCC | histone modification | 270/7305 | 463/18723 | 1.59e-17 | 1.50e-15 | 270 |
| GO:00356014 | Oral cavity | OSCC | protein deacylation | 74/7305 | 112/18723 | 5.88e-09 | 1.26e-07 | 74 |
| GO:00987324 | Oral cavity | OSCC | macromolecule deacylation | 74/7305 | 116/18723 | 5.52e-08 | 1.01e-06 | 74 |
| GO:00064764 | Oral cavity | OSCC | protein deacetylation | 66/7305 | 101/18723 | 7.36e-08 | 1.30e-06 | 66 |
| GO:00165753 | Oral cavity | OSCC | histone deacetylation | 54/7305 | 82/18723 | 7.68e-07 | 1.08e-05 | 54 |
| GO:0070932 | Oral cavity | OSCC | histone H3 deacetylation | 14/7305 | 20/18723 | 4.95e-03 | 1.94e-02 | 14 |
| GO:00165706 | Prostate | BPH | histone modification | 120/3107 | 463/18723 | 1.73e-07 | 3.89e-06 | 120 |
| GO:00356013 | Prostate | BPH | protein deacylation | 32/3107 | 112/18723 | 1.03e-03 | 6.46e-03 | 32 |
| Page: 1 2 3 |
| Pathway ID | Tissue | Disease Stage | Description | Gene Ratio | Bg Ratio | pvalue | p.adjust | qvalue | Count |
| hsa05166211 | Esophagus | ESCC | Human T-cell leukemia virus 1 infection | 164/4205 | 222/8465 | 8.13e-14 | 2.09e-12 | 1.07e-12 | 164 |
| hsa052028 | Esophagus | ESCC | Transcriptional misregulation in cancer | 116/4205 | 193/8465 | 2.08e-03 | 5.95e-03 | 3.05e-03 | 116 |
| hsa05166310 | Esophagus | ESCC | Human T-cell leukemia virus 1 infection | 164/4205 | 222/8465 | 8.13e-14 | 2.09e-12 | 1.07e-12 | 164 |
| hsa0520213 | Esophagus | ESCC | Transcriptional misregulation in cancer | 116/4205 | 193/8465 | 2.08e-03 | 5.95e-03 | 3.05e-03 | 116 |
| hsa0516614 | Liver | Cirrhotic | Human T-cell leukemia virus 1 infection | 87/2530 | 222/8465 | 1.69e-03 | 8.01e-03 | 4.94e-03 | 87 |
| hsa0516615 | Liver | Cirrhotic | Human T-cell leukemia virus 1 infection | 87/2530 | 222/8465 | 1.69e-03 | 8.01e-03 | 4.94e-03 | 87 |
| hsa0516622 | Liver | HCC | Human T-cell leukemia virus 1 infection | 139/4020 | 222/8465 | 3.17e-06 | 2.79e-05 | 1.55e-05 | 139 |
| hsa0516632 | Liver | HCC | Human T-cell leukemia virus 1 infection | 139/4020 | 222/8465 | 3.17e-06 | 2.79e-05 | 1.55e-05 | 139 |
| hsa0516630 | Oral cavity | OSCC | Human T-cell leukemia virus 1 infection | 150/3704 | 222/8465 | 3.68e-13 | 7.26e-12 | 3.70e-12 | 150 |
| hsa0401014 | Oral cavity | OSCC | MAPK signaling pathway | 165/3704 | 302/8465 | 7.11e-05 | 2.74e-04 | 1.40e-04 | 165 |
| hsa05166113 | Oral cavity | OSCC | Human T-cell leukemia virus 1 infection | 150/3704 | 222/8465 | 3.68e-13 | 7.26e-12 | 3.70e-12 | 150 |
| hsa0401015 | Oral cavity | OSCC | MAPK signaling pathway | 165/3704 | 302/8465 | 7.11e-05 | 2.74e-04 | 1.40e-04 | 165 |
| hsa0516628 | Prostate | BPH | Human T-cell leukemia virus 1 infection | 79/1718 | 222/8465 | 6.00e-08 | 6.83e-07 | 4.23e-07 | 79 |
| hsa0401010 | Prostate | BPH | MAPK signaling pathway | 87/1718 | 302/8465 | 2.05e-04 | 1.13e-03 | 6.98e-04 | 87 |
| hsa052027 | Prostate | BPH | Transcriptional misregulation in cancer | 53/1718 | 193/8465 | 9.56e-03 | 2.92e-02 | 1.81e-02 | 53 |
| hsa05166112 | Prostate | BPH | Human T-cell leukemia virus 1 infection | 79/1718 | 222/8465 | 6.00e-08 | 6.83e-07 | 4.23e-07 | 79 |
| hsa0401013 | Prostate | BPH | MAPK signaling pathway | 87/1718 | 302/8465 | 2.05e-04 | 1.13e-03 | 6.98e-04 | 87 |
| hsa0520212 | Prostate | BPH | Transcriptional misregulation in cancer | 53/1718 | 193/8465 | 9.56e-03 | 2.92e-02 | 1.81e-02 | 53 |
| hsa0516629 | Prostate | Tumor | Human T-cell leukemia virus 1 infection | 78/1791 | 222/8465 | 7.99e-07 | 8.02e-06 | 4.97e-06 | 78 |
| hsa0401022 | Prostate | Tumor | MAPK signaling pathway | 87/1791 | 302/8465 | 8.46e-04 | 3.94e-03 | 2.45e-03 | 87 |
| Page: 1 2 |
Top |
Cell-cell communication analysis |
| Identification of potential cell-cell interactions between two cell types and their ligand-receptor pairs for different disease states |
| Ligand | Receptor | LRpair | Pathway | Tissue | Disease Stage |
| Page: 1 |
Top |
Single-cell gene regulatory network inference analysis |
| Find out the significant the regulons (TFs) and the target genes of each regulon across cell types for different disease states |
| TF | Cell Type | Tissue | Disease Stage | Target Gene | RSS | Regulon Activity |
| ELK4 | SURF | Endometrium | Healthy | IL6ST,SLC18A2,DYNLT3, etc. | 4.38e-01 |  |
| ELK4 | LUM | Prostate | ADJ | SLC45A3,STEAP2,RDH11, etc. | 6.81e-01 |  |
| ELK4 | PARI | Stomach | ADJ | ESRRG,MYRIP,AC019197.1, etc. | 8.64e-02 |  |
| ELK4 | PARI | Stomach | CAG with IM | ESRRG,MYRIP,AC019197.1, etc. | 9.26e-02 |  |
| ELK4 | PARI | Stomach | CSG | ESRRG,MYRIP,AC019197.1, etc. | 8.22e-02 |  |
| ELK4 | PARI | Stomach | GC | ESRRG,MYRIP,AC019197.1, etc. | 3.70e-02 |  |
| ∗The dot plots of a searched regulon are shown for all cell subpopulations in each disease state of each tissue based on the regulon specific score inferred using pySCENIC and by calculating the average expression. |
| Page: 1 |
Top |
Somatic mutation of malignant transformation related genes |
| Annotation of somatic variants for genes involved in malignant transformation |
| Hugo Symbol | Variant Class | Variant Classification | dbSNP RS | HGVSc | HGVSp | HGVSp Short | SWISSPROT | BIOTYPE | SIFT | PolyPhen | Tumor Sample Barcode | Tissue | Histology | Sex | Age | Stage | Therapy Types | Drugs | Outcome |
| ELK4 | SNV | Missense_Mutation | novel | c.350C>A | p.Ser117Tyr | p.S117Y | P28324 | protein_coding | deleterious(0.04) | benign(0.188) | TCGA-AC-A3W7-01 | Breast | breast invasive carcinoma | Female | >=65 | I/II | Hormone Therapy | femara | SD |
| ELK4 | SNV | Missense_Mutation | novel | c.381N>C | p.Lys127Asn | p.K127N | P28324 | protein_coding | tolerated(0.06) | benign(0.031) | TCGA-AR-A1AP-01 | Breast | breast invasive carcinoma | Female | >=65 | I/II | Hormone Therapy | anastrozole | SD |
| ELK4 | SNV | Missense_Mutation | novel | c.403N>C | p.Thr135Pro | p.T135P | P28324 | protein_coding | tolerated(0.21) | benign(0.092) | TCGA-D8-A1Y1-01 | Breast | breast invasive carcinoma | Female | >=65 | III/IV | Hormone Therapy | tamoxiphen | PD |
| ELK4 | insertion | Nonsense_Mutation | novel | c.910_911insTATAA | p.Asp304ValfsTer2 | p.D304Vfs*2 | P28324 | protein_coding | TCGA-AC-A3QQ-01 | Breast | breast invasive carcinoma | Female | <65 | I/II | Unknown | Unknown | SD | ||
| ELK4 | insertion | Frame_Shift_Ins | novel | c.909_910insT | p.Asp304Ter | p.D304* | P28324 | protein_coding | TCGA-AC-A3QQ-01 | Breast | breast invasive carcinoma | Female | <65 | I/II | Unknown | Unknown | SD | ||
| ELK4 | SNV | Missense_Mutation | c.1115C>G | p.Ser372Cys | p.S372C | P28324 | protein_coding | deleterious(0) | probably_damaging(0.991) | TCGA-MY-A5BD-01 | Cervix | cervical & endocervical cancer | Female | <65 | I/II | Chemotherapy | cisplatin | CR | |
| ELK4 | SNV | Missense_Mutation | c.182N>A | p.Arg61Gln | p.R61Q | P28324 | protein_coding | deleterious(0) | probably_damaging(0.996) | TCGA-UC-A7PF-01 | Cervix | cervical & endocervical cancer | Female | <65 | I/II | Unknown | Unknown | SD | |
| ELK4 | SNV | Missense_Mutation | c.1066G>A | p.Ala356Thr | p.A356T | P28324 | protein_coding | deleterious(0) | possibly_damaging(0.831) | TCGA-AA-A00N-01 | Colorectum | colon adenocarcinoma | Male | >=65 | I/II | Unknown | Unknown | PD | |
| ELK4 | insertion | Frame_Shift_Ins | novel | c.1075_1076insT | p.Ser359PhefsTer37 | p.S359Ffs*37 | P28324 | protein_coding | TCGA-D5-6530-01 | Colorectum | colon adenocarcinoma | Male | <65 | I/II | Unknown | Unknown | SD | ||
| ELK4 | insertion | Frame_Shift_Ins | novel | c.1075_1076insT | p.Ser359PhefsTer37 | p.S359Ffs*37 | P28324 | protein_coding | TCGA-D5-6927-01 | Colorectum | colon adenocarcinoma | Male | <65 | I/II | Unknown | Unknown | SD |
| Page: 1 2 3 4 |
Top |
Related drugs of malignant transformation related genes |
| Identification of chemicals and drugs interact with genes involved in malignant transfromation |
| (DGIdb 4.0) |
| Entrez ID | Symbol | Category | Interaction Types | Drug Claim Name | Drug Name | PMIDs |
| Page: 1 |

Copyright 2023-Present -The University of Texas Health Science Center at Houston |