
|
|||||
|
 | |
| |
| |
| |
| |
| |
|
Gene: DNPEP |
Gene summary for DNPEP |
| Gene information | Species | Human | Gene symbol | DNPEP | Gene ID | 23549 |
| Gene name | aspartyl aminopeptidase | |
| Gene Alias | ASPEP | |
| Cytomap | 2q35 | |
| Gene Type | protein-coding | GO ID | GO:0006508 | UniProtAcc | B7Z7F0 |
Top |
Malignant transformation analysis |
| Identification of the aberrant gene expression in precancerous and cancerous lesions by comparing the gene expression of stem-like cells in diseased tissues with normal stem cells |
| Entrez ID | Symbol | Replicates | Species | Organ | Tissue | Adj P-value | Log2FC | Malignancy |
| 23549 | DNPEP | cirrhotic2 | Human | Liver | Cirrhotic | 1.22e-04 | 1.16e-01 | 0.0201 |
| 23549 | DNPEP | cirrhotic3 | Human | Liver | Cirrhotic | 5.65e-05 | 9.27e-02 | 0.0215 |
| 23549 | DNPEP | HCC1 | Human | Liver | HCC | 1.30e-09 | 4.26e+00 | 0.5336 |
| 23549 | DNPEP | HCC2 | Human | Liver | HCC | 2.24e-29 | 4.42e+00 | 0.5341 |
| 23549 | DNPEP | HCC5 | Human | Liver | HCC | 8.74e-06 | 2.99e+00 | 0.4932 |
| 23549 | DNPEP | Pt13.b | Human | Liver | HCC | 1.06e-08 | 8.34e-02 | 0.0251 |
| 23549 | DNPEP | Pt14.b | Human | Liver | HCC | 1.94e-02 | 2.04e-01 | 0.018 |
| 23549 | DNPEP | S014 | Human | Liver | HCC | 4.38e-17 | 7.99e-01 | 0.2254 |
| 23549 | DNPEP | S015 | Human | Liver | HCC | 7.61e-12 | 7.87e-01 | 0.2375 |
| 23549 | DNPEP | S016 | Human | Liver | HCC | 3.87e-12 | 7.12e-01 | 0.2243 |
| 23549 | DNPEP | S027 | Human | Liver | HCC | 6.02e-09 | 1.18e+00 | 0.2446 |
| 23549 | DNPEP | S028 | Human | Liver | HCC | 6.02e-21 | 1.28e+00 | 0.2503 |
| 23549 | DNPEP | S029 | Human | Liver | HCC | 3.75e-25 | 1.42e+00 | 0.2581 |
| 23549 | DNPEP | C04 | Human | Oral cavity | OSCC | 1.27e-26 | 1.28e+00 | 0.2633 |
| 23549 | DNPEP | C21 | Human | Oral cavity | OSCC | 7.29e-66 | 1.92e+00 | 0.2678 |
| 23549 | DNPEP | C30 | Human | Oral cavity | OSCC | 1.21e-46 | 2.35e+00 | 0.3055 |
| 23549 | DNPEP | C38 | Human | Oral cavity | OSCC | 2.75e-21 | 2.05e+00 | 0.172 |
| 23549 | DNPEP | C43 | Human | Oral cavity | OSCC | 3.29e-42 | 7.74e-01 | 0.1704 |
| 23549 | DNPEP | C46 | Human | Oral cavity | OSCC | 1.25e-48 | 1.14e+00 | 0.1673 |
| 23549 | DNPEP | C51 | Human | Oral cavity | OSCC | 2.76e-13 | 7.75e-01 | 0.2674 |
| Page: 1 2 3 4 5 6 7 |
| Tissue | Expression Dynamics | Abbreviation |
| Colorectum (GSE201348) |  | FAP: Familial adenomatous polyposis |
| CRC: Colorectal cancer | ||
| Colorectum (HTA11) |  | AD: Adenomas |
| SER: Sessile serrated lesions | ||
| MSI-H: Microsatellite-high colorectal cancer | ||
| MSS: Microsatellite stable colorectal cancer | ||
| Esophagus | 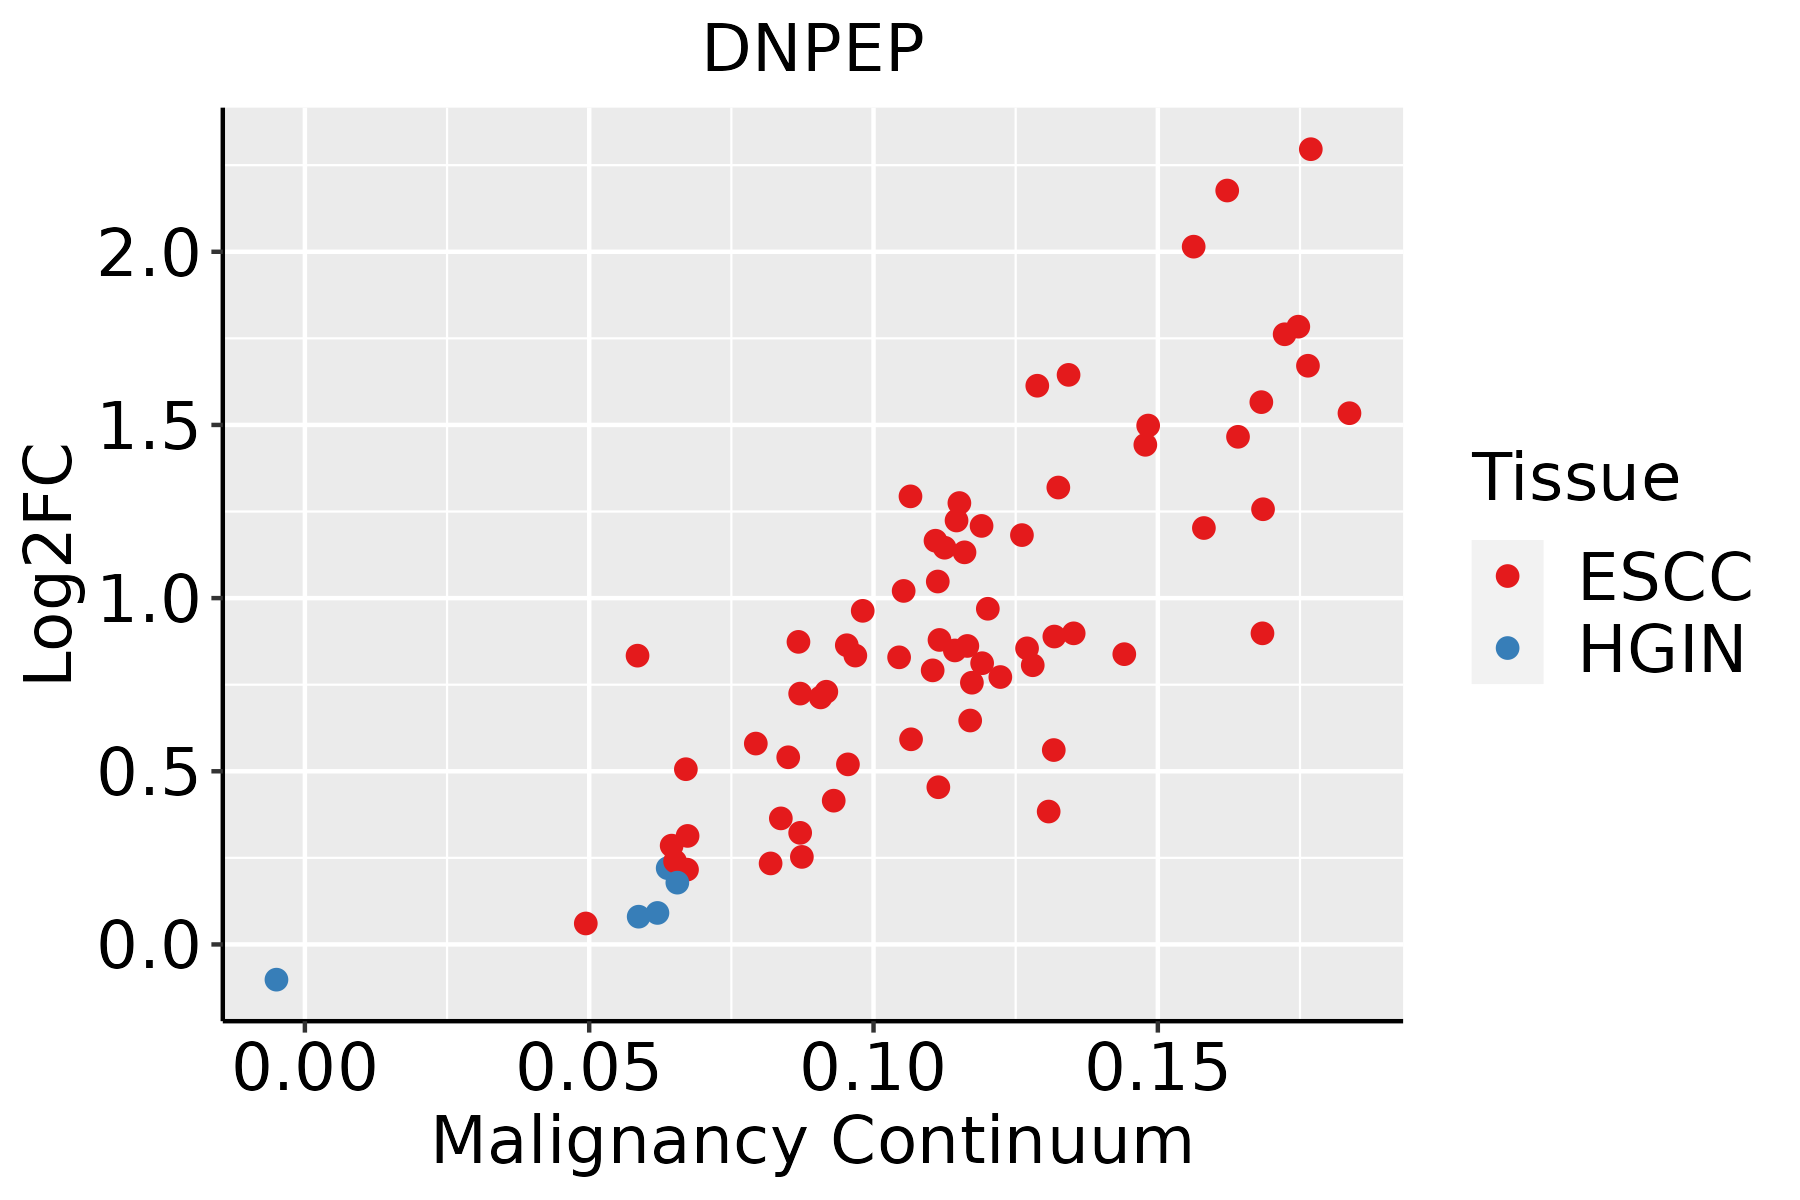 | ESCC: Esophageal squamous cell carcinoma |
| HGIN: High-grade intraepithelial neoplasias | ||
| LGIN: Low-grade intraepithelial neoplasias | ||
| Liver |  | HCC: Hepatocellular carcinoma |
| NAFLD: Non-alcoholic fatty liver disease | ||
| Oral Cavity |  | EOLP: Erosive Oral lichen planus |
| LP: leukoplakia | ||
| NEOLP: Non-erosive oral lichen planus | ||
| OSCC: Oral squamous cell carcinoma | ||
| Skin | 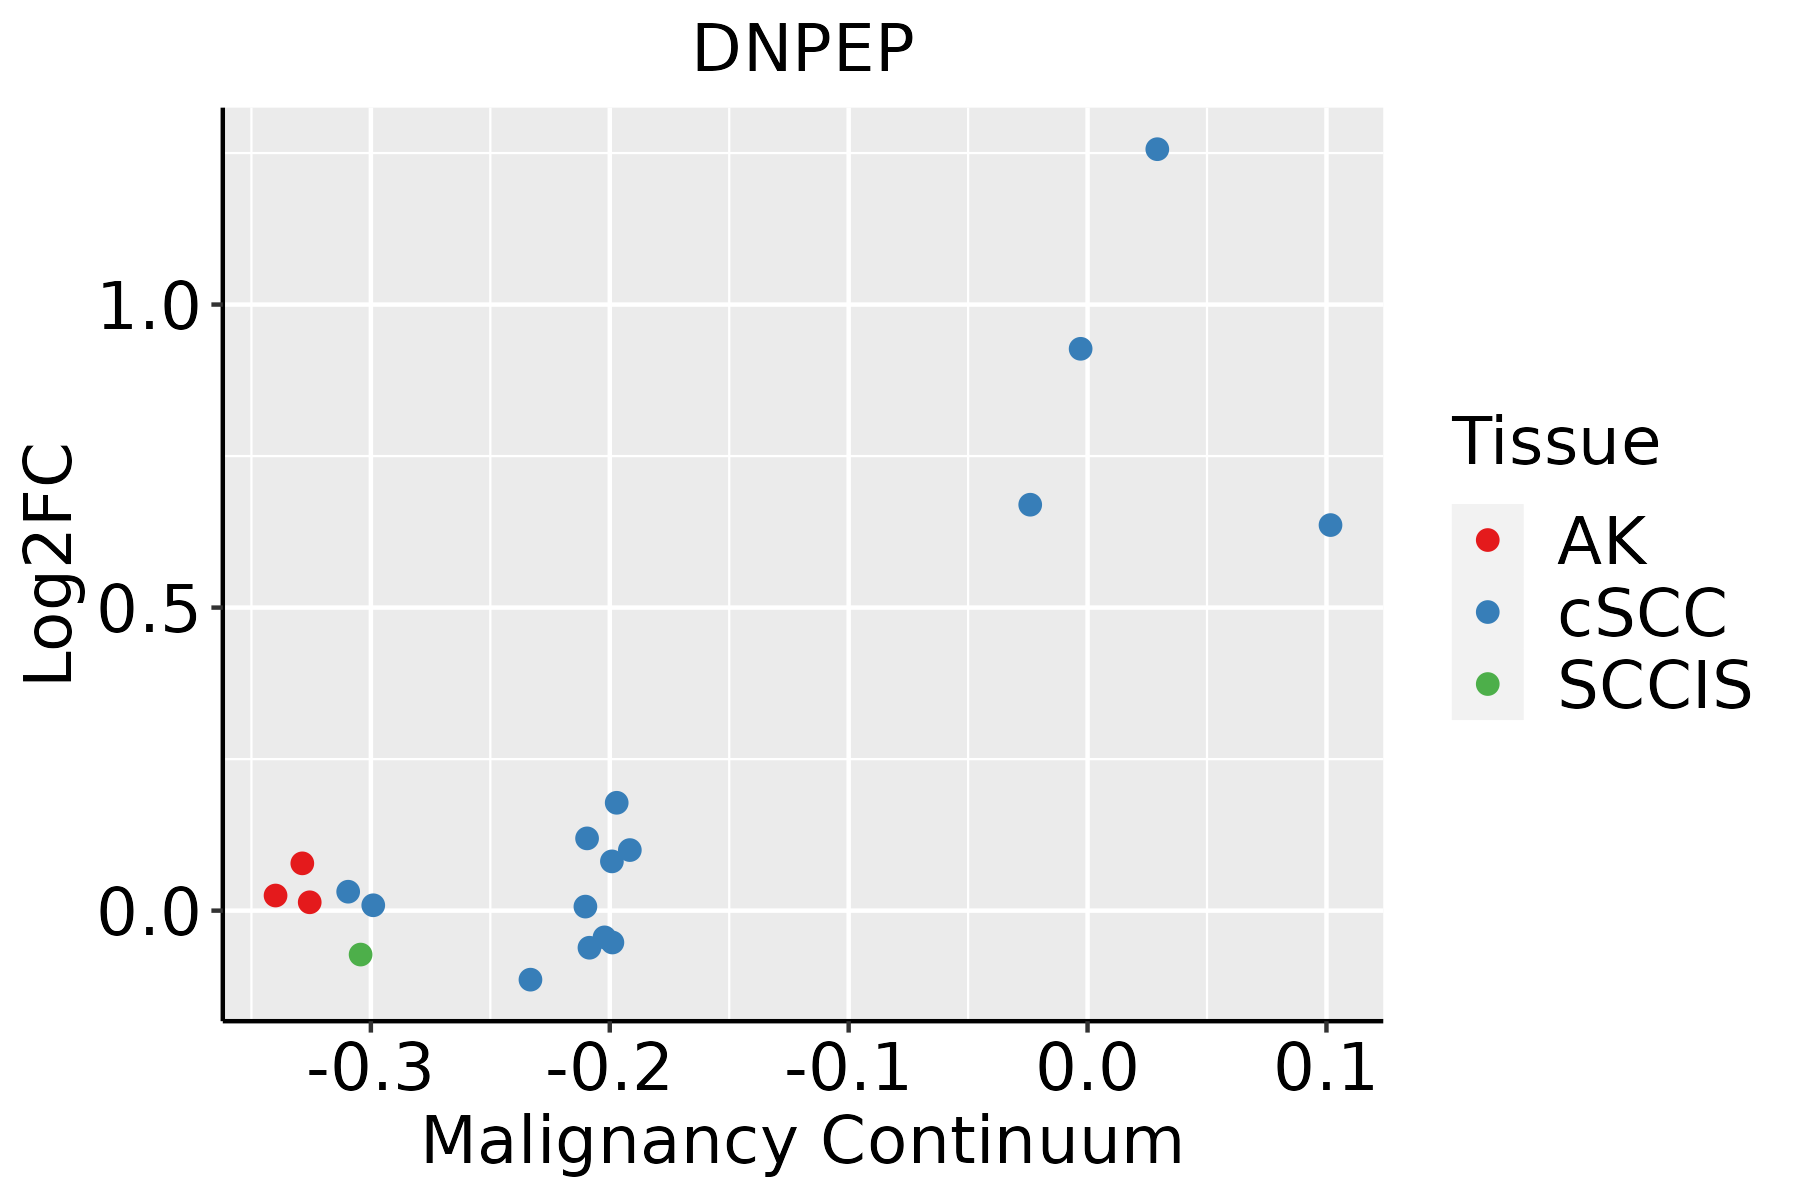 | AK: Actinic keratosis |
| cSCC: Cutaneous squamous cell carcinoma | ||
| SCCIS:squamous cell carcinoma in situ | ||
| Thyroid | 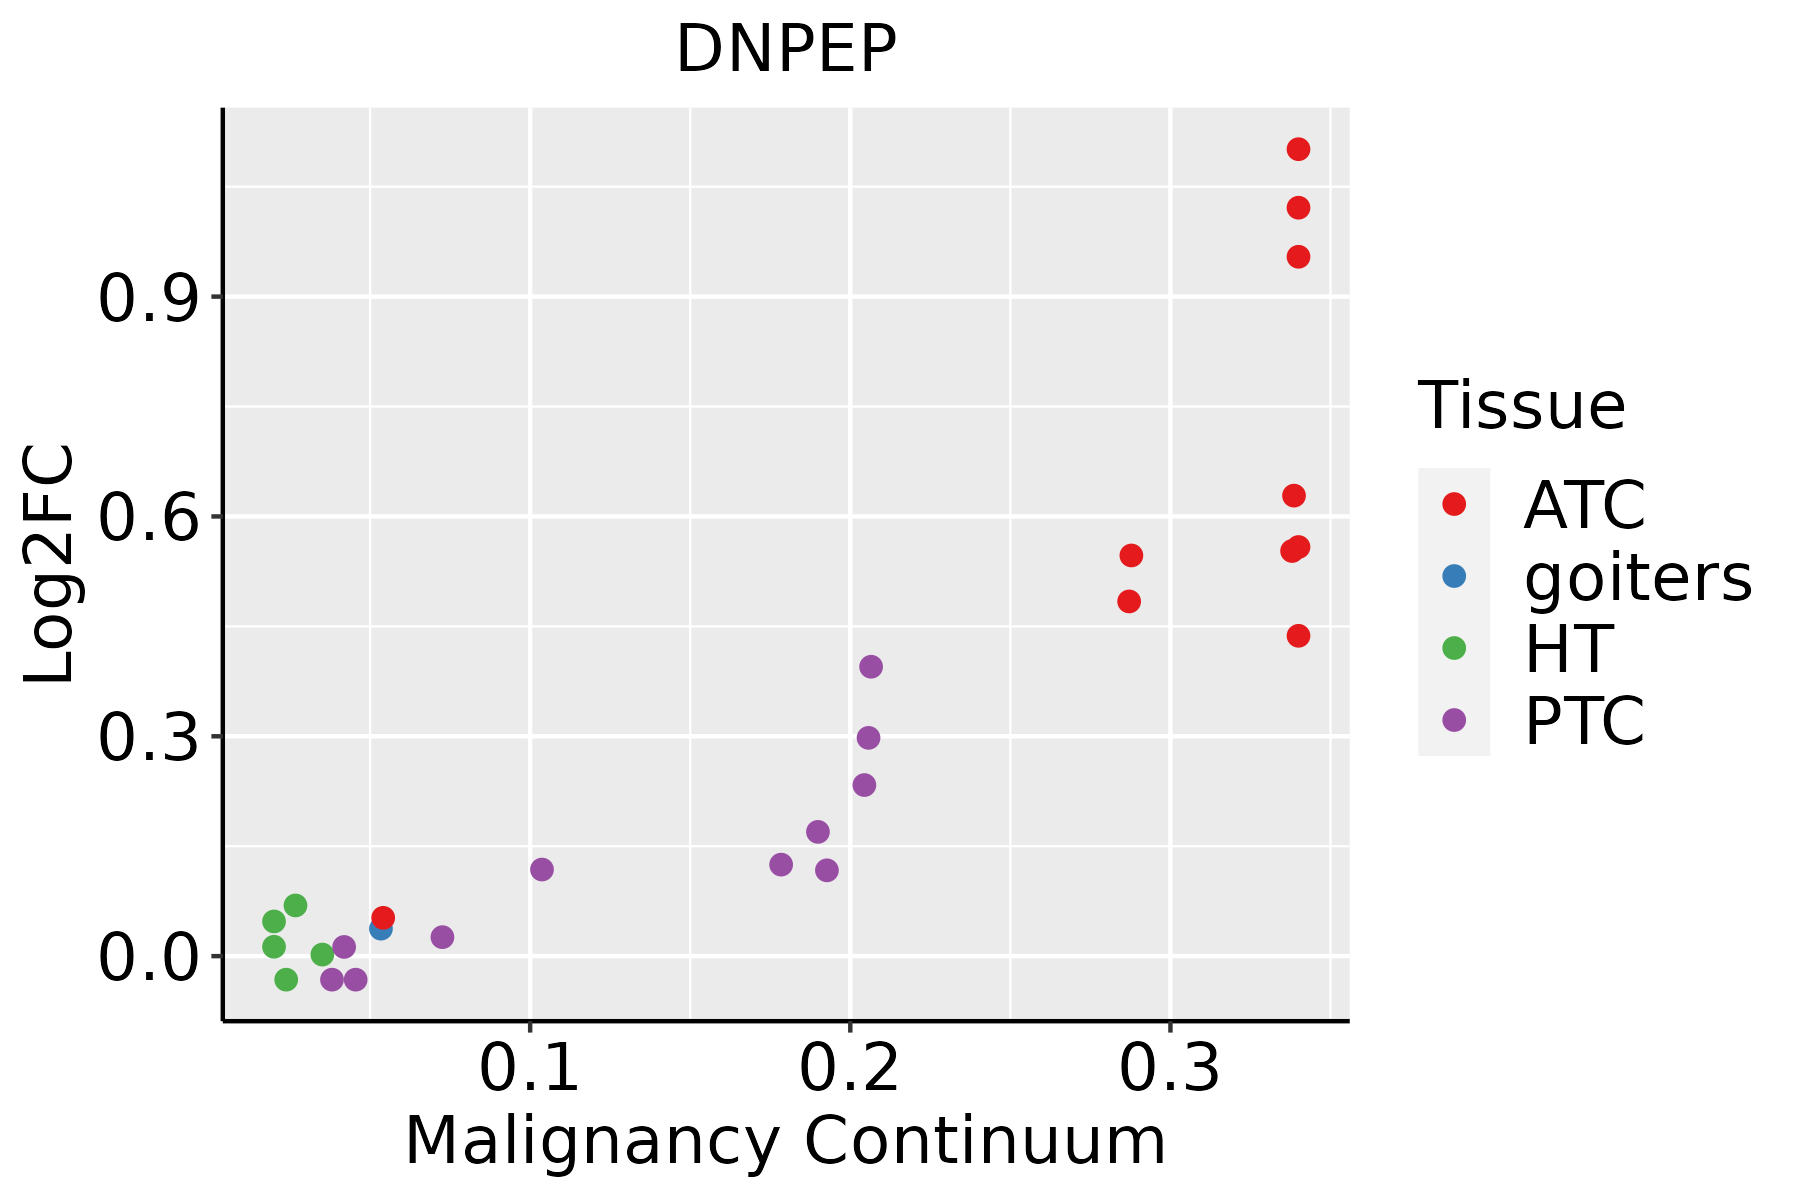 | ATC: Anaplastic thyroid cancer |
| HT: Hashimoto's thyroiditis | ||
| PTC: Papillary thyroid cancer |
| ∗log2FC in expression of this searched gene in stem-like cells from each diseased tissue sample relative to stem-like cells in normal samples in each tissue plotted against the malignancy continuum. Samples are colored based on if they are from different disease stage. |
Top |
Malignant transformation related pathway analysis |
| Find out the enriched GO biological processes and KEGG pathways involved in transition from healthy to precancer to cancer |
| Tissue | Disease Stage | Enriched GO biological Processes |
| Colorectum | AD |  |
| Colorectum | SER |  |
| Colorectum | MSS |  |
| Colorectum | MSI-H |  |
| Colorectum | FAP |  |
| ∗Top 15 enriched GO BP terms are showed in the bar plot of each disease state in each tissue. Each row represents a significant GO biological process which is colored according to the -log10(p.adjust). |
| Page: 1 2 3 4 5 6 7 8 9 |
| GO ID | Tissue | Disease Stage | Description | Gene Ratio | Bg Ratio | pvalue | p.adjust | Count |
| Page: 1 |
| Pathway ID | Tissue | Disease Stage | Description | Gene Ratio | Bg Ratio | pvalue | p.adjust | qvalue | Count |
| Page: 1 |
Top |
Cell-cell communication analysis |
| Identification of potential cell-cell interactions between two cell types and their ligand-receptor pairs for different disease states |
| Ligand | Receptor | LRpair | Pathway | Tissue | Disease Stage |
| Page: 1 |
Top |
Single-cell gene regulatory network inference analysis |
| Find out the significant the regulons (TFs) and the target genes of each regulon across cell types for different disease states |
| TF | Cell Type | Tissue | Disease Stage | Target Gene | RSS | Regulon Activity |
| ∗The dot plots of a searched regulon are shown for all cell subpopulations in each disease state of each tissue based on the regulon specific score inferred using pySCENIC and by calculating the average expression. |
| Page: 1 |
Top |
Somatic mutation of malignant transformation related genes |
| Annotation of somatic variants for genes involved in malignant transformation |
| Hugo Symbol | Variant Class | Variant Classification | dbSNP RS | HGVSc | HGVSp | HGVSp Short | SWISSPROT | BIOTYPE | SIFT | PolyPhen | Tumor Sample Barcode | Tissue | Histology | Sex | Age | Stage | Therapy Types | Drugs | Outcome |
| DNPEP | SNV | Missense_Mutation | novel | c.559N>T | p.Ile187Phe | p.I187F | protein_coding | deleterious(0) | probably_damaging(0.998) | TCGA-A2-A3KC-01 | Breast | breast invasive carcinoma | Female | <65 | I/II | Chemotherapy | adriamycin | SD | |
| DNPEP | SNV | Missense_Mutation | novel | c.214N>A | p.Glu72Lys | p.E72K | protein_coding | tolerated(0.06) | benign(0.056) | TCGA-BH-A0B6-01 | Breast | breast invasive carcinoma | Female | <65 | I/II | Unknown | Unknown | SD | |
| DNPEP | SNV | Missense_Mutation | c.278N>A | p.Ala93Asp | p.A93D | protein_coding | deleterious(0) | probably_damaging(0.966) | TCGA-BH-A0HP-01 | Breast | breast invasive carcinoma | Female | >=65 | III/IV | Chemotherapy | doxorubicin | SD | ||
| DNPEP | SNV | Missense_Mutation | novel | c.590T>G | p.Phe197Cys | p.F197C | protein_coding | deleterious(0) | probably_damaging(0.998) | TCGA-BH-AB28-01 | Breast | breast invasive carcinoma | Female | <65 | III/IV | Chemotherapy | taxotere | SD | |
| DNPEP | SNV | Missense_Mutation | c.958G>C | p.Glu320Gln | p.E320Q | protein_coding | deleterious(0.01) | probably_damaging(0.957) | TCGA-EW-A1J5-01 | Breast | breast invasive carcinoma | Female | <65 | I/II | Chemotherapy | adriamycin | SD | ||
| DNPEP | SNV | Missense_Mutation | novel | c.341A>G | p.Asp114Gly | p.D114G | protein_coding | deleterious(0) | probably_damaging(0.998) | TCGA-2W-A8YY-01 | Cervix | cervical & endocervical cancer | Female | <65 | I/II | Chemotherapy | cisplatin | CR | |
| DNPEP | SNV | Missense_Mutation | novel | c.828N>G | p.Ile276Met | p.I276M | protein_coding | deleterious(0) | probably_damaging(0.945) | TCGA-VS-A958-01 | Cervix | cervical & endocervical cancer | Female | <65 | I/II | Chemotherapy | cisplatin | CR | |
| DNPEP | SNV | Missense_Mutation | rs781324438 | c.1168G>A | p.Val390Met | p.V390M | protein_coding | deleterious(0) | probably_damaging(0.994) | TCGA-AA-3663-01 | Colorectum | colon adenocarcinoma | Male | <65 | I/II | Unknown | Unknown | SD | |
| DNPEP | SNV | Missense_Mutation | c.583G>A | p.Glu195Lys | p.E195K | protein_coding | tolerated(0.15) | possibly_damaging(0.703) | TCGA-AA-3680-01 | Colorectum | colon adenocarcinoma | Female | >=65 | III/IV | Chemotherapy | folinic | PD | ||
| DNPEP | SNV | Missense_Mutation | c.1196N>T | p.Tyr399Phe | p.Y399F | protein_coding | deleterious(0) | probably_damaging(0.992) | TCGA-AA-3811-01 | Colorectum | colon adenocarcinoma | Female | >=65 | III/IV | Unknown | Unknown | PD |
| Page: 1 2 3 4 |
Top |
Related drugs of malignant transformation related genes |
| Identification of chemicals and drugs interact with genes involved in malignant transfromation |
| (DGIdb 4.0) |
| Entrez ID | Symbol | Category | Interaction Types | Drug Claim Name | Drug Name | PMIDs |
| 23549 | DNPEP | ENZYME, NEUTRAL ZINC METALLOPEPTIDASE, DRUGGABLE GENOME, PROTEASE | inhibitor | 252166877 | ||
| 23549 | DNPEP | ENZYME, NEUTRAL ZINC METALLOPEPTIDASE, DRUGGABLE GENOME, PROTEASE | QGC-001 | |||
| 23549 | DNPEP | ENZYME, NEUTRAL ZINC METALLOPEPTIDASE, DRUGGABLE GENOME, PROTEASE | inhibitor | CHEMBL2103847 | TOSEDOSTAT |
| Page: 1 |

Copyright 2023-Present -The University of Texas Health Science Center at Houston |