
|
|||||
|
 | |
| |
| |
| |
| |
| |
|
Gene: DHX32 |
Gene summary for DHX32 |
| Gene information | Species | Human | Gene symbol | DHX32 | Gene ID | 55760 |
| Gene name | DEAH-box helicase 32 (putative) | |
| Gene Alias | DDX32 | |
| Cytomap | 10q26.2 | |
| Gene Type | protein-coding | GO ID | GO:0005575 | UniProtAcc | Q7L7V1 |
Top |
Malignant transformation analysis |
| Identification of the aberrant gene expression in precancerous and cancerous lesions by comparing the gene expression of stem-like cells in diseased tissues with normal stem cells |
| Entrez ID | Symbol | Replicates | Species | Organ | Tissue | Adj P-value | Log2FC | Malignancy |
| 55760 | DHX32 | S027 | Human | Liver | HCC | 2.57e-09 | 7.71e-01 | 0.2446 |
| 55760 | DHX32 | S028 | Human | Liver | HCC | 4.26e-14 | 6.10e-01 | 0.2503 |
| 55760 | DHX32 | S029 | Human | Liver | HCC | 3.19e-12 | 5.94e-01 | 0.2581 |
| 55760 | DHX32 | RNA-P25T1-P25T1-1 | Human | Lung | AIS | 1.99e-12 | 7.09e-01 | -0.2116 |
| 55760 | DHX32 | RNA-P25T1-P25T1-2 | Human | Lung | AIS | 1.33e-04 | 6.59e-01 | -0.1941 |
| 55760 | DHX32 | RNA-P25T1-P25T1-3 | Human | Lung | AIS | 2.46e-05 | 7.09e-01 | -0.2107 |
| 55760 | DHX32 | RNA-P25T1-P25T1-4 | Human | Lung | AIS | 9.63e-08 | 6.50e-01 | -0.2119 |
| 55760 | DHX32 | RNA-P3T-P3T-1 | Human | Lung | IAC | 3.90e-04 | 5.22e-01 | 0.1829 |
| 55760 | DHX32 | RNA-P3T-P3T-4 | Human | Lung | IAC | 1.24e-03 | 4.46e-01 | 0.1859 |
| 55760 | DHX32 | RNA-P6T2-P6T2-3 | Human | Lung | IAC | 2.99e-07 | 2.71e-01 | -0.013 |
| 55760 | DHX32 | C04 | Human | Oral cavity | OSCC | 3.41e-03 | 3.86e-01 | 0.2633 |
| 55760 | DHX32 | C21 | Human | Oral cavity | OSCC | 2.48e-15 | 5.44e-01 | 0.2678 |
| 55760 | DHX32 | C30 | Human | Oral cavity | OSCC | 4.08e-22 | 8.31e-01 | 0.3055 |
| 55760 | DHX32 | C38 | Human | Oral cavity | OSCC | 1.70e-04 | 4.70e-01 | 0.172 |
| 55760 | DHX32 | C43 | Human | Oral cavity | OSCC | 1.96e-03 | 1.54e-01 | 0.1704 |
| 55760 | DHX32 | C46 | Human | Oral cavity | OSCC | 1.15e-02 | 1.30e-01 | 0.1673 |
| 55760 | DHX32 | C51 | Human | Oral cavity | OSCC | 1.54e-03 | 2.57e-01 | 0.2674 |
| 55760 | DHX32 | C57 | Human | Oral cavity | OSCC | 1.35e-04 | 2.84e-01 | 0.1679 |
| 55760 | DHX32 | C08 | Human | Oral cavity | OSCC | 2.38e-06 | 1.83e-01 | 0.1919 |
| 55760 | DHX32 | EOLP-1 | Human | Oral cavity | EOLP | 3.46e-02 | 1.47e-01 | -0.0202 |
| Page: 1 2 3 4 5 6 |
| Tissue | Expression Dynamics | Abbreviation |
| Colorectum (GSE201348) |  | FAP: Familial adenomatous polyposis |
| CRC: Colorectal cancer | ||
| Colorectum (HTA11) |  | AD: Adenomas |
| SER: Sessile serrated lesions | ||
| MSI-H: Microsatellite-high colorectal cancer | ||
| MSS: Microsatellite stable colorectal cancer | ||
| Esophagus |  | ESCC: Esophageal squamous cell carcinoma |
| HGIN: High-grade intraepithelial neoplasias | ||
| LGIN: Low-grade intraepithelial neoplasias | ||
| Liver | 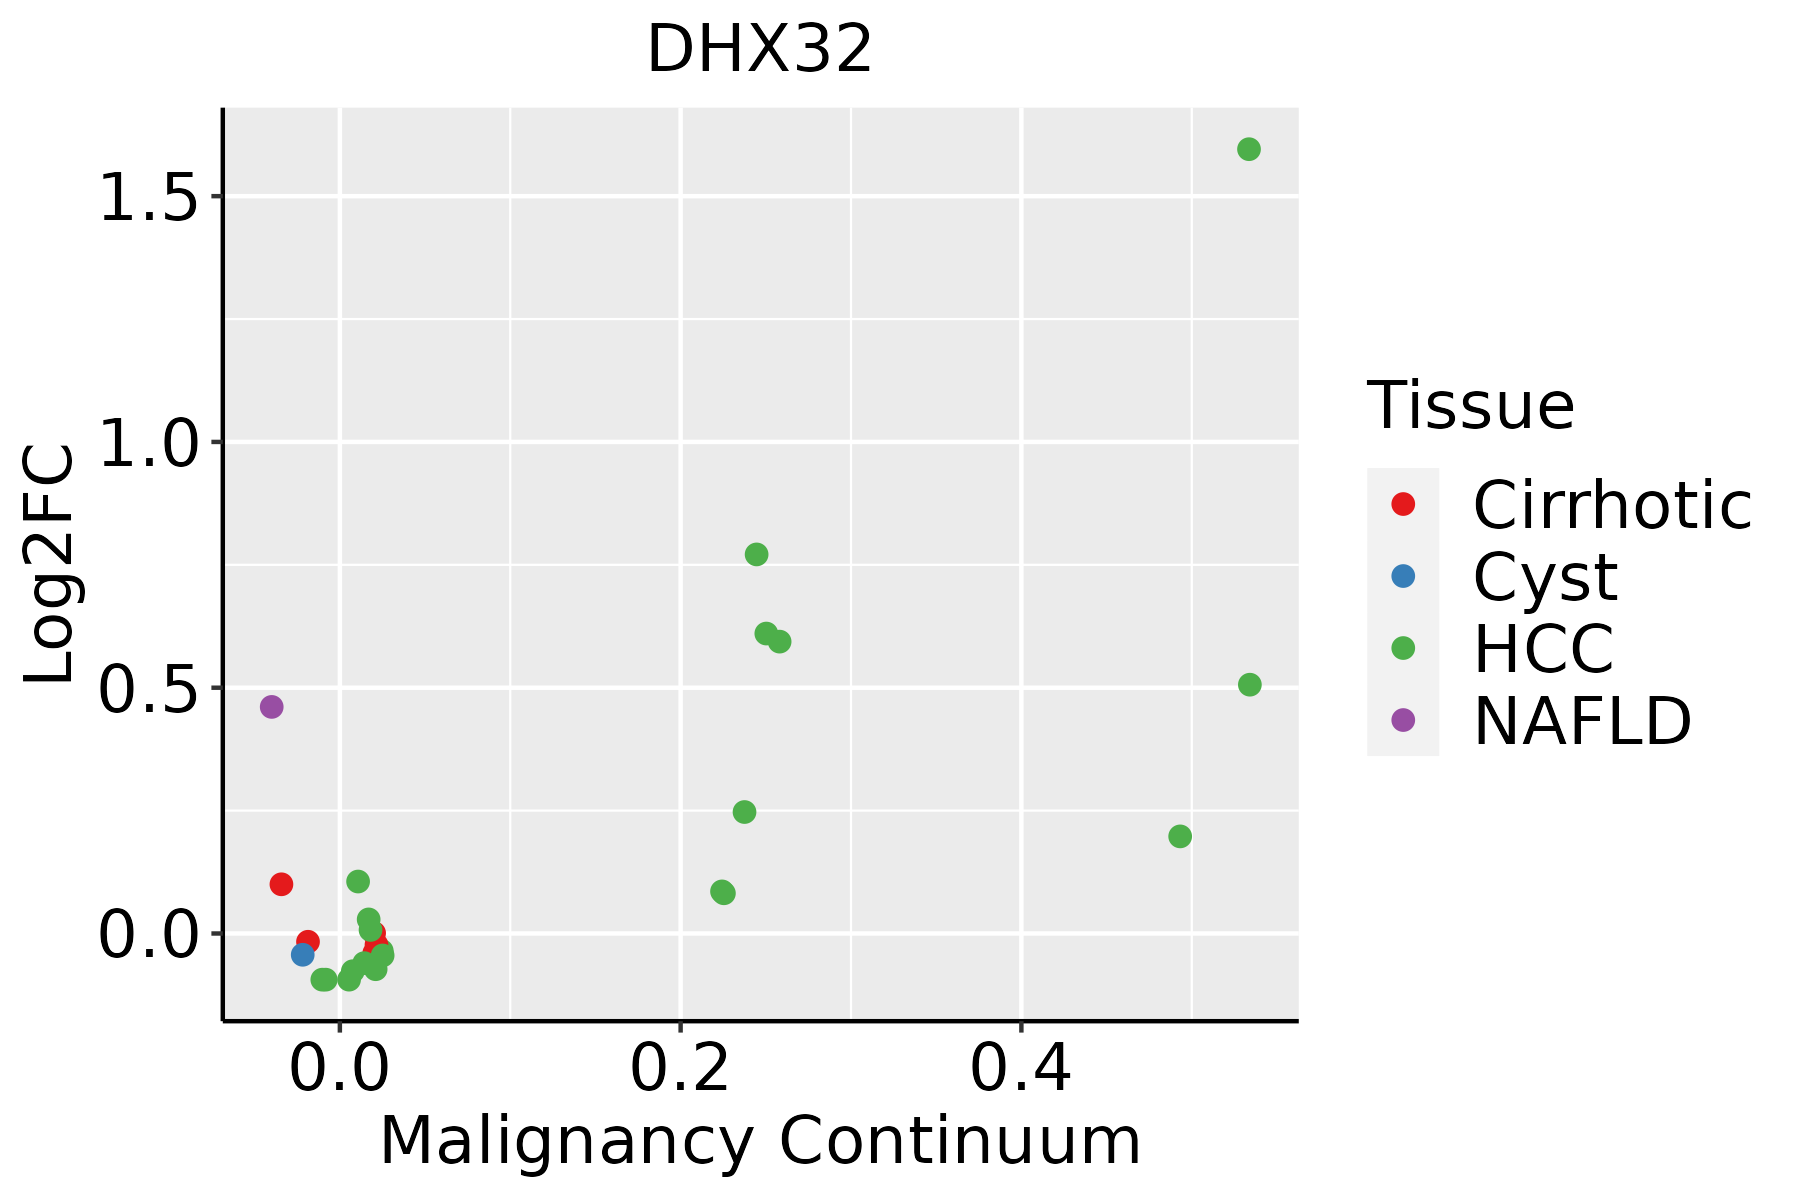 | HCC: Hepatocellular carcinoma |
| NAFLD: Non-alcoholic fatty liver disease | ||
| Lung |  | AAH: Atypical adenomatous hyperplasia |
| AIS: Adenocarcinoma in situ | ||
| IAC: Invasive lung adenocarcinoma | ||
| MIA: Minimally invasive adenocarcinoma | ||
| Oral Cavity | 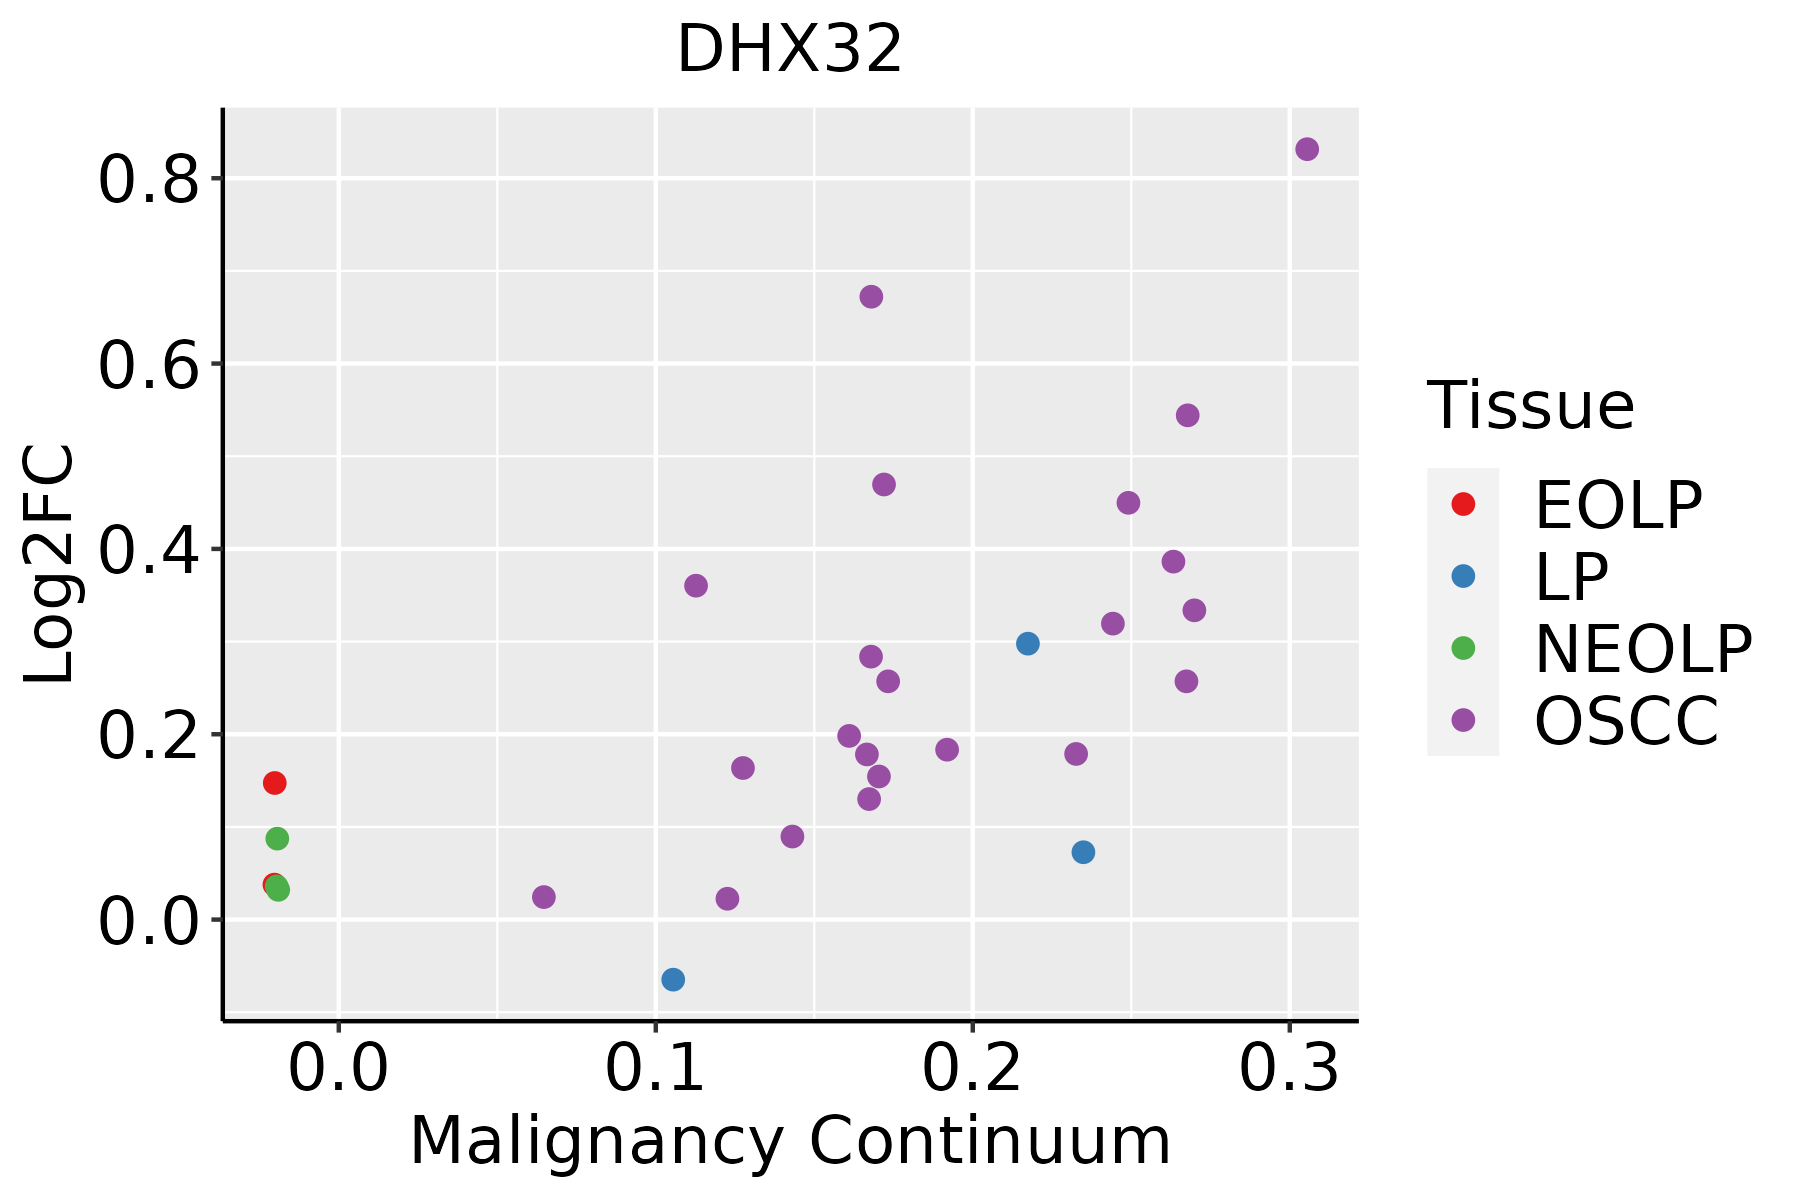 | EOLP: Erosive Oral lichen planus |
| LP: leukoplakia | ||
| NEOLP: Non-erosive oral lichen planus | ||
| OSCC: Oral squamous cell carcinoma | ||
| Thyroid | 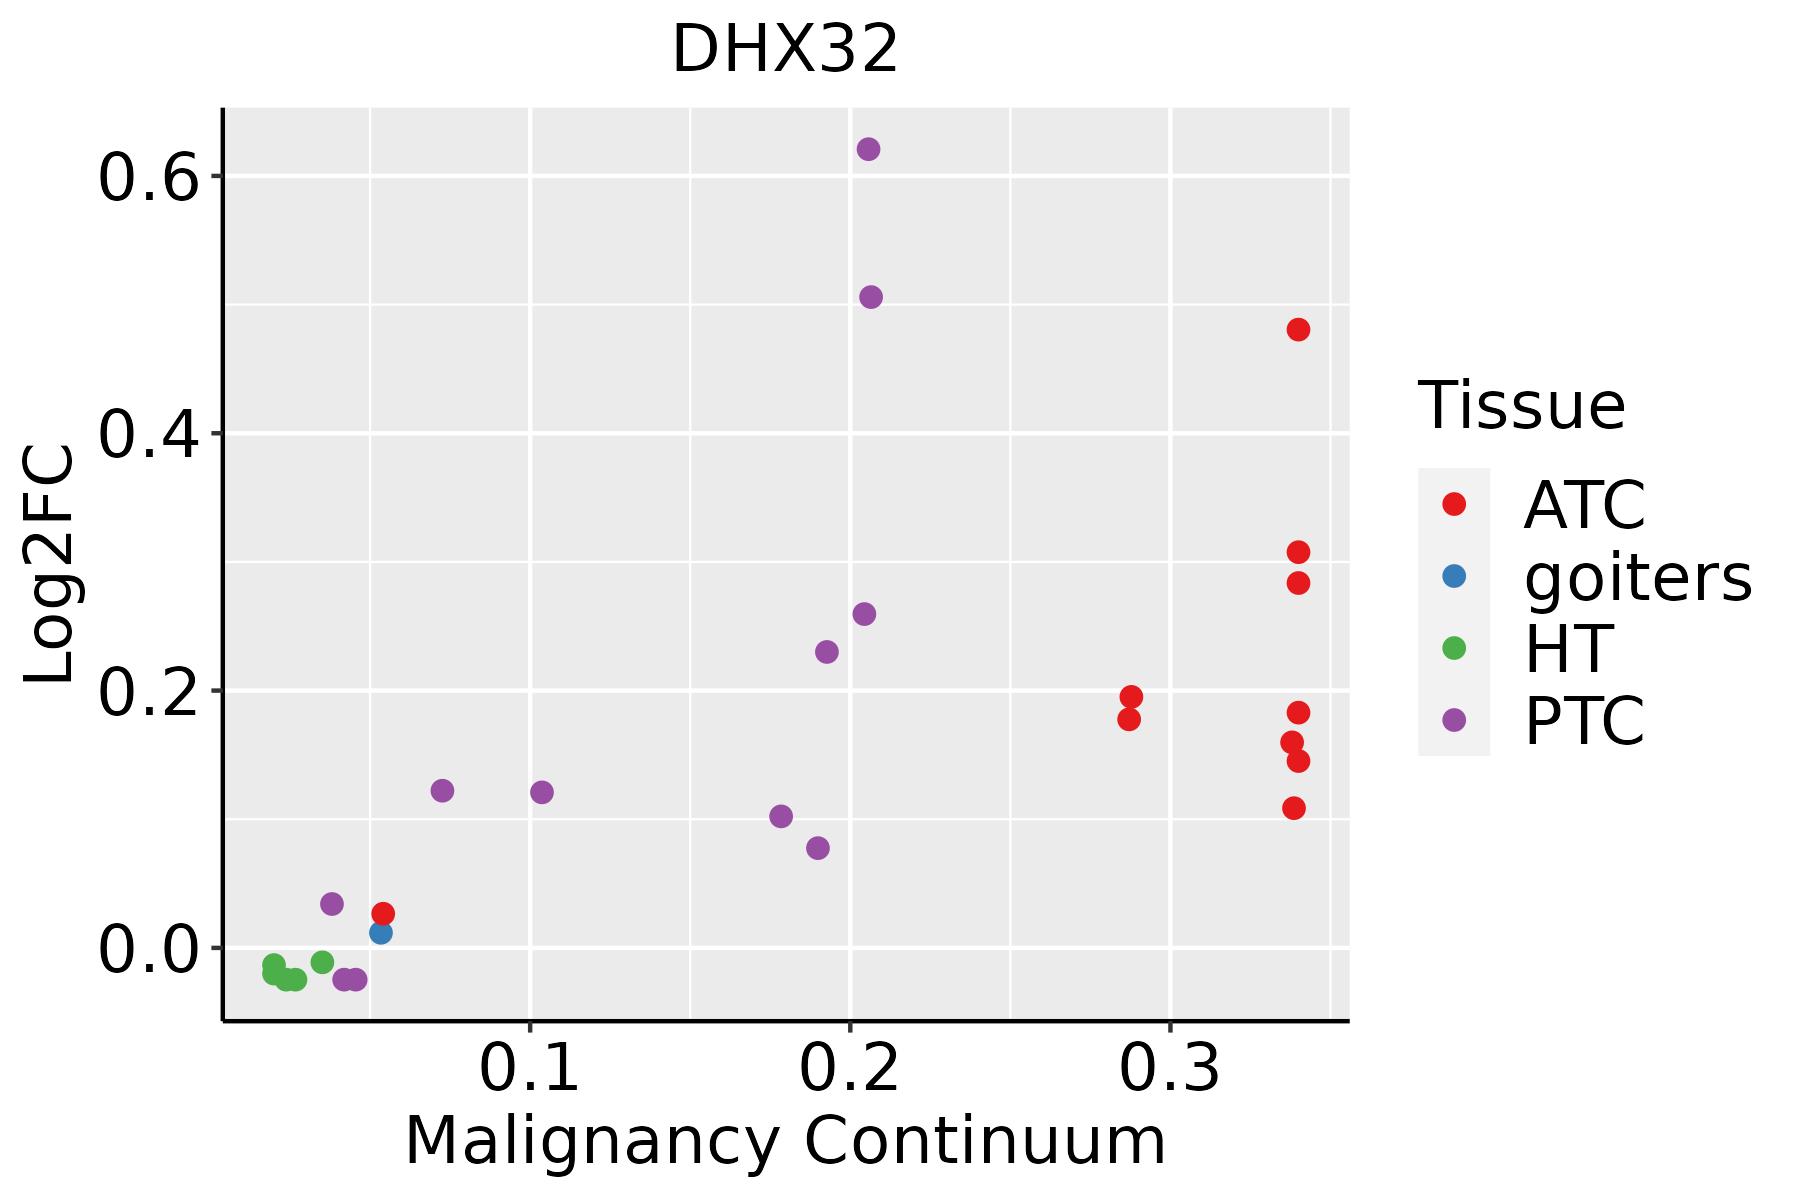 | ATC: Anaplastic thyroid cancer |
| HT: Hashimoto's thyroiditis | ||
| PTC: Papillary thyroid cancer |
| ∗log2FC in expression of this searched gene in stem-like cells from each diseased tissue sample relative to stem-like cells in normal samples in each tissue plotted against the malignancy continuum. Samples are colored based on if they are from different disease stage. |
Top |
Malignant transformation related pathway analysis |
| Find out the enriched GO biological processes and KEGG pathways involved in transition from healthy to precancer to cancer |
| Tissue | Disease Stage | Enriched GO biological Processes |
| Colorectum | AD |  |
| Colorectum | SER |  |
| Colorectum | MSS |  |
| Colorectum | MSI-H |  |
| Colorectum | FAP |  |
| ∗Top 15 enriched GO BP terms are showed in the bar plot of each disease state in each tissue. Each row represents a significant GO biological process which is colored according to the -log10(p.adjust). |
| Page: 1 2 3 4 5 6 7 8 9 |
| GO ID | Tissue | Disease Stage | Description | Gene Ratio | Bg Ratio | pvalue | p.adjust | Count |
| Page: 1 |
| Pathway ID | Tissue | Disease Stage | Description | Gene Ratio | Bg Ratio | pvalue | p.adjust | qvalue | Count |
| Page: 1 |
Top |
Cell-cell communication analysis |
| Identification of potential cell-cell interactions between two cell types and their ligand-receptor pairs for different disease states |
| Ligand | Receptor | LRpair | Pathway | Tissue | Disease Stage |
| Page: 1 |
Top |
Single-cell gene regulatory network inference analysis |
| Find out the significant the regulons (TFs) and the target genes of each regulon across cell types for different disease states |
| TF | Cell Type | Tissue | Disease Stage | Target Gene | RSS | Regulon Activity |
| ∗The dot plots of a searched regulon are shown for all cell subpopulations in each disease state of each tissue based on the regulon specific score inferred using pySCENIC and by calculating the average expression. |
| Page: 1 |
Top |
Somatic mutation of malignant transformation related genes |
| Annotation of somatic variants for genes involved in malignant transformation |
| Hugo Symbol | Variant Class | Variant Classification | dbSNP RS | HGVSc | HGVSp | HGVSp Short | SWISSPROT | BIOTYPE | SIFT | PolyPhen | Tumor Sample Barcode | Tissue | Histology | Sex | Age | Stage | Therapy Types | Drugs | Outcome |
| DHX32 | SNV | Missense_Mutation | rs749109426 | c.884N>T | p.Gly295Val | p.G295V | Q7L7V1 | protein_coding | tolerated(0.22) | benign(0.274) | TCGA-3C-AALI-01 | Breast | breast invasive carcinoma | Female | <65 | I/II | Unspecific | Poly E | Complete Response |
| DHX32 | SNV | Missense_Mutation | c.1867N>C | p.Gly623Arg | p.G623R | Q7L7V1 | protein_coding | deleterious(0) | probably_damaging(1) | TCGA-AN-A0FX-01 | Breast | breast invasive carcinoma | Female | <65 | I/II | Unknown | Unknown | SD | |
| DHX32 | SNV | Missense_Mutation | c.1498N>A | p.Phe500Ile | p.F500I | Q7L7V1 | protein_coding | deleterious(0) | possibly_damaging(0.832) | TCGA-BH-A0B8-01 | Breast | breast invasive carcinoma | Female | <65 | I/II | Hormone Therapy | arimidex | SD | |
| DHX32 | SNV | Missense_Mutation | c.1502N>C | p.Asp501Ala | p.D501A | Q7L7V1 | protein_coding | deleterious(0) | possibly_damaging(0.666) | TCGA-E2-A14O-01 | Breast | breast invasive carcinoma | Female | >=65 | III/IV | Hormone Therapy | arimidex | SD | |
| DHX32 | insertion | Nonsense_Mutation | novel | c.1463_1464insCTCCCCTCTGCATGTTAGGCTAAGATAAAATGTCTTCATT | p.Gln489SerfsTer9 | p.Q489Sfs*9 | Q7L7V1 | protein_coding | TCGA-A8-A06P-01 | Breast | breast invasive carcinoma | Female | <65 | III/IV | Unspecific | SD | |||
| DHX32 | insertion | Frame_Shift_Ins | novel | c.1834_1835insTCACCAAGAAGATGCCAGAGTGGGTCCTCTTCCATAAATTCAGCAT | p.Asn612IlefsTer37 | p.N612Ifs*37 | Q7L7V1 | protein_coding | TCGA-AO-A0JB-01 | Breast | breast invasive carcinoma | Female | <65 | III/IV | Chemotherapy | cyclophosphamide | SD | ||
| DHX32 | deletion | Frame_Shift_Del | novel | c.1037delT | p.Leu346Ter | p.L346* | Q7L7V1 | protein_coding | TCGA-D8-A27V-01 | Breast | breast invasive carcinoma | Female | <65 | I/II | Hormone Therapy | tamoxiphen | SD | ||
| DHX32 | SNV | Missense_Mutation | novel | c.740A>G | p.Tyr247Cys | p.Y247C | Q7L7V1 | protein_coding | deleterious(0) | possibly_damaging(0.514) | TCGA-2W-A8YY-01 | Cervix | cervical & endocervical cancer | Female | <65 | I/II | Chemotherapy | cisplatin | CR |
| DHX32 | SNV | Missense_Mutation | c.1593G>C | p.Leu531Phe | p.L531F | Q7L7V1 | protein_coding | tolerated(0.72) | benign(0.185) | TCGA-IR-A3LA-01 | Cervix | cervical & endocervical cancer | Female | <65 | I/II | Chemotherapy | cisplatin | CR | |
| DHX32 | SNV | Missense_Mutation | novel | c.1181C>T | p.Ser394Leu | p.S394L | Q7L7V1 | protein_coding | tolerated(0.65) | benign(0.01) | TCGA-VS-A9V5-01 | Cervix | cervical & endocervical cancer | Female | <65 | I/II | Chemotherapy | carboplatin | PD |
| Page: 1 2 3 4 5 6 7 |
Top |
Related drugs of malignant transformation related genes |
| Identification of chemicals and drugs interact with genes involved in malignant transfromation |
| (DGIdb 4.0) |
| Entrez ID | Symbol | Category | Interaction Types | Drug Claim Name | Drug Name | PMIDs |
| Page: 1 |

Copyright 2023-Present -The University of Texas Health Science Center at Houston |