
|
|||||
|
 | |
| |
| |
| |
| |
| |
|
Gene: DHRS7B |
Gene summary for DHRS7B |
| Gene information | Species | Human | Gene symbol | DHRS7B | Gene ID | 25979 |
| Gene name | dehydrogenase/reductase 7B | |
| Gene Alias | CGI-93 | |
| Cytomap | 17p11.2 | |
| Gene Type | protein-coding | GO ID | GO:0006629 | UniProtAcc | A0A0C4DGQ8 |
Top |
Malignant transformation analysis |
| Identification of the aberrant gene expression in precancerous and cancerous lesions by comparing the gene expression of stem-like cells in diseased tissues with normal stem cells |
| Entrez ID | Symbol | Replicates | Species | Organ | Tissue | Adj P-value | Log2FC | Malignancy |
| 25979 | DHRS7B | S029 | Human | Liver | HCC | 1.95e-23 | 1.29e+00 | 0.2581 |
| 25979 | DHRS7B | C04 | Human | Oral cavity | OSCC | 6.15e-13 | 8.56e-01 | 0.2633 |
| 25979 | DHRS7B | C21 | Human | Oral cavity | OSCC | 5.93e-34 | 1.05e+00 | 0.2678 |
| 25979 | DHRS7B | C30 | Human | Oral cavity | OSCC | 6.29e-18 | 8.27e-01 | 0.3055 |
| 25979 | DHRS7B | C38 | Human | Oral cavity | OSCC | 2.02e-07 | 6.58e-01 | 0.172 |
| 25979 | DHRS7B | C43 | Human | Oral cavity | OSCC | 3.09e-02 | 1.50e-01 | 0.1704 |
| 25979 | DHRS7B | C46 | Human | Oral cavity | OSCC | 2.26e-29 | 7.02e-01 | 0.1673 |
| 25979 | DHRS7B | C51 | Human | Oral cavity | OSCC | 5.78e-09 | 6.56e-01 | 0.2674 |
| 25979 | DHRS7B | C57 | Human | Oral cavity | OSCC | 2.75e-06 | 2.58e-01 | 0.1679 |
| 25979 | DHRS7B | C06 | Human | Oral cavity | OSCC | 6.73e-04 | 7.93e-01 | 0.2699 |
| 25979 | DHRS7B | C08 | Human | Oral cavity | OSCC | 8.71e-17 | 4.41e-01 | 0.1919 |
| 25979 | DHRS7B | C09 | Human | Oral cavity | OSCC | 2.95e-07 | 2.83e-01 | 0.1431 |
| 25979 | DHRS7B | LN22 | Human | Oral cavity | OSCC | 3.67e-11 | 7.72e-01 | 0.1733 |
| 25979 | DHRS7B | LN38 | Human | Oral cavity | OSCC | 3.17e-02 | 5.47e-01 | 0.168 |
| 25979 | DHRS7B | LN46 | Human | Oral cavity | OSCC | 9.11e-23 | 8.56e-01 | 0.1666 |
| 25979 | DHRS7B | LP15 | Human | Oral cavity | LP | 1.29e-05 | 8.24e-01 | 0.2174 |
| 25979 | DHRS7B | LP17 | Human | Oral cavity | LP | 1.53e-02 | 4.16e-01 | 0.2349 |
| 25979 | DHRS7B | SYSMH2 | Human | Oral cavity | OSCC | 5.12e-10 | 4.65e-01 | 0.2326 |
| 25979 | DHRS7B | SYSMH3 | Human | Oral cavity | OSCC | 1.30e-20 | 6.39e-01 | 0.2442 |
| 25979 | DHRS7B | SYSMH6 | Human | Oral cavity | OSCC | 5.86e-04 | 2.37e-01 | 0.1275 |
| Page: 1 2 3 4 5 6 |
| Tissue | Expression Dynamics | Abbreviation |
| Colorectum (GSE201348) |  | FAP: Familial adenomatous polyposis |
| CRC: Colorectal cancer | ||
| Colorectum (HTA11) |  | AD: Adenomas |
| SER: Sessile serrated lesions | ||
| MSI-H: Microsatellite-high colorectal cancer | ||
| MSS: Microsatellite stable colorectal cancer | ||
| Esophagus | 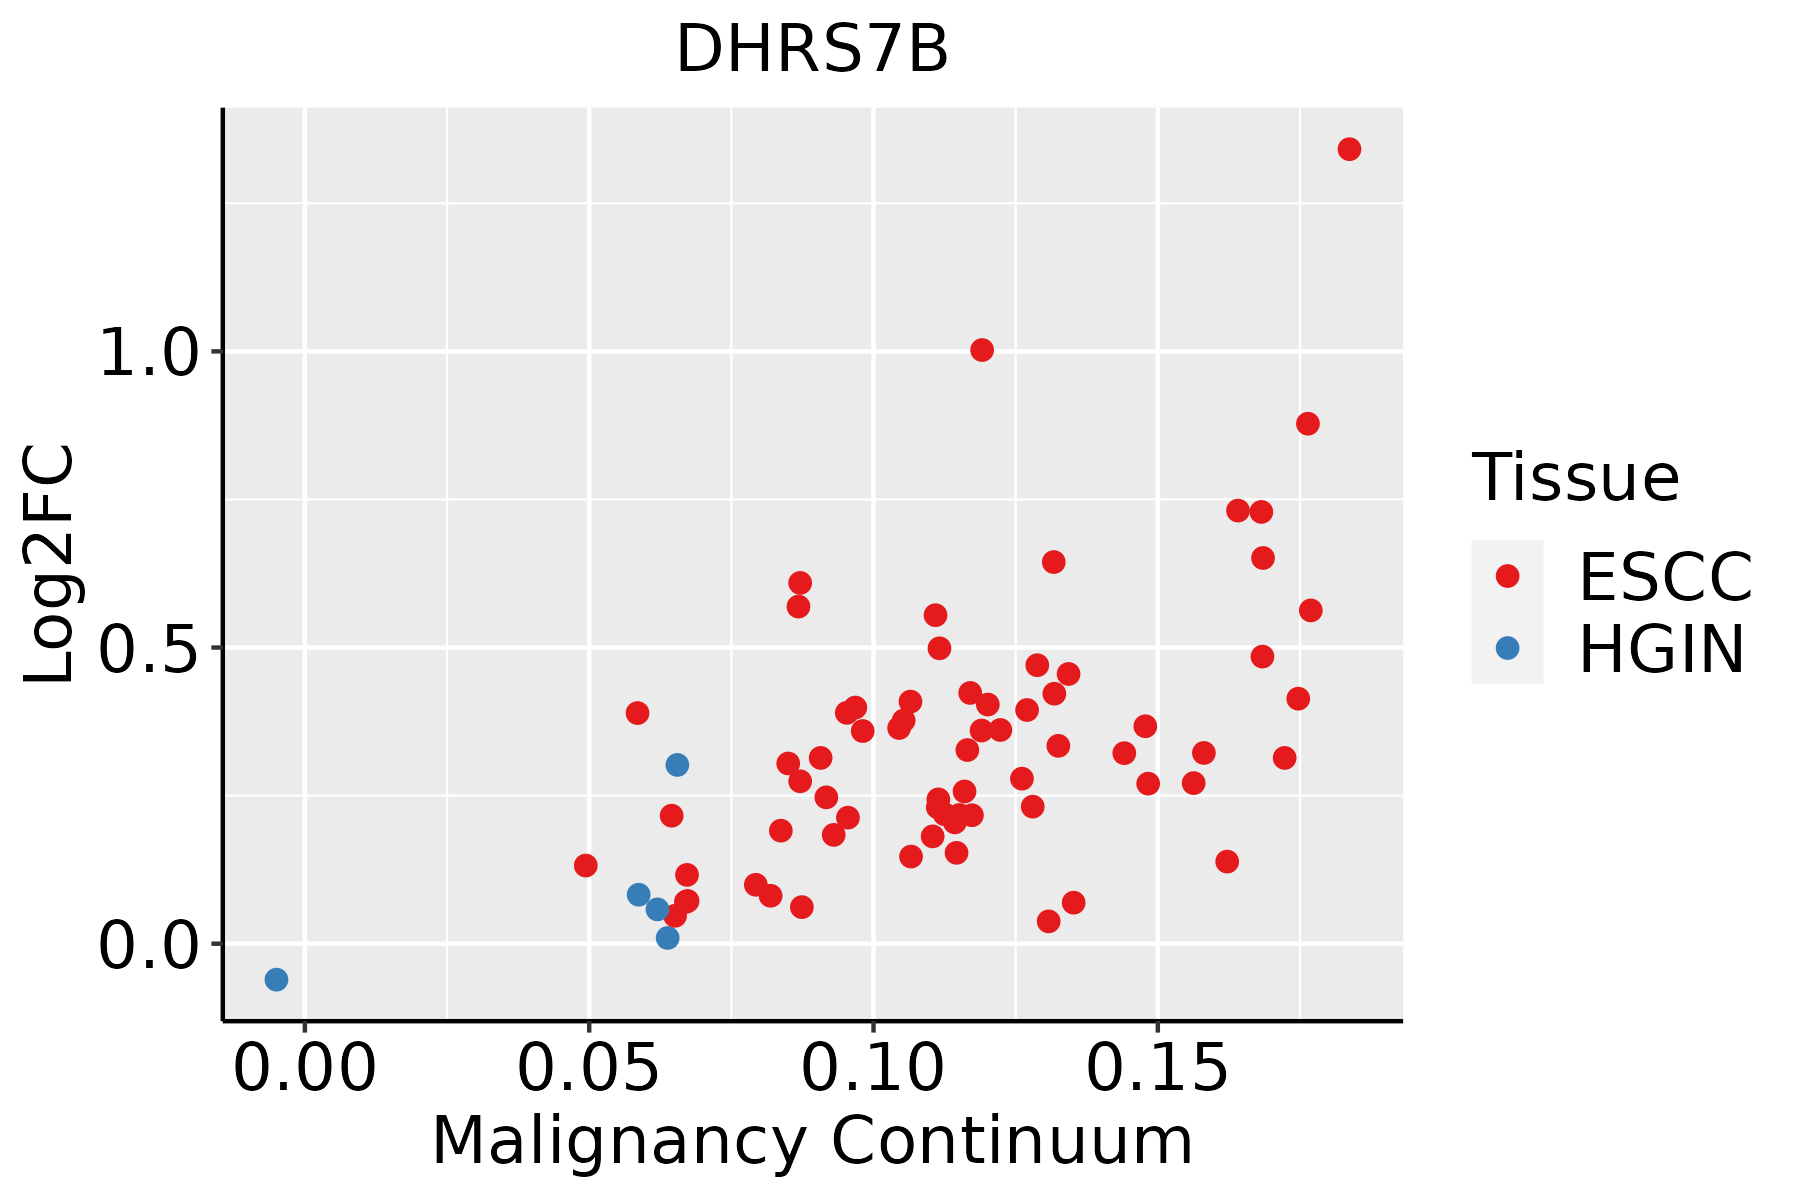 | ESCC: Esophageal squamous cell carcinoma |
| HGIN: High-grade intraepithelial neoplasias | ||
| LGIN: Low-grade intraepithelial neoplasias | ||
| Liver |  | HCC: Hepatocellular carcinoma |
| NAFLD: Non-alcoholic fatty liver disease | ||
| Oral Cavity | 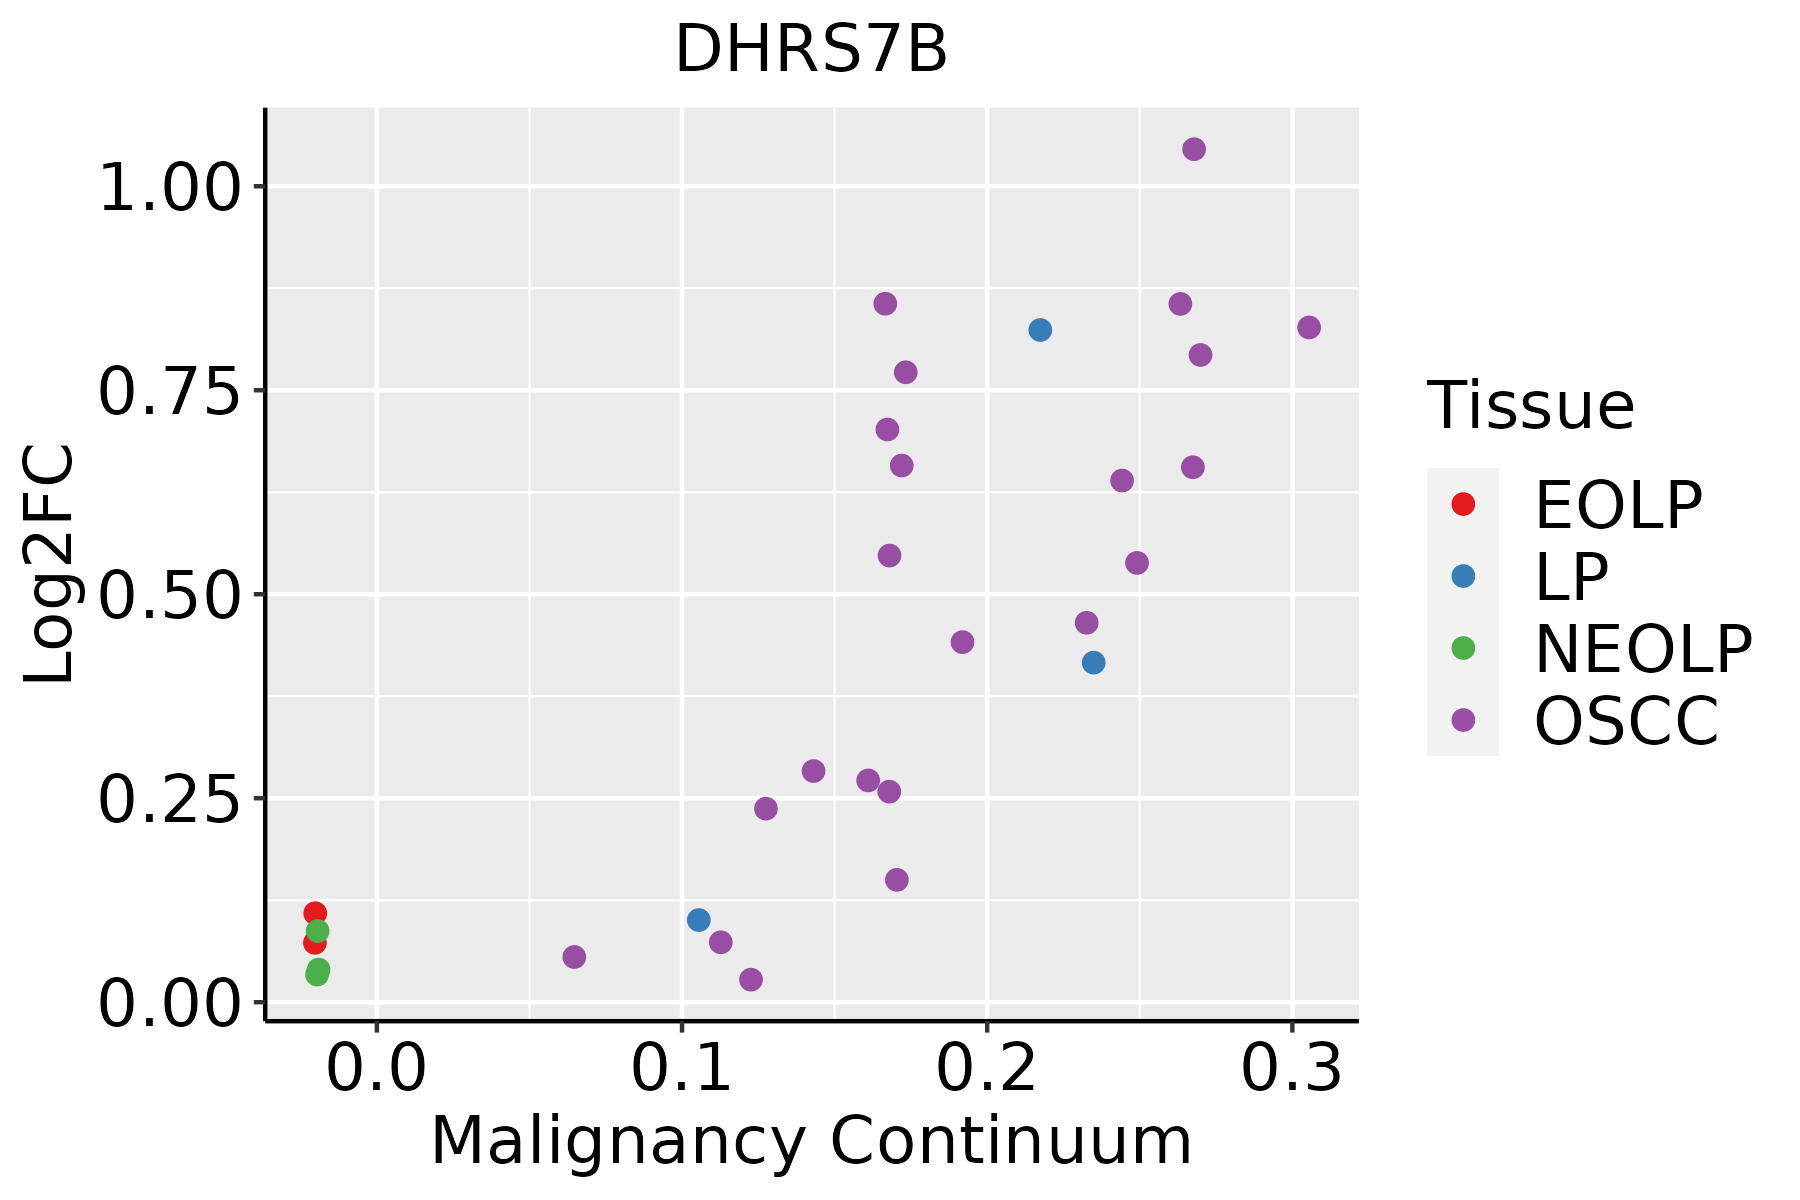 | EOLP: Erosive Oral lichen planus |
| LP: leukoplakia | ||
| NEOLP: Non-erosive oral lichen planus | ||
| OSCC: Oral squamous cell carcinoma | ||
| Thyroid |  | ATC: Anaplastic thyroid cancer |
| HT: Hashimoto's thyroiditis | ||
| PTC: Papillary thyroid cancer |
| ∗log2FC in expression of this searched gene in stem-like cells from each diseased tissue sample relative to stem-like cells in normal samples in each tissue plotted against the malignancy continuum. Samples are colored based on if they are from different disease stage. |
Top |
Malignant transformation related pathway analysis |
| Find out the enriched GO biological processes and KEGG pathways involved in transition from healthy to precancer to cancer |
| Tissue | Disease Stage | Enriched GO biological Processes |
| Colorectum | AD |  |
| Colorectum | SER |  |
| Colorectum | MSS |  |
| Colorectum | MSI-H |  |
| Colorectum | FAP |  |
| ∗Top 15 enriched GO BP terms are showed in the bar plot of each disease state in each tissue. Each row represents a significant GO biological process which is colored according to the -log10(p.adjust). |
| Page: 1 2 3 4 5 6 7 8 9 |
| GO ID | Tissue | Disease Stage | Description | Gene Ratio | Bg Ratio | pvalue | p.adjust | Count |
| GO:0018904 | Colorectum | AD | ether metabolic process | 14/3918 | 27/18723 | 3.72e-04 | 4.29e-03 | 14 |
| GO:0006662 | Colorectum | AD | glycerol ether metabolic process | 12/3918 | 22/18723 | 5.38e-04 | 5.74e-03 | 12 |
| GO:0046485 | Colorectum | AD | ether lipid metabolic process | 10/3918 | 20/18723 | 3.67e-03 | 2.60e-02 | 10 |
| GO:00066621 | Colorectum | SER | glycerol ether metabolic process | 9/2897 | 22/18723 | 3.66e-03 | 3.06e-02 | 9 |
| GO:00189041 | Colorectum | SER | ether metabolic process | 10/2897 | 27/18723 | 5.18e-03 | 3.95e-02 | 10 |
| GO:00189042 | Colorectum | FAP | ether metabolic process | 10/2622 | 27/18723 | 2.46e-03 | 1.95e-02 | 10 |
| GO:00066622 | Colorectum | FAP | glycerol ether metabolic process | 8/2622 | 22/18723 | 7.51e-03 | 4.47e-02 | 8 |
| GO:00464851 | Colorectum | CRC | ether lipid metabolic process | 7/2078 | 20/18723 | 4.30e-03 | 3.47e-02 | 7 |
| GO:00189043 | Colorectum | CRC | ether metabolic process | 8/2078 | 27/18723 | 7.26e-03 | 4.98e-02 | 8 |
| GO:0008611 | Oral cavity | LP | ether lipid biosynthetic process | 7/4623 | 11/18723 | 7.01e-03 | 3.96e-02 | 7 |
| GO:0046504 | Oral cavity | LP | glycerol ether biosynthetic process | 7/4623 | 11/18723 | 7.01e-03 | 3.96e-02 | 7 |
| GO:0097384 | Oral cavity | LP | cellular lipid biosynthetic process | 7/4623 | 11/18723 | 7.01e-03 | 3.96e-02 | 7 |
| Page: 1 |
| Pathway ID | Tissue | Disease Stage | Description | Gene Ratio | Bg Ratio | pvalue | p.adjust | qvalue | Count |
| Page: 1 |
Top |
Cell-cell communication analysis |
| Identification of potential cell-cell interactions between two cell types and their ligand-receptor pairs for different disease states |
| Ligand | Receptor | LRpair | Pathway | Tissue | Disease Stage |
| Page: 1 |
Top |
Single-cell gene regulatory network inference analysis |
| Find out the significant the regulons (TFs) and the target genes of each regulon across cell types for different disease states |
| TF | Cell Type | Tissue | Disease Stage | Target Gene | RSS | Regulon Activity |
| ∗The dot plots of a searched regulon are shown for all cell subpopulations in each disease state of each tissue based on the regulon specific score inferred using pySCENIC and by calculating the average expression. |
| Page: 1 |
Top |
Somatic mutation of malignant transformation related genes |
| Annotation of somatic variants for genes involved in malignant transformation |
| Hugo Symbol | Variant Class | Variant Classification | dbSNP RS | HGVSc | HGVSp | HGVSp Short | SWISSPROT | BIOTYPE | SIFT | PolyPhen | Tumor Sample Barcode | Tissue | Histology | Sex | Age | Stage | Therapy Types | Drugs | Outcome |
| DHRS7B | SNV | Missense_Mutation | c.556C>A | p.Gln186Lys | p.Q186K | Q6IAN0 | protein_coding | tolerated(0.24) | benign(0.005) | TCGA-D8-A1XK-01 | Breast | breast invasive carcinoma | Female | <65 | I/II | Chemotherapy | doxorubicine+cyclophosphamide | SD | |
| DHRS7B | SNV | Missense_Mutation | novel | c.734C>T | p.Ser245Phe | p.S245F | Q6IAN0 | protein_coding | deleterious(0) | probably_damaging(0.968) | TCGA-EA-A43B-01 | Cervix | cervical & endocervical cancer | Female | <65 | I/II | Chemotherapy | cisplatin | CR |
| DHRS7B | SNV | Missense_Mutation | c.901N>G | p.Arg301Gly | p.R301G | Q6IAN0 | protein_coding | deleterious(0) | probably_damaging(0.998) | TCGA-FU-A3HZ-01 | Cervix | cervical & endocervical cancer | Female | <65 | I/II | Chemotherapy | cisplatin | CR | |
| DHRS7B | SNV | Missense_Mutation | novel | c.305N>A | p.Thr102Asn | p.T102N | Q6IAN0 | protein_coding | tolerated(0.51) | benign(0.005) | TCGA-A5-A0G1-01 | Endometrium | uterine corpus endometrioid carcinoma | Female | >=65 | I/II | Unknown | Unknown | SD |
| DHRS7B | SNV | Missense_Mutation | rs758778438 | c.251N>A | p.Arg84Gln | p.R84Q | Q6IAN0 | protein_coding | deleterious(0) | probably_damaging(0.999) | TCGA-A5-A0G2-01 | Endometrium | uterine corpus endometrioid carcinoma | Female | <65 | III/IV | Unknown | Unknown | SD |
| DHRS7B | SNV | Missense_Mutation | novel | c.356N>A | p.Ser119Tyr | p.S119Y | Q6IAN0 | protein_coding | tolerated(0.83) | benign(0.357) | TCGA-A5-A0G2-01 | Endometrium | uterine corpus endometrioid carcinoma | Female | <65 | III/IV | Unknown | Unknown | SD |
| DHRS7B | SNV | Missense_Mutation | novel | c.806N>A | p.Pro269His | p.P269H | Q6IAN0 | protein_coding | deleterious(0) | probably_damaging(0.915) | TCGA-A5-A2K3-01 | Endometrium | uterine corpus endometrioid carcinoma | Female | >=65 | I/II | Chemotherapy | carboplatin | SD |
| DHRS7B | SNV | Missense_Mutation | c.260N>T | p.Gly87Val | p.G87V | Q6IAN0 | protein_coding | deleterious(0.05) | benign(0.038) | TCGA-AP-A051-01 | Endometrium | uterine corpus endometrioid carcinoma | Female | >=65 | I/II | Unknown | Unknown | SD | |
| DHRS7B | SNV | Missense_Mutation | c.902N>A | p.Arg301Gln | p.R301Q | Q6IAN0 | protein_coding | deleterious(0) | probably_damaging(0.998) | TCGA-AP-A059-01 | Endometrium | uterine corpus endometrioid carcinoma | Female | >=65 | I/II | Unknown | Unknown | SD | |
| DHRS7B | SNV | Missense_Mutation | novel | c.838N>A | p.Val280Met | p.V280M | Q6IAN0 | protein_coding | deleterious(0.02) | possibly_damaging(0.648) | TCGA-AP-A1DK-01 | Endometrium | uterine corpus endometrioid carcinoma | Female | <65 | I/II | Unknown | Unknown | SD |
| Page: 1 2 3 4 |
Top |
Related drugs of malignant transformation related genes |
| Identification of chemicals and drugs interact with genes involved in malignant transfromation |
| (DGIdb 4.0) |
| Entrez ID | Symbol | Category | Interaction Types | Drug Claim Name | Drug Name | PMIDs |
| Page: 1 |

Copyright 2023-Present -The University of Texas Health Science Center at Houston |