
|
|||||
|
 | |
| |
| |
| |
| |
| |
|
Gene: CPNE3 |
Gene summary for CPNE3 |
| Gene information | Species | Human | Gene symbol | CPNE3 | Gene ID | 8895 |
| Gene name | copine 3 | |
| Gene Alias | CPN3 | |
| Cytomap | 8q21.3 | |
| Gene Type | protein-coding | GO ID | GO:0006464 | UniProtAcc | A0A024R994 |
Top |
Malignant transformation analysis |
| Identification of the aberrant gene expression in precancerous and cancerous lesions by comparing the gene expression of stem-like cells in diseased tissues with normal stem cells |
| Entrez ID | Symbol | Replicates | Species | Organ | Tissue | Adj P-value | Log2FC | Malignancy |
| 8895 | CPNE3 | P83T-E | Human | Esophagus | ESCC | 3.77e-39 | 1.20e+00 | 0.1738 |
| 8895 | CPNE3 | P84T-E | Human | Esophagus | ESCC | 1.75e-22 | 1.41e+00 | 0.0933 |
| 8895 | CPNE3 | P89T-E | Human | Esophagus | ESCC | 7.69e-27 | 1.89e+00 | 0.1752 |
| 8895 | CPNE3 | P91T-E | Human | Esophagus | ESCC | 9.94e-14 | 1.60e+00 | 0.1828 |
| 8895 | CPNE3 | P104T-E | Human | Esophagus | ESCC | 4.53e-02 | 4.29e-01 | 0.0931 |
| 8895 | CPNE3 | P107T-E | Human | Esophagus | ESCC | 5.47e-57 | 1.38e+00 | 0.171 |
| 8895 | CPNE3 | P126T-E | Human | Esophagus | ESCC | 4.75e-10 | 1.09e+00 | 0.1125 |
| 8895 | CPNE3 | P127T-E | Human | Esophagus | ESCC | 1.53e-35 | 6.58e-01 | 0.0826 |
| 8895 | CPNE3 | P128T-E | Human | Esophagus | ESCC | 2.76e-67 | 2.40e+00 | 0.1241 |
| 8895 | CPNE3 | P130T-E | Human | Esophagus | ESCC | 2.22e-73 | 1.89e+00 | 0.1676 |
| 8895 | CPNE3 | HCC1_Meng | Human | Liver | HCC | 2.52e-80 | 3.12e-01 | 0.0246 |
| 8895 | CPNE3 | HCC2_Meng | Human | Liver | HCC | 3.22e-45 | 3.53e-01 | 0.0107 |
| 8895 | CPNE3 | cirrhotic1 | Human | Liver | Cirrhotic | 1.73e-09 | 1.84e-01 | 0.0202 |
| 8895 | CPNE3 | cirrhotic2 | Human | Liver | Cirrhotic | 3.43e-07 | 1.19e-01 | 0.0201 |
| 8895 | CPNE3 | cirrhotic3 | Human | Liver | Cirrhotic | 2.73e-08 | 2.05e-01 | 0.0215 |
| 8895 | CPNE3 | HCC1 | Human | Liver | HCC | 1.07e-09 | 3.95e+00 | 0.5336 |
| 8895 | CPNE3 | HCC2 | Human | Liver | HCC | 4.97e-35 | 5.47e+00 | 0.5341 |
| 8895 | CPNE3 | Pt13.a | Human | Liver | HCC | 5.20e-04 | 2.69e-01 | 0.021 |
| 8895 | CPNE3 | Pt13.b | Human | Liver | HCC | 5.51e-23 | 3.47e-01 | 0.0251 |
| 8895 | CPNE3 | Pt14.b | Human | Liver | HCC | 2.40e-04 | 2.06e-01 | 0.018 |
| Page: 1 2 3 4 5 6 7 8 |
| Tissue | Expression Dynamics | Abbreviation |
| Breast |  | IDC: Invasive ductal carcinoma |
| DCIS: Ductal carcinoma in situ | ||
| Precancer(BRCA1-mut): Precancerous lesion from BRCA1 mutation carriers | ||
| Esophagus | 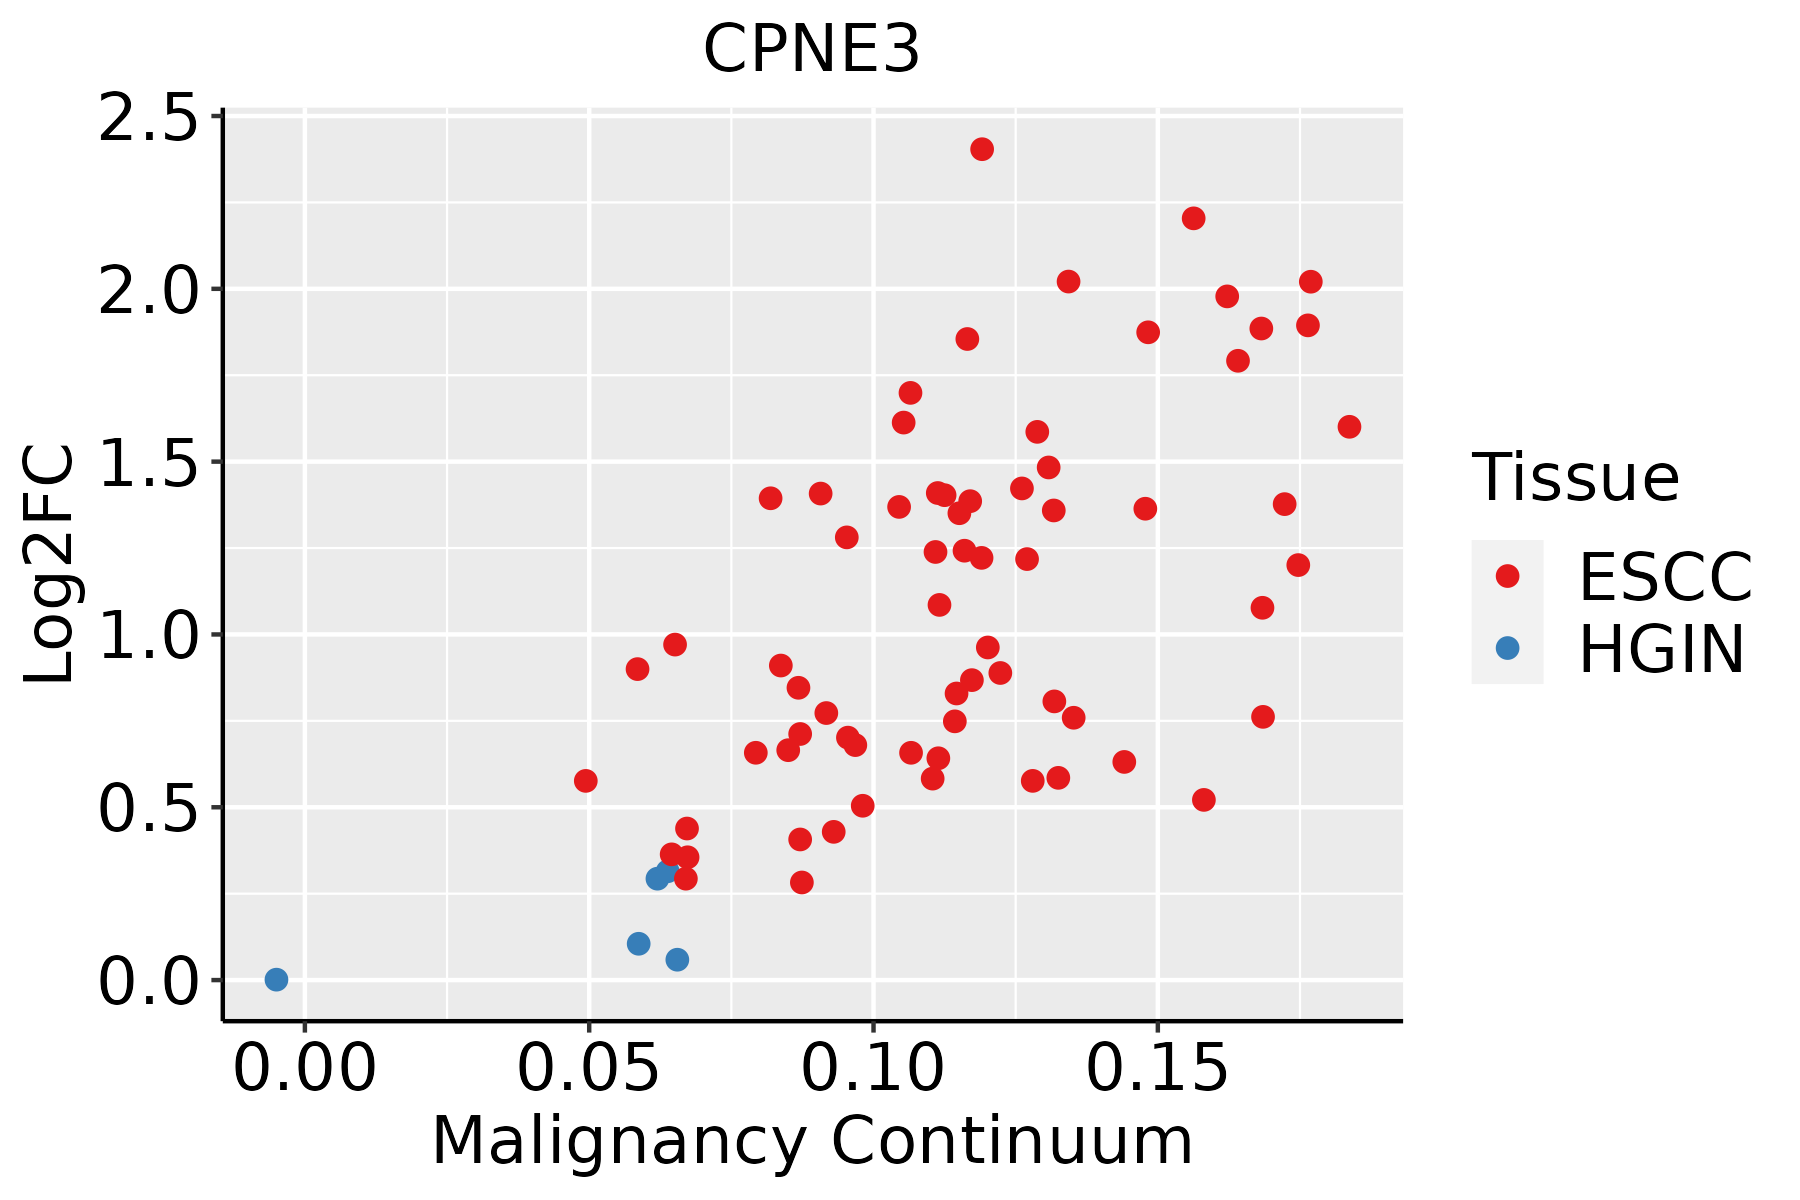 | ESCC: Esophageal squamous cell carcinoma |
| HGIN: High-grade intraepithelial neoplasias | ||
| LGIN: Low-grade intraepithelial neoplasias | ||
| Liver | 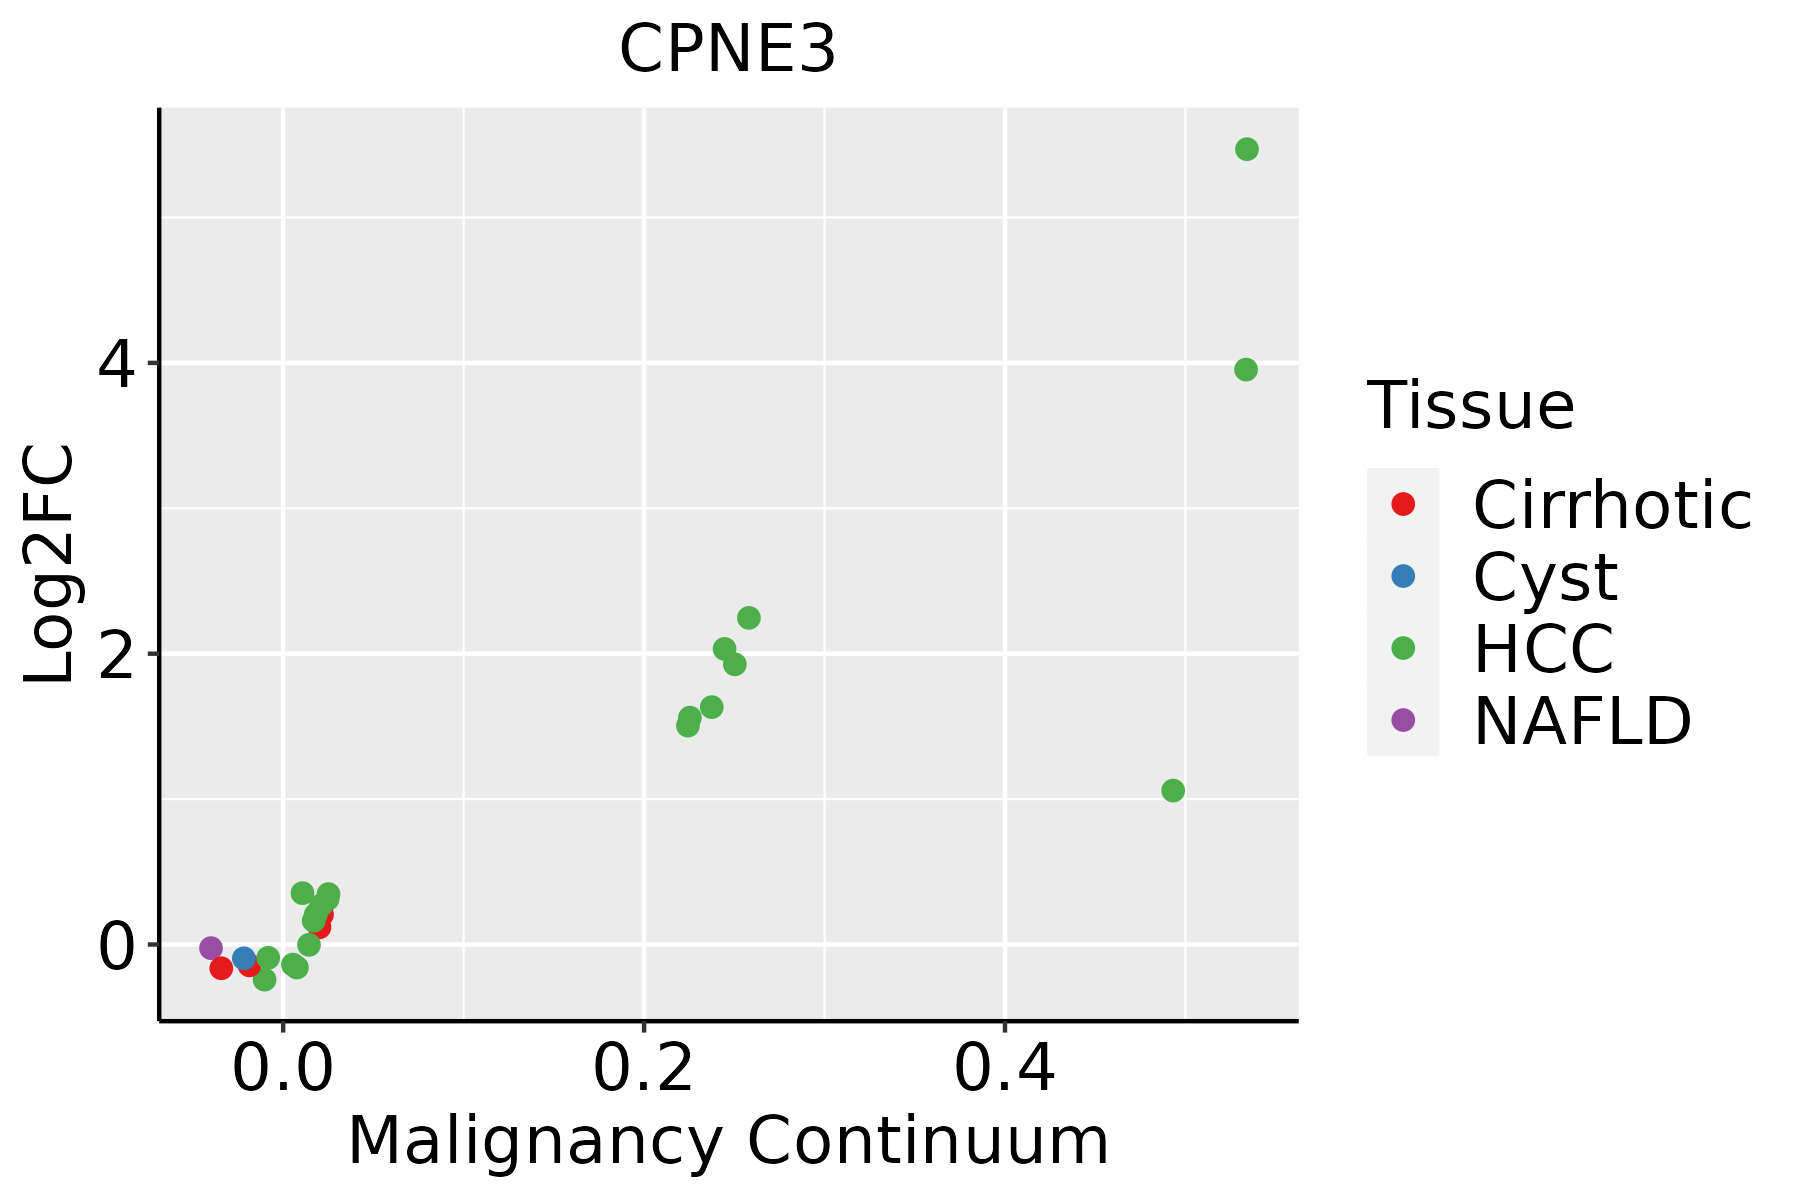 | HCC: Hepatocellular carcinoma |
| NAFLD: Non-alcoholic fatty liver disease | ||
| Oral Cavity | 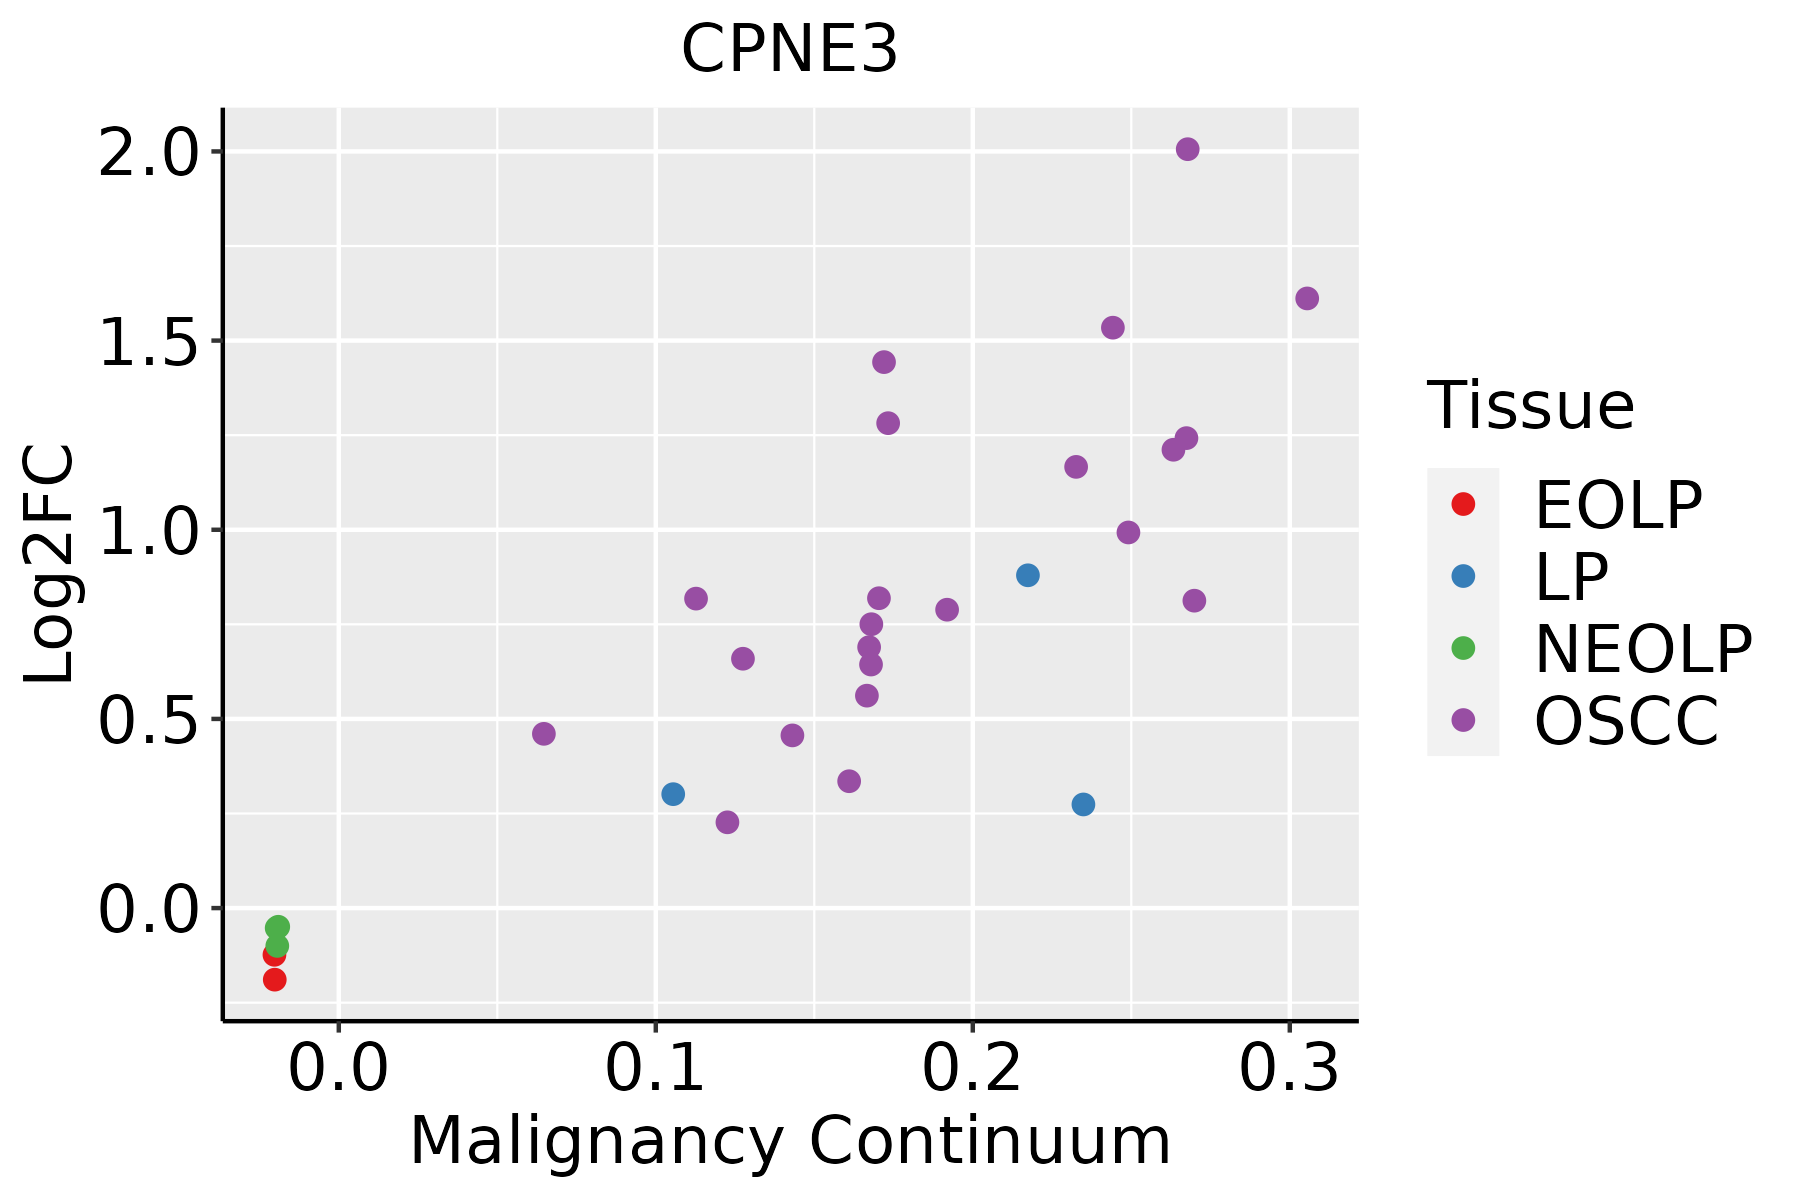 | EOLP: Erosive Oral lichen planus |
| LP: leukoplakia | ||
| NEOLP: Non-erosive oral lichen planus | ||
| OSCC: Oral squamous cell carcinoma | ||
| Prostate |  | BPH: Benign Prostatic Hyperplasia |
| Skin | 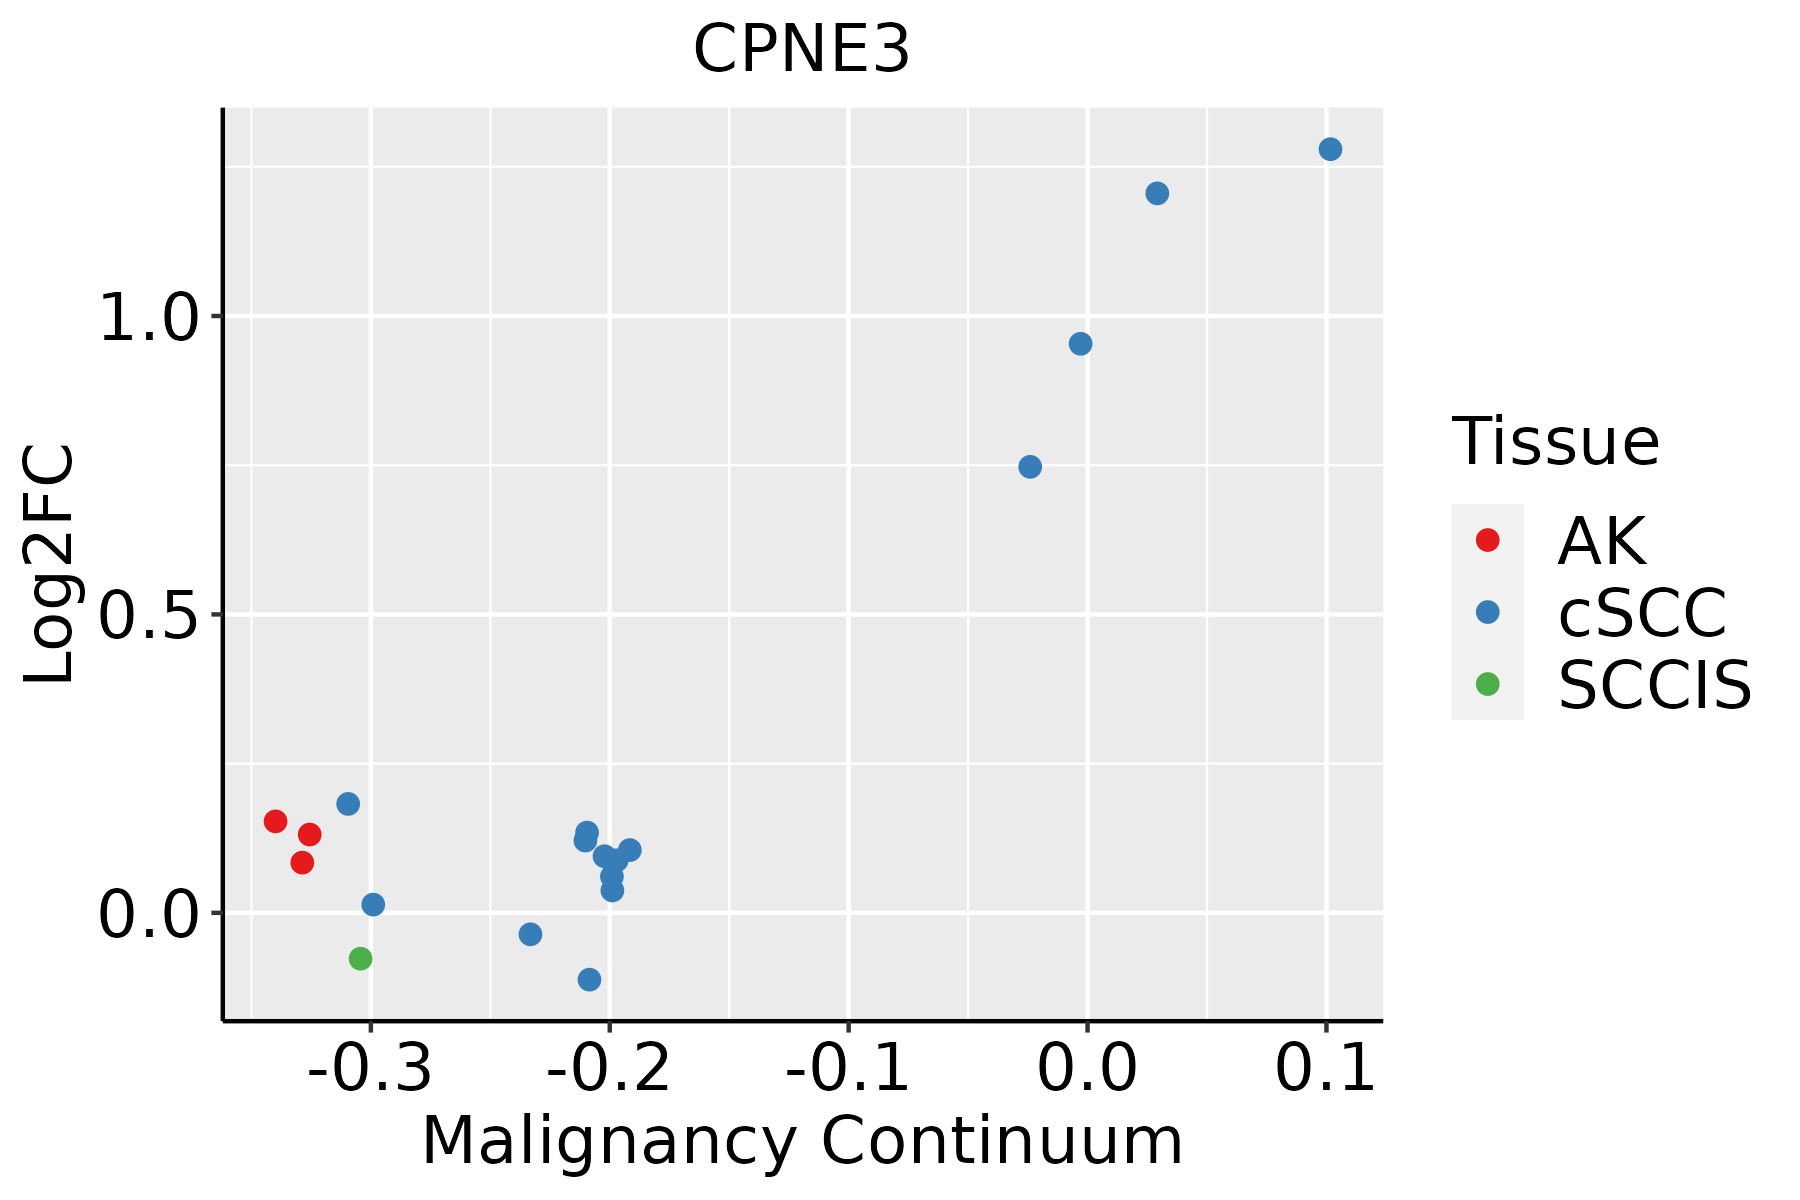 | AK: Actinic keratosis |
| cSCC: Cutaneous squamous cell carcinoma | ||
| SCCIS:squamous cell carcinoma in situ | ||
| Thyroid | 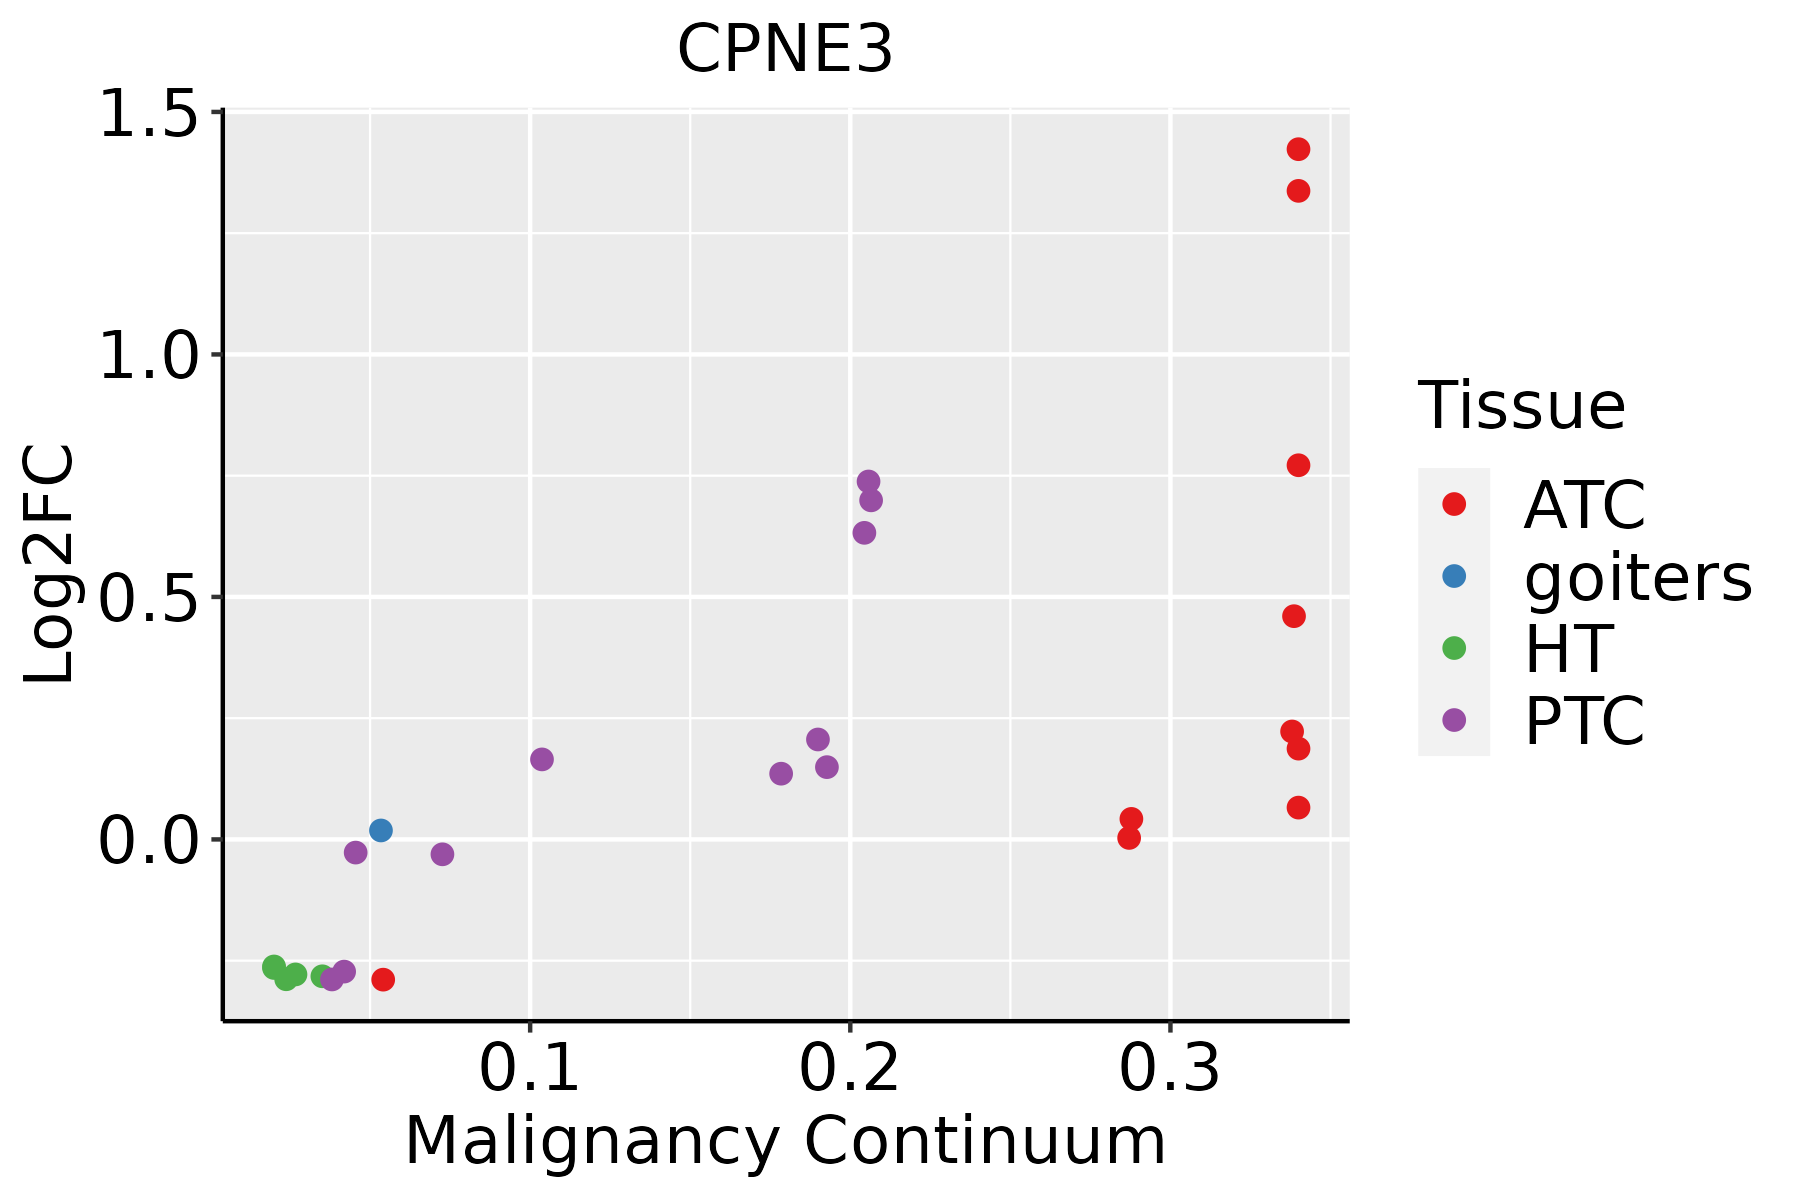 | ATC: Anaplastic thyroid cancer |
| HT: Hashimoto's thyroiditis | ||
| PTC: Papillary thyroid cancer |
| ∗log2FC in expression of this searched gene in stem-like cells from each diseased tissue sample relative to stem-like cells in normal samples in each tissue plotted against the malignancy continuum. Samples are colored based on if they are from different disease stage. |
Top |
Malignant transformation related pathway analysis |
| Find out the enriched GO biological processes and KEGG pathways involved in transition from healthy to precancer to cancer |
| Tissue | Disease Stage | Enriched GO biological Processes |
| Colorectum | AD |  |
| Colorectum | SER |  |
| Colorectum | MSS |  |
| Colorectum | MSI-H |  |
| Colorectum | FAP |  |
| ∗Top 15 enriched GO BP terms are showed in the bar plot of each disease state in each tissue. Each row represents a significant GO biological process which is colored according to the -log10(p.adjust). |
| Page: 1 2 3 4 5 6 7 8 9 |
| GO ID | Tissue | Disease Stage | Description | Gene Ratio | Bg Ratio | pvalue | p.adjust | Count |
| GO:001003814 | Breast | IDC | response to metal ion | 65/1434 | 373/18723 | 2.95e-10 | 3.42e-08 | 65 |
| GO:007124813 | Breast | IDC | cellular response to metal ion | 27/1434 | 197/18723 | 2.28e-03 | 2.09e-02 | 27 |
| GO:007124113 | Breast | IDC | cellular response to inorganic substance | 29/1434 | 226/18723 | 4.28e-03 | 3.34e-02 | 29 |
| GO:005159213 | Breast | IDC | response to calcium ion | 21/1434 | 149/18723 | 4.79e-03 | 3.67e-02 | 21 |
| GO:001003824 | Breast | DCIS | response to metal ion | 65/1390 | 373/18723 | 8.03e-11 | 9.88e-09 | 65 |
| GO:007124822 | Breast | DCIS | cellular response to metal ion | 27/1390 | 197/18723 | 1.46e-03 | 1.49e-02 | 27 |
| GO:007124123 | Breast | DCIS | cellular response to inorganic substance | 29/1390 | 226/18723 | 2.75e-03 | 2.41e-02 | 29 |
| GO:005159223 | Breast | DCIS | response to calcium ion | 21/1390 | 149/18723 | 3.34e-03 | 2.81e-02 | 21 |
| GO:003812717 | Esophagus | HGIN | ERBB signaling pathway | 29/2587 | 121/18723 | 1.83e-03 | 1.97e-02 | 29 |
| GO:003812718 | Esophagus | ESCC | ERBB signaling pathway | 82/8552 | 121/18723 | 7.23e-07 | 9.40e-06 | 82 |
| GO:001003827 | Esophagus | ESCC | response to metal ion | 208/8552 | 373/18723 | 5.02e-05 | 3.90e-04 | 208 |
| GO:007124117 | Esophagus | ESCC | cellular response to inorganic substance | 125/8552 | 226/18723 | 2.17e-03 | 9.67e-03 | 125 |
| GO:001003812 | Liver | Cirrhotic | response to metal ion | 150/4634 | 373/18723 | 2.27e-11 | 1.37e-09 | 150 |
| GO:005159211 | Liver | Cirrhotic | response to calcium ion | 61/4634 | 149/18723 | 9.47e-06 | 1.38e-04 | 61 |
| GO:00712487 | Liver | Cirrhotic | cellular response to metal ion | 73/4634 | 197/18723 | 7.73e-05 | 8.54e-04 | 73 |
| GO:00712417 | Liver | Cirrhotic | cellular response to inorganic substance | 81/4634 | 226/18723 | 1.21e-04 | 1.20e-03 | 81 |
| GO:003812711 | Liver | Cirrhotic | ERBB signaling pathway | 46/4634 | 121/18723 | 8.08e-04 | 5.93e-03 | 46 |
| GO:001003822 | Liver | HCC | response to metal ion | 208/7958 | 373/18723 | 1.35e-07 | 2.56e-06 | 208 |
| GO:003812721 | Liver | HCC | ERBB signaling pathway | 73/7958 | 121/18723 | 5.65e-05 | 5.26e-04 | 73 |
| GO:007124112 | Liver | HCC | cellular response to inorganic substance | 119/7958 | 226/18723 | 1.26e-03 | 6.92e-03 | 119 |
| Page: 1 2 3 |
| Pathway ID | Tissue | Disease Stage | Description | Gene Ratio | Bg Ratio | pvalue | p.adjust | qvalue | Count |
| Page: 1 |
Top |
Cell-cell communication analysis |
| Identification of potential cell-cell interactions between two cell types and their ligand-receptor pairs for different disease states |
| Ligand | Receptor | LRpair | Pathway | Tissue | Disease Stage |
| Page: 1 |
Top |
Single-cell gene regulatory network inference analysis |
| Find out the significant the regulons (TFs) and the target genes of each regulon across cell types for different disease states |
| TF | Cell Type | Tissue | Disease Stage | Target Gene | RSS | Regulon Activity |
| ∗The dot plots of a searched regulon are shown for all cell subpopulations in each disease state of each tissue based on the regulon specific score inferred using pySCENIC and by calculating the average expression. |
| Page: 1 |
Top |
Somatic mutation of malignant transformation related genes |
| Annotation of somatic variants for genes involved in malignant transformation |
| Hugo Symbol | Variant Class | Variant Classification | dbSNP RS | HGVSc | HGVSp | HGVSp Short | SWISSPROT | BIOTYPE | SIFT | PolyPhen | Tumor Sample Barcode | Tissue | Histology | Sex | Age | Stage | Therapy Types | Drugs | Outcome |
| CPNE3 | SNV | Missense_Mutation | rs768025237 | c.1321A>G | p.Ile441Val | p.I441V | O75131 | protein_coding | tolerated(0.21) | benign(0.251) | TCGA-BH-A18K-01 | Breast | breast invasive carcinoma | Female | <65 | I/II | Unknown | Unknown | PD |
| CPNE3 | SNV | Missense_Mutation | c.479N>T | p.Asp160Val | p.D160V | O75131 | protein_coding | deleterious(0.01) | probably_damaging(0.989) | TCGA-C8-A134-01 | Breast | breast invasive carcinoma | Female | <65 | I/II | Chemotherapy | 5-fluorouracil | CR | |
| CPNE3 | SNV | Missense_Mutation | c.1438N>A | p.Glu480Lys | p.E480K | O75131 | protein_coding | tolerated(0.15) | benign(0.124) | TCGA-D8-A27L-01 | Breast | breast invasive carcinoma | Female | <65 | III/IV | Chemotherapy | adriamycin+cuclophosphamide | SD | |
| CPNE3 | insertion | Frame_Shift_Ins | novel | c.871_872insTACCTCATTTCTCTTGGTTTTTAAAT | p.Asn291IlefsTer42 | p.N291Ifs*42 | O75131 | protein_coding | TCGA-AN-A04C-01 | Breast | breast invasive carcinoma | Female | <65 | I/II | Unknown | Unknown | SD | ||
| CPNE3 | deletion | Frame_Shift_Del | novel | c.1558delN | p.Asn520IlefsTer88 | p.N520Ifs*88 | O75131 | protein_coding | TCGA-D8-A27V-01 | Breast | breast invasive carcinoma | Female | <65 | I/II | Hormone Therapy | tamoxiphen | SD | ||
| CPNE3 | SNV | Missense_Mutation | novel | c.889N>A | p.Asp297Asn | p.D297N | O75131 | protein_coding | deleterious(0) | probably_damaging(0.928) | TCGA-2W-A8YY-01 | Cervix | cervical & endocervical cancer | Female | <65 | I/II | Chemotherapy | cisplatin | CR |
| CPNE3 | SNV | Missense_Mutation | c.588N>G | p.Ile196Met | p.I196M | O75131 | protein_coding | deleterious(0.01) | probably_damaging(0.953) | TCGA-DR-A0ZM-01 | Cervix | cervical & endocervical cancer | Female | <65 | III/IV | Unspecific | Cisplatin | SD | |
| CPNE3 | SNV | Missense_Mutation | novel | c.1015N>A | p.Asp339Asn | p.D339N | O75131 | protein_coding | deleterious(0.01) | benign(0.33) | TCGA-VS-A953-01 | Cervix | cervical & endocervical cancer | Female | <65 | I/II | Unknown | Unknown | PD |
| CPNE3 | SNV | Missense_Mutation | c.199N>A | p.Tyr67Asn | p.Y67N | O75131 | protein_coding | deleterious(0) | probably_damaging(0.983) | TCGA-AA-3811-01 | Colorectum | colon adenocarcinoma | Female | >=65 | III/IV | Unknown | Unknown | PD | |
| CPNE3 | SNV | Missense_Mutation | c.1093T>G | p.Phe365Val | p.F365V | O75131 | protein_coding | deleterious(0) | probably_damaging(0.973) | TCGA-AD-6889-01 | Colorectum | colon adenocarcinoma | Male | >=65 | I/II | Chemotherapy | xeloda | PD |
| Page: 1 2 3 4 5 6 7 |
Top |
Related drugs of malignant transformation related genes |
| Identification of chemicals and drugs interact with genes involved in malignant transfromation |
| (DGIdb 4.0) |
| Entrez ID | Symbol | Category | Interaction Types | Drug Claim Name | Drug Name | PMIDs |
| Page: 1 |

Copyright 2023-Present -The University of Texas Health Science Center at Houston |