
|
|||||
|
 | |
| |
| |
| |
| |
| |
|
Gene: COX19 |
Gene summary for COX19 |
| Gene information | Species | Human | Gene symbol | COX19 | Gene ID | 90639 |
| Gene name | cytochrome c oxidase assembly factor COX19 | |
| Gene Alias | COX19 | |
| Cytomap | 7p22.3 | |
| Gene Type | protein-coding | GO ID | GO:0006873 | UniProtAcc | Q49B96 |
Top |
Malignant transformation analysis |
| Identification of the aberrant gene expression in precancerous and cancerous lesions by comparing the gene expression of stem-like cells in diseased tissues with normal stem cells |
| Entrez ID | Symbol | Replicates | Species | Organ | Tissue | Adj P-value | Log2FC | Malignancy |
| 90639 | COX19 | C21 | Human | Oral cavity | OSCC | 1.35e-37 | 1.19e+00 | 0.2678 |
| 90639 | COX19 | C30 | Human | Oral cavity | OSCC | 1.88e-51 | 1.85e+00 | 0.3055 |
| 90639 | COX19 | C38 | Human | Oral cavity | OSCC | 3.16e-11 | 1.39e+00 | 0.172 |
| 90639 | COX19 | C43 | Human | Oral cavity | OSCC | 2.25e-24 | 5.39e-01 | 0.1704 |
| 90639 | COX19 | C46 | Human | Oral cavity | OSCC | 1.28e-16 | 4.91e-01 | 0.1673 |
| 90639 | COX19 | C51 | Human | Oral cavity | OSCC | 6.08e-20 | 1.05e+00 | 0.2674 |
| 90639 | COX19 | C57 | Human | Oral cavity | OSCC | 3.85e-11 | 5.06e-01 | 0.1679 |
| 90639 | COX19 | C06 | Human | Oral cavity | OSCC | 2.17e-09 | 1.11e+00 | 0.2699 |
| 90639 | COX19 | C07 | Human | Oral cavity | OSCC | 4.53e-02 | 9.30e-01 | 0.2491 |
| 90639 | COX19 | C08 | Human | Oral cavity | OSCC | 1.99e-25 | 6.35e-01 | 0.1919 |
| 90639 | COX19 | C09 | Human | Oral cavity | OSCC | 6.14e-03 | 2.37e-01 | 0.1431 |
| 90639 | COX19 | LN46 | Human | Oral cavity | OSCC | 1.30e-11 | 6.62e-01 | 0.1666 |
| 90639 | COX19 | LP15 | Human | Oral cavity | LP | 2.85e-10 | 1.27e+00 | 0.2174 |
| 90639 | COX19 | LP17 | Human | Oral cavity | LP | 2.18e-05 | 8.81e-01 | 0.2349 |
| 90639 | COX19 | SYSMH1 | Human | Oral cavity | OSCC | 3.24e-16 | 4.36e-01 | 0.1127 |
| 90639 | COX19 | SYSMH2 | Human | Oral cavity | OSCC | 4.32e-13 | 5.15e-01 | 0.2326 |
| 90639 | COX19 | SYSMH3 | Human | Oral cavity | OSCC | 6.63e-20 | 5.27e-01 | 0.2442 |
| 90639 | COX19 | SYSMH5 | Human | Oral cavity | OSCC | 3.93e-14 | 3.91e-01 | 0.0647 |
| 90639 | COX19 | SYSMH6 | Human | Oral cavity | OSCC | 1.10e-04 | 2.65e-01 | 0.1275 |
| 90639 | COX19 | P4_S8_cSCC | Human | Skin | cSCC | 1.32e-02 | 8.15e-02 | -0.3095 |
| Page: 1 2 3 4 5 6 7 |
| Tissue | Expression Dynamics | Abbreviation |
| Esophagus | 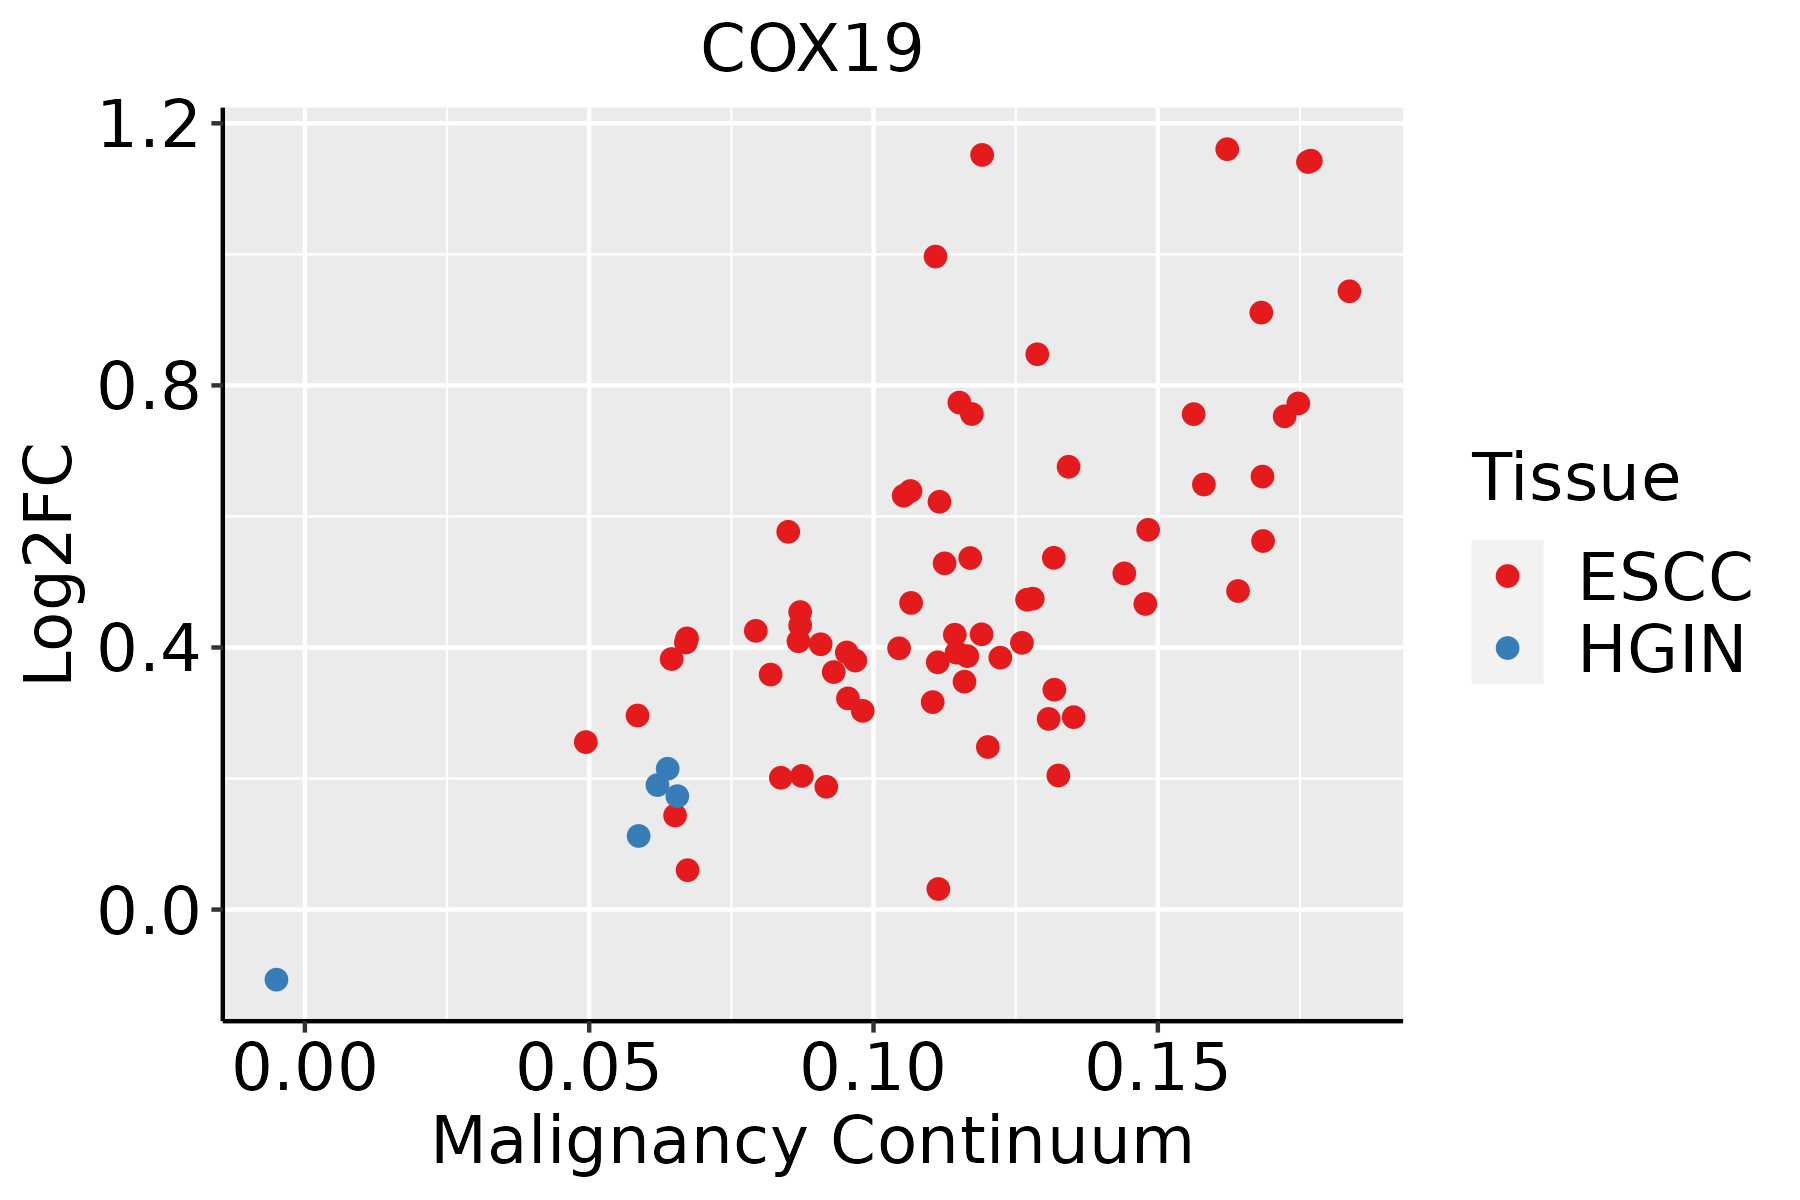 | ESCC: Esophageal squamous cell carcinoma |
| HGIN: High-grade intraepithelial neoplasias | ||
| LGIN: Low-grade intraepithelial neoplasias | ||
| Liver | 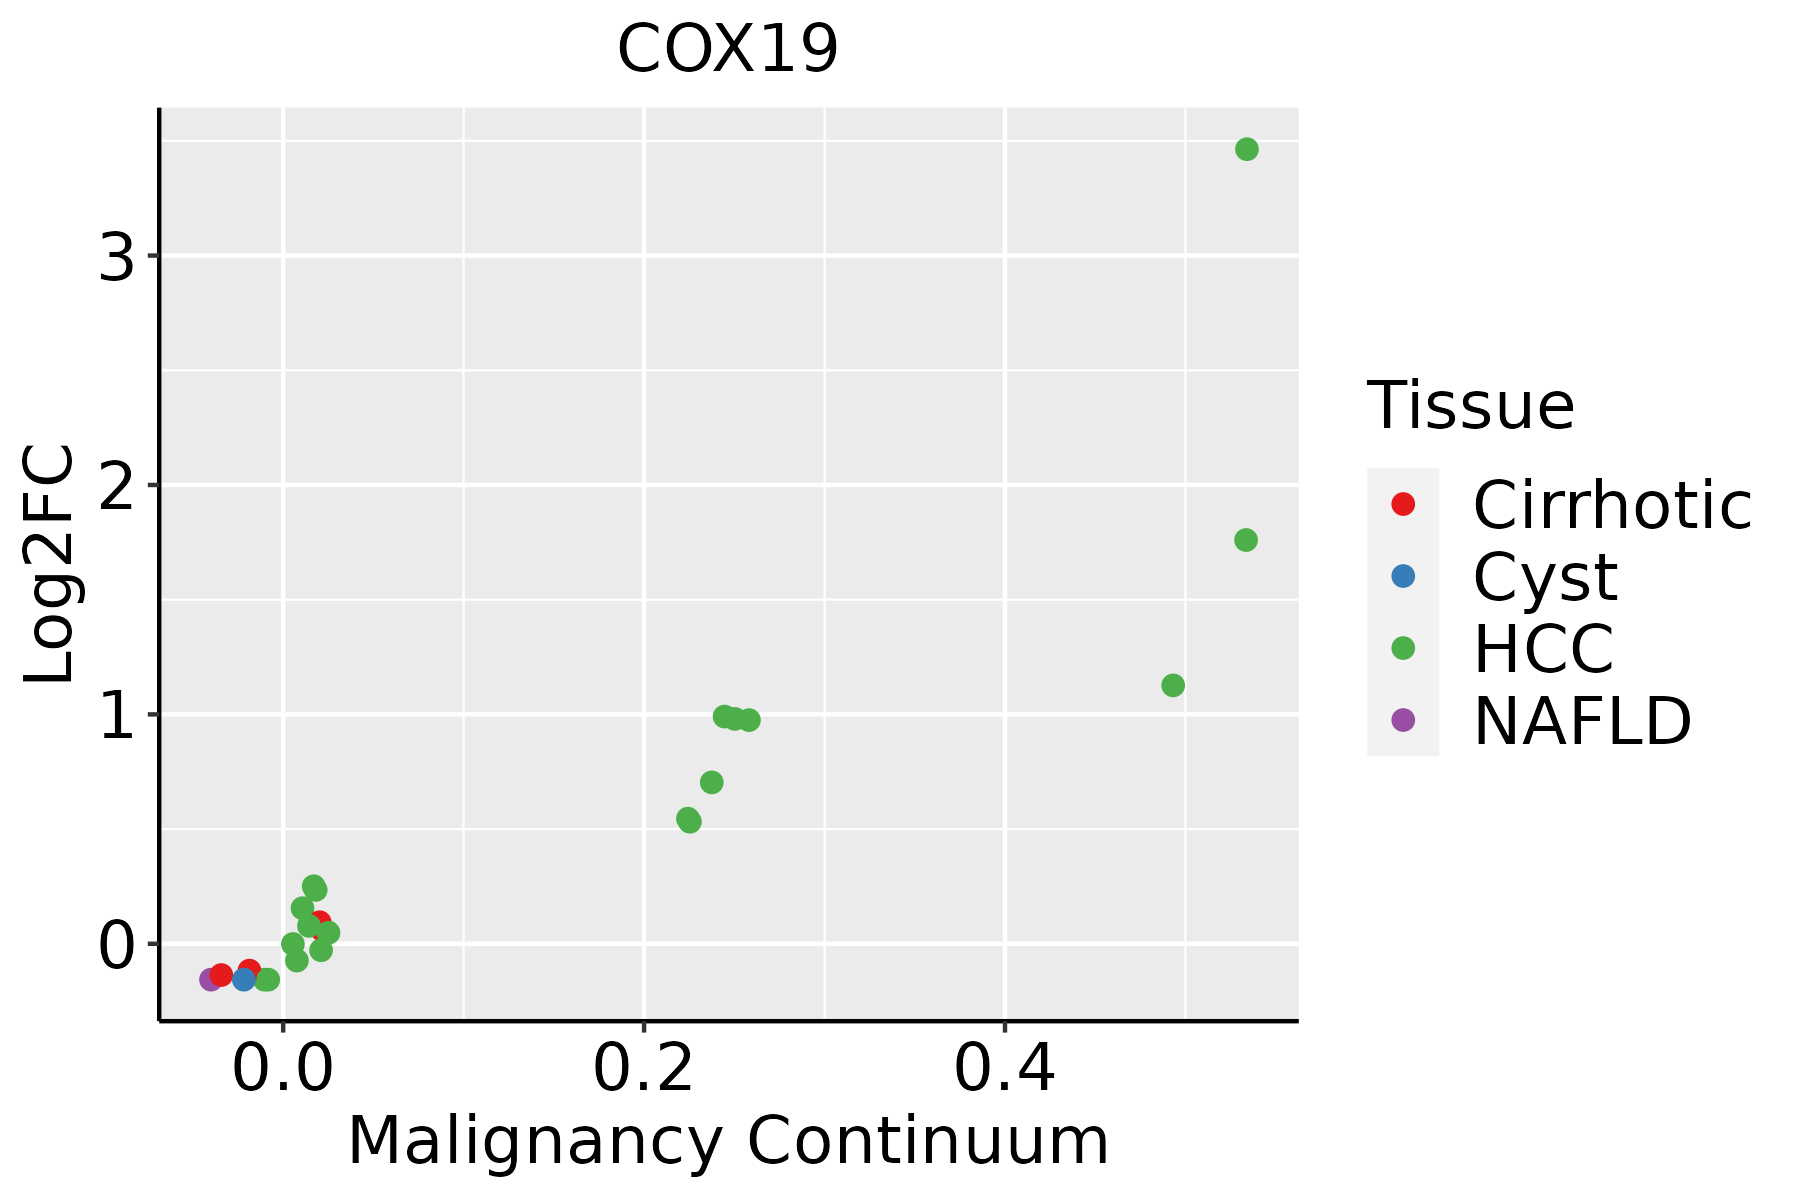 | HCC: Hepatocellular carcinoma |
| NAFLD: Non-alcoholic fatty liver disease | ||
| Oral Cavity |  | EOLP: Erosive Oral lichen planus |
| LP: leukoplakia | ||
| NEOLP: Non-erosive oral lichen planus | ||
| OSCC: Oral squamous cell carcinoma | ||
| Skin | 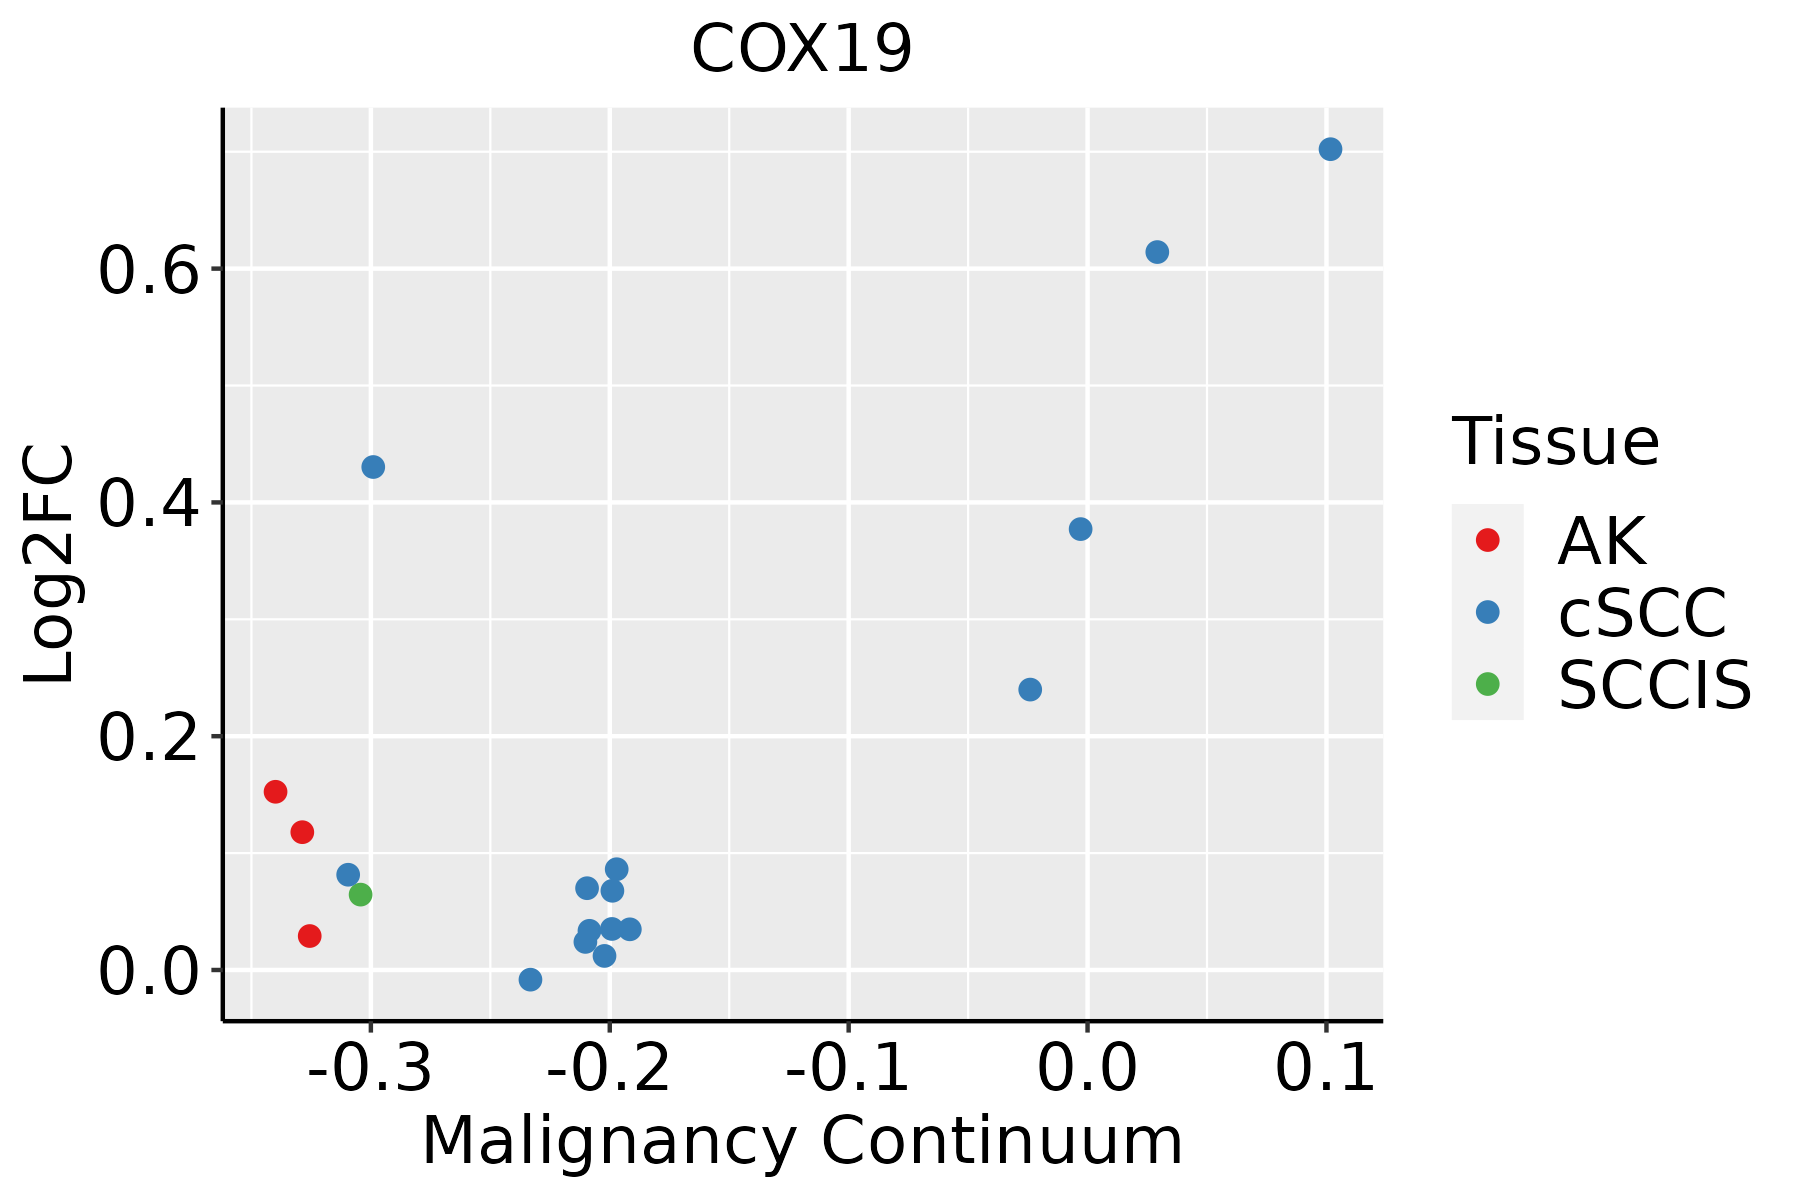 | AK: Actinic keratosis |
| cSCC: Cutaneous squamous cell carcinoma | ||
| SCCIS:squamous cell carcinoma in situ | ||
| Thyroid |  | ATC: Anaplastic thyroid cancer |
| HT: Hashimoto's thyroiditis | ||
| PTC: Papillary thyroid cancer |
| ∗log2FC in expression of this searched gene in stem-like cells from each diseased tissue sample relative to stem-like cells in normal samples in each tissue plotted against the malignancy continuum. Samples are colored based on if they are from different disease stage. |
Top |
Malignant transformation related pathway analysis |
| Find out the enriched GO biological processes and KEGG pathways involved in transition from healthy to precancer to cancer |
| Tissue | Disease Stage | Enriched GO biological Processes |
| Colorectum | AD |  |
| Colorectum | SER |  |
| Colorectum | MSS |  |
| Colorectum | MSI-H |  |
| Colorectum | FAP |  |
| ∗Top 15 enriched GO BP terms are showed in the bar plot of each disease state in each tissue. Each row represents a significant GO biological process which is colored according to the -log10(p.adjust). |
| Page: 1 2 3 4 5 6 7 8 9 |
| GO ID | Tissue | Disease Stage | Description | Gene Ratio | Bg Ratio | pvalue | p.adjust | Count |
| GO:003310820 | Esophagus | HGIN | mitochondrial respiratory chain complex assembly | 47/2587 | 93/18723 | 3.15e-17 | 8.60e-15 | 47 |
| GO:00170044 | Esophagus | HGIN | cytochrome complex assembly | 18/2587 | 36/18723 | 2.39e-07 | 1.14e-05 | 18 |
| GO:00336173 | Esophagus | HGIN | mitochondrial cytochrome c oxidase assembly | 13/2587 | 22/18723 | 9.51e-07 | 3.80e-05 | 13 |
| GO:00085353 | Esophagus | HGIN | respiratory chain complex IV assembly | 14/2587 | 26/18723 | 1.68e-06 | 6.29e-05 | 14 |
| GO:0033108110 | Esophagus | ESCC | mitochondrial respiratory chain complex assembly | 83/8552 | 93/18723 | 9.56e-19 | 1.05e-16 | 83 |
| GO:001700413 | Esophagus | ESCC | cytochrome complex assembly | 34/8552 | 36/18723 | 5.08e-10 | 1.31e-08 | 34 |
| GO:000853512 | Esophagus | ESCC | respiratory chain complex IV assembly | 24/8552 | 26/18723 | 6.87e-07 | 8.99e-06 | 24 |
| GO:003361712 | Esophagus | ESCC | mitochondrial cytochrome c oxidase assembly | 21/8552 | 22/18723 | 8.75e-07 | 1.13e-05 | 21 |
| GO:005507617 | Esophagus | ESCC | transition metal ion homeostasis | 87/8552 | 138/18723 | 2.85e-05 | 2.37e-04 | 87 |
| GO:00469169 | Esophagus | ESCC | cellular transition metal ion homeostasis | 70/8552 | 115/18723 | 7.28e-04 | 3.79e-03 | 70 |
| GO:00550703 | Esophagus | ESCC | copper ion homeostasis | 15/8552 | 18/18723 | 1.20e-03 | 5.88e-03 | 15 |
| GO:00068781 | Esophagus | ESCC | cellular copper ion homeostasis | 12/8552 | 15/18723 | 7.31e-03 | 2.63e-02 | 12 |
| GO:003310812 | Liver | HCC | mitochondrial respiratory chain complex assembly | 80/7958 | 93/18723 | 3.47e-18 | 4.15e-16 | 80 |
| GO:00170041 | Liver | HCC | cytochrome complex assembly | 30/7958 | 36/18723 | 5.69e-07 | 9.03e-06 | 30 |
| GO:00336171 | Liver | HCC | mitochondrial cytochrome c oxidase assembly | 20/7958 | 22/18723 | 3.00e-06 | 3.98e-05 | 20 |
| GO:00085351 | Liver | HCC | respiratory chain complex IV assembly | 22/7958 | 26/18723 | 1.23e-05 | 1.39e-04 | 22 |
| GO:005507612 | Liver | HCC | transition metal ion homeostasis | 81/7958 | 138/18723 | 8.87e-05 | 7.72e-04 | 81 |
| GO:004691611 | Liver | HCC | cellular transition metal ion homeostasis | 67/7958 | 115/18723 | 4.64e-04 | 3.08e-03 | 67 |
| GO:0055070 | Liver | HCC | copper ion homeostasis | 14/7958 | 18/18723 | 2.57e-03 | 1.23e-02 | 14 |
| GO:003310818 | Oral cavity | OSCC | mitochondrial respiratory chain complex assembly | 75/7305 | 93/18723 | 2.17e-16 | 1.68e-14 | 75 |
| Page: 1 2 3 |
| Pathway ID | Tissue | Disease Stage | Description | Gene Ratio | Bg Ratio | pvalue | p.adjust | qvalue | Count |
| hsa0471439 | Esophagus | HGIN | Thermogenesis | 91/1383 | 232/8465 | 1.97e-17 | 5.36e-16 | 4.25e-16 | 91 |
| hsa04714114 | Esophagus | HGIN | Thermogenesis | 91/1383 | 232/8465 | 1.97e-17 | 5.36e-16 | 4.25e-16 | 91 |
| hsa04714211 | Esophagus | ESCC | Thermogenesis | 163/4205 | 232/8465 | 9.22e-11 | 1.14e-09 | 5.86e-10 | 163 |
| hsa04714310 | Esophagus | ESCC | Thermogenesis | 163/4205 | 232/8465 | 9.22e-11 | 1.14e-09 | 5.86e-10 | 163 |
| hsa0471422 | Liver | HCC | Thermogenesis | 170/4020 | 232/8465 | 5.36e-16 | 2.25e-14 | 1.25e-14 | 170 |
| hsa0471432 | Liver | HCC | Thermogenesis | 170/4020 | 232/8465 | 5.36e-16 | 2.25e-14 | 1.25e-14 | 170 |
| hsa0471430 | Oral cavity | OSCC | Thermogenesis | 138/3704 | 232/8465 | 7.67e-07 | 4.35e-06 | 2.22e-06 | 138 |
| hsa04714113 | Oral cavity | OSCC | Thermogenesis | 138/3704 | 232/8465 | 7.67e-07 | 4.35e-06 | 2.22e-06 | 138 |
| hsa04714210 | Oral cavity | LP | Thermogenesis | 105/2418 | 232/8465 | 3.14e-08 | 4.98e-07 | 3.21e-07 | 105 |
| hsa0471438 | Oral cavity | LP | Thermogenesis | 105/2418 | 232/8465 | 3.14e-08 | 4.98e-07 | 3.21e-07 | 105 |
| Page: 1 |
Top |
Cell-cell communication analysis |
| Identification of potential cell-cell interactions between two cell types and their ligand-receptor pairs for different disease states |
| Ligand | Receptor | LRpair | Pathway | Tissue | Disease Stage |
| Page: 1 |
Top |
Single-cell gene regulatory network inference analysis |
| Find out the significant the regulons (TFs) and the target genes of each regulon across cell types for different disease states |
| TF | Cell Type | Tissue | Disease Stage | Target Gene | RSS | Regulon Activity |
| ∗The dot plots of a searched regulon are shown for all cell subpopulations in each disease state of each tissue based on the regulon specific score inferred using pySCENIC and by calculating the average expression. |
| Page: 1 |
Top |
Somatic mutation of malignant transformation related genes |
| Annotation of somatic variants for genes involved in malignant transformation |
| Hugo Symbol | Variant Class | Variant Classification | dbSNP RS | HGVSc | HGVSp | HGVSp Short | SWISSPROT | BIOTYPE | SIFT | PolyPhen | Tumor Sample Barcode | Tissue | Histology | Sex | Age | Stage | Therapy Types | Drugs | Outcome |
| COX19 | insertion | Nonsense_Mutation | novel | c.219_220insACTTCTTGATG | p.Glu74ThrfsTer3 | p.E74Tfs*3 | Q49B96 | protein_coding | TCGA-AN-A04C-01 | Breast | breast invasive carcinoma | Female | <65 | I/II | Unknown | Unknown | SD | ||
| COX19 | SNV | Missense_Mutation | novel | c.134A>G | p.Asn45Ser | p.N45S | Q49B96 | protein_coding | tolerated(0.62) | benign(0.003) | TCGA-AA-3941-01 | Colorectum | colon adenocarcinoma | Female | >=65 | I/II | Unknown | Unknown | SD |
| COX19 | SNV | Missense_Mutation | c.263N>T | p.Ala88Val | p.A88V | Q49B96 | protein_coding | tolerated(0.18) | benign(0.043) | TCGA-CK-6746-01 | Colorectum | colon adenocarcinoma | Female | >=65 | I/II | Unknown | Unknown | SD | |
| COX19 | SNV | Missense_Mutation | novel | c.15G>T | p.Met5Ile | p.M5I | Q49B96 | protein_coding | tolerated(0.11) | probably_damaging(0.914) | TCGA-F5-6814-01 | Colorectum | rectum adenocarcinoma | Male | <65 | I/II | Unknown | Unknown | SD |
| COX19 | SNV | Missense_Mutation | c.105G>T | p.Glu35Asp | p.E35D | Q49B96 | protein_coding | tolerated(0.57) | benign(0.007) | TCGA-AX-A0J0-01 | Endometrium | uterine corpus endometrioid carcinoma | Female | <65 | I/II | Unknown | Unknown | SD | |
| COX19 | SNV | Missense_Mutation | c.222N>T | p.Glu74Asp | p.E74D | Q49B96 | protein_coding | tolerated(0.42) | benign(0.037) | TCGA-B5-A0JY-01 | Endometrium | uterine corpus endometrioid carcinoma | Female | <65 | III/IV | Chemotherapy | doxorubicin | SD | |
| COX19 | SNV | Missense_Mutation | c.168N>C | p.Lys56Asn | p.K56N | Q49B96 | protein_coding | deleterious(0) | probably_damaging(0.939) | TCGA-B5-A0JY-01 | Endometrium | uterine corpus endometrioid carcinoma | Female | <65 | III/IV | Chemotherapy | doxorubicin | SD | |
| COX19 | SNV | Missense_Mutation | c.186G>T | p.Arg62Ser | p.R62S | Q49B96 | protein_coding | deleterious(0) | probably_damaging(0.998) | TCGA-D1-A17D-01 | Endometrium | uterine corpus endometrioid carcinoma | Female | <65 | I/II | Chemotherapy | carboplatin | SD | |
| COX19 | insertion | In_Frame_Ins | novel | c.122_123insATTTTTAGTAGAGACGGGGTTTCACCG | p.Leu41_His42insPheLeuValGluThrGlyPheHisArg | p.L41_H42insFLVETGFHR | Q49B96 | protein_coding | TCGA-AX-A06J-01 | Endometrium | uterine corpus endometrioid carcinoma | Female | >=65 | I/II | Chemotherapy | carboplatin | SD | ||
| COX19 | insertion | Frame_Shift_Ins | novel | c.270_271insA | p.Ter91MetfsTer25 | p.*91Mfs*25 | Q49B96 | protein_coding | TCGA-BG-A187-01 | Endometrium | uterine corpus endometrioid carcinoma | Female | >=65 | I/II | Unknown | Unknown | SD |
| Page: 1 2 |
Top |
Related drugs of malignant transformation related genes |
| Identification of chemicals and drugs interact with genes involved in malignant transfromation |
| (DGIdb 4.0) |
| Entrez ID | Symbol | Category | Interaction Types | Drug Claim Name | Drug Name | PMIDs |
| Page: 1 |

Copyright 2023-Present -The University of Texas Health Science Center at Houston |