
|
|||||
|
 | |
| |
| |
| |
| |
| |
|
Gene: COMMD8 |
Gene summary for COMMD8 |
| Gene information | Species | Human | Gene symbol | COMMD8 | Gene ID | 54951 |
| Gene name | COMM domain containing 8 | |
| Gene Alias | COMMD8 | |
| Cytomap | 4p12 | |
| Gene Type | protein-coding | GO ID | GO:0005575 | UniProtAcc | Q9NX08 |
Top |
Malignant transformation analysis |
| Identification of the aberrant gene expression in precancerous and cancerous lesions by comparing the gene expression of stem-like cells in diseased tissues with normal stem cells |
| Entrez ID | Symbol | Replicates | Species | Organ | Tissue | Adj P-value | Log2FC | Malignancy |
| 54951 | COMMD8 | C08 | Human | Oral cavity | OSCC | 6.11e-22 | 4.88e-01 | 0.1919 |
| 54951 | COMMD8 | C09 | Human | Oral cavity | OSCC | 2.41e-02 | 1.96e-01 | 0.1431 |
| 54951 | COMMD8 | LN22 | Human | Oral cavity | OSCC | 3.47e-06 | 8.65e-01 | 0.1733 |
| 54951 | COMMD8 | LN46 | Human | Oral cavity | OSCC | 4.33e-05 | 3.85e-01 | 0.1666 |
| 54951 | COMMD8 | LP15 | Human | Oral cavity | LP | 9.33e-08 | 1.15e+00 | 0.2174 |
| 54951 | COMMD8 | LP17 | Human | Oral cavity | LP | 1.76e-04 | 1.03e+00 | 0.2349 |
| 54951 | COMMD8 | SYSMH1 | Human | Oral cavity | OSCC | 1.53e-23 | 5.38e-01 | 0.1127 |
| 54951 | COMMD8 | SYSMH2 | Human | Oral cavity | OSCC | 7.32e-26 | 6.54e-01 | 0.2326 |
| 54951 | COMMD8 | SYSMH3 | Human | Oral cavity | OSCC | 5.43e-34 | 7.43e-01 | 0.2442 |
| 54951 | COMMD8 | SYSMH4 | Human | Oral cavity | OSCC | 4.22e-06 | 1.55e-01 | 0.1226 |
| 54951 | COMMD8 | SYSMH5 | Human | Oral cavity | OSCC | 1.73e-14 | 4.64e-01 | 0.0647 |
| 54951 | COMMD8 | SYSMH6 | Human | Oral cavity | OSCC | 3.13e-08 | 2.38e-01 | 0.1275 |
| 54951 | COMMD8 | P4_S8_cSCC | Human | Skin | cSCC | 1.84e-02 | 3.81e-02 | -0.3095 |
| 54951 | COMMD8 | P1_cSCC | Human | Skin | cSCC | 7.00e-35 | 1.17e+00 | 0.0292 |
| 54951 | COMMD8 | P2_cSCC | Human | Skin | cSCC | 5.52e-14 | 5.47e-01 | -0.024 |
| 54951 | COMMD8 | P4_cSCC | Human | Skin | cSCC | 2.12e-31 | 7.75e-01 | -0.00290000000000005 |
| 54951 | COMMD8 | P10_cSCC | Human | Skin | cSCC | 8.66e-40 | 1.36e+00 | 0.1017 |
| 54951 | COMMD8 | cSCC_p8 | Human | Skin | cSCC | 6.33e-10 | 1.24e-01 | -0.1971 |
| 54951 | COMMD8 | cSCC_p9 | Human | Skin | cSCC | 3.34e-03 | 5.99e-02 | -0.1991 |
| 54951 | COMMD8 | male-WTA | Human | Thyroid | PTC | 6.56e-07 | -7.97e-02 | 0.1037 |
| Page: 1 2 3 4 5 6 |
| Tissue | Expression Dynamics | Abbreviation |
| Esophagus | 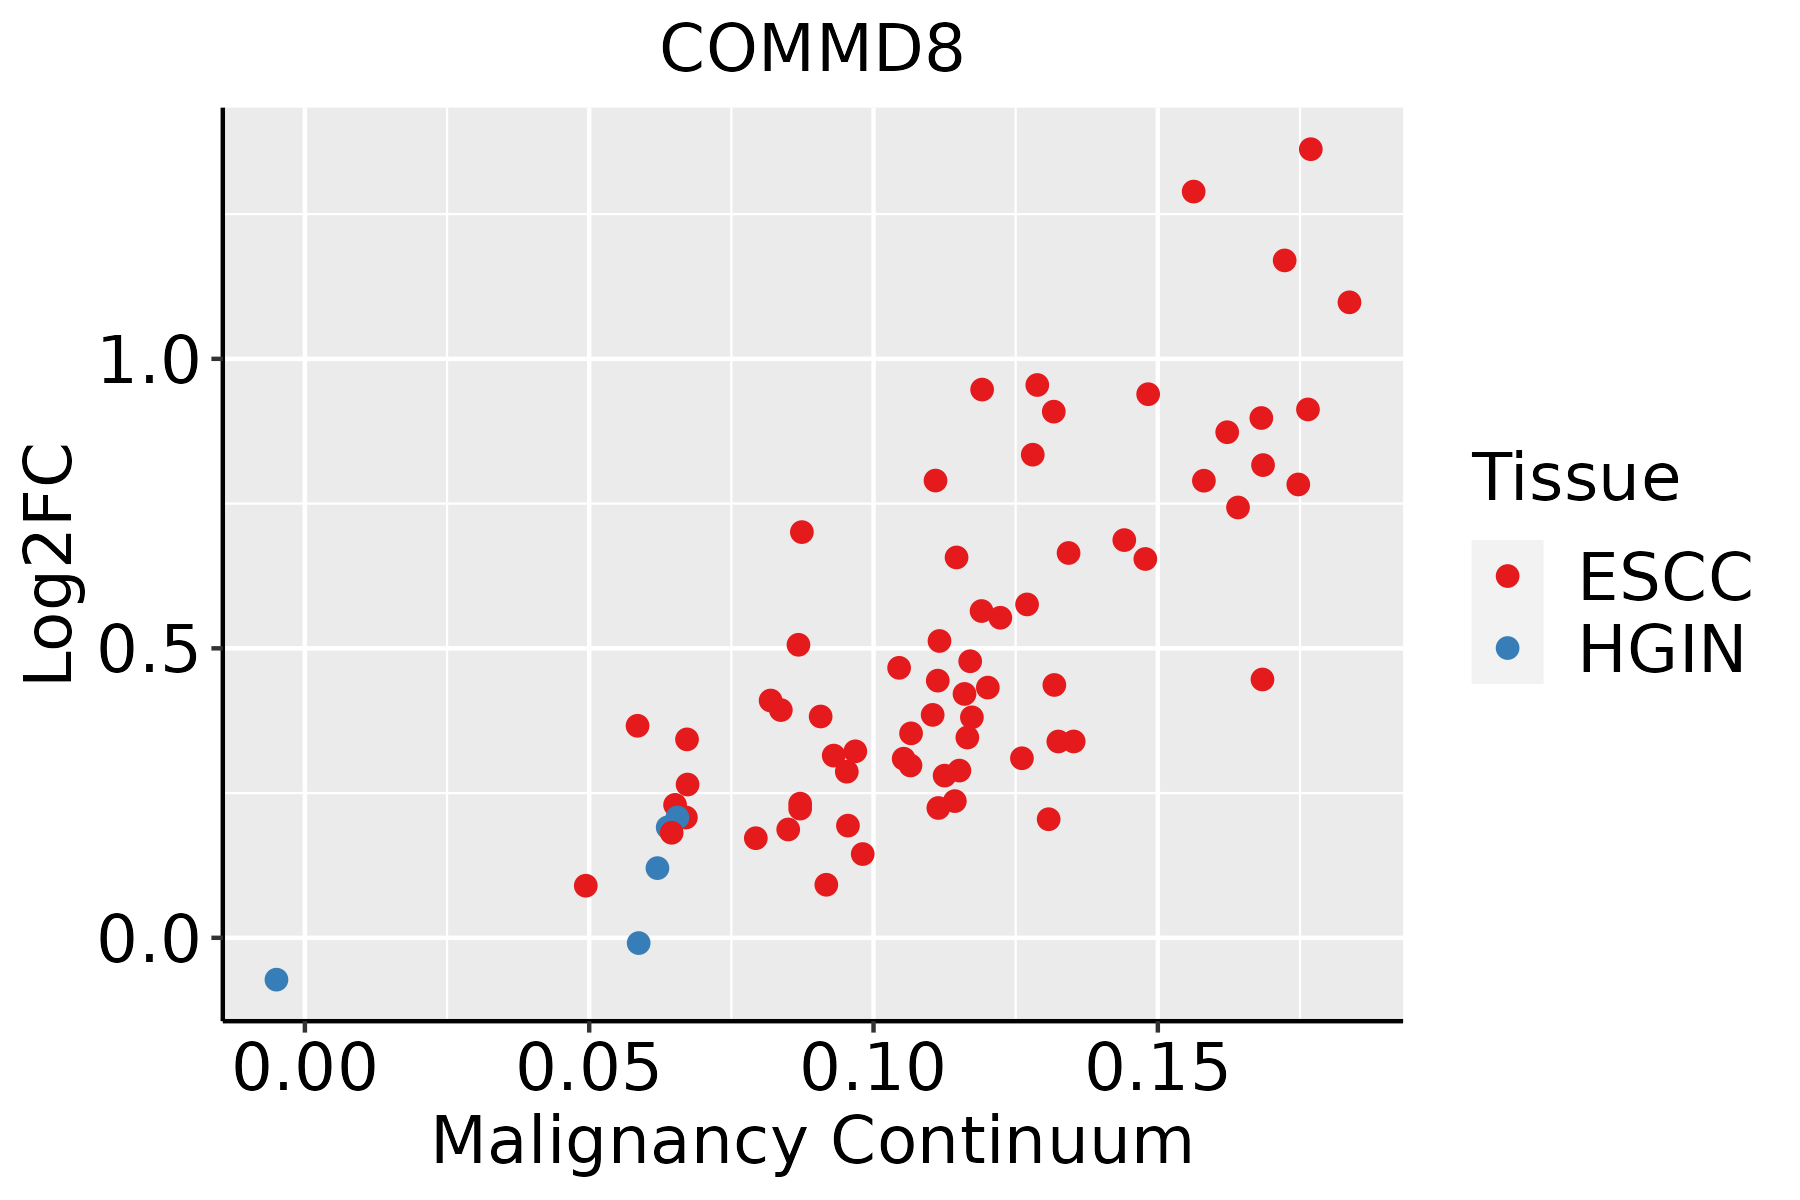 | ESCC: Esophageal squamous cell carcinoma |
| HGIN: High-grade intraepithelial neoplasias | ||
| LGIN: Low-grade intraepithelial neoplasias | ||
| Liver | 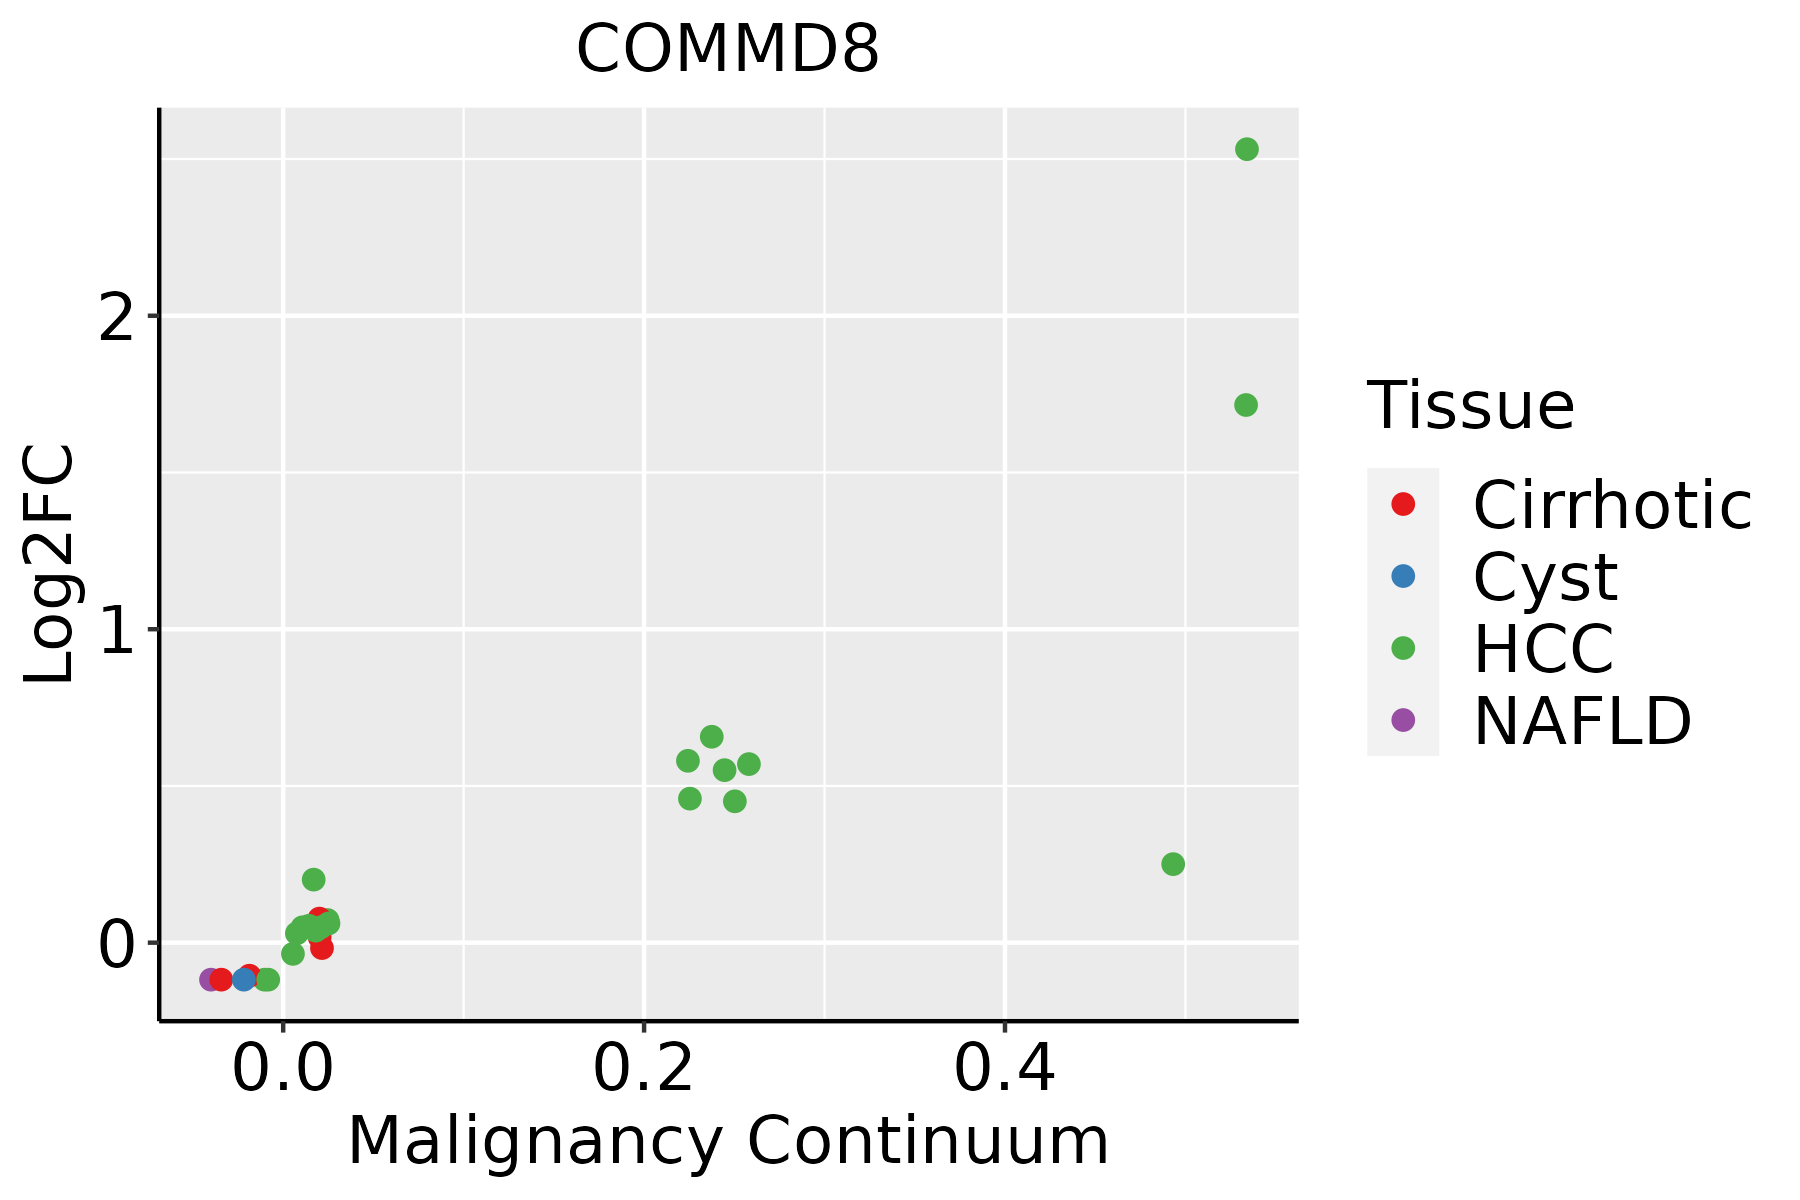 | HCC: Hepatocellular carcinoma |
| NAFLD: Non-alcoholic fatty liver disease | ||
| Oral Cavity | 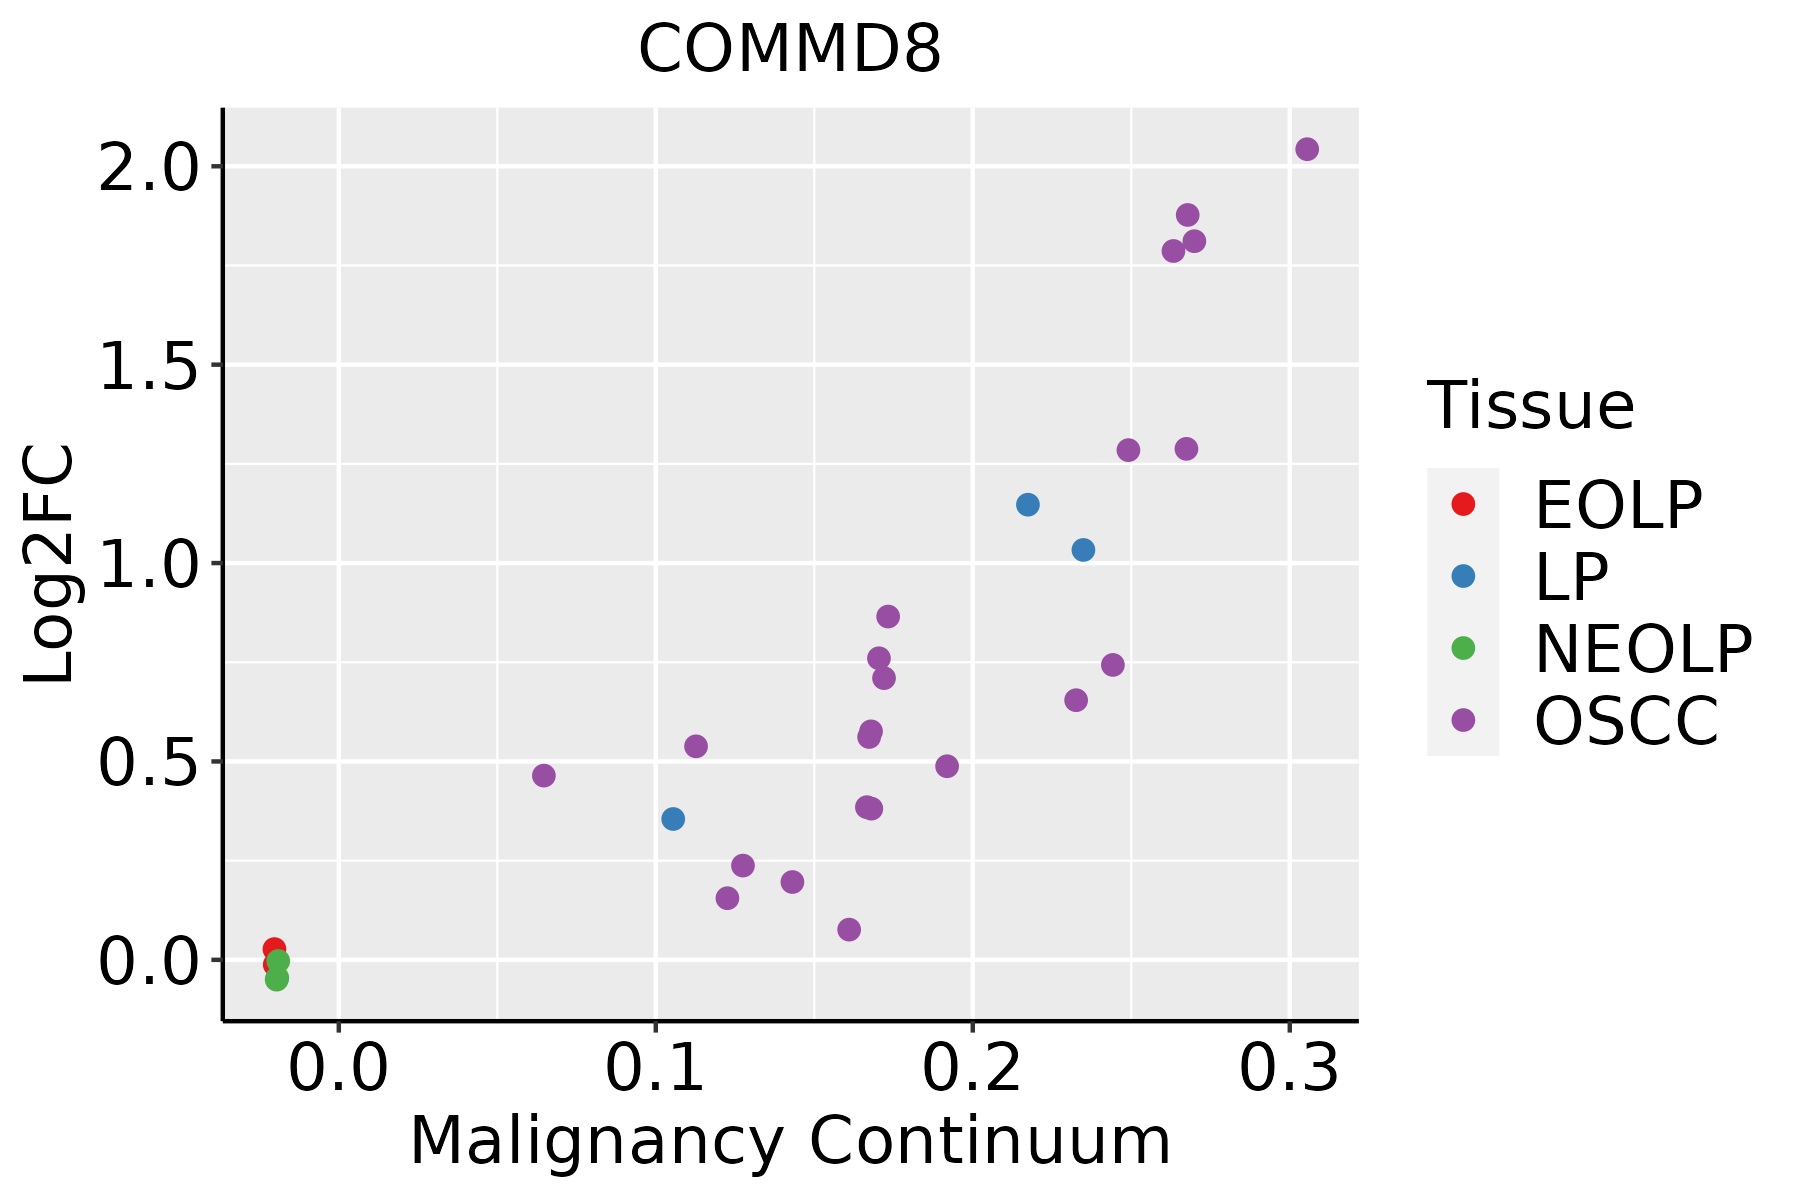 | EOLP: Erosive Oral lichen planus |
| LP: leukoplakia | ||
| NEOLP: Non-erosive oral lichen planus | ||
| OSCC: Oral squamous cell carcinoma | ||
| Skin | 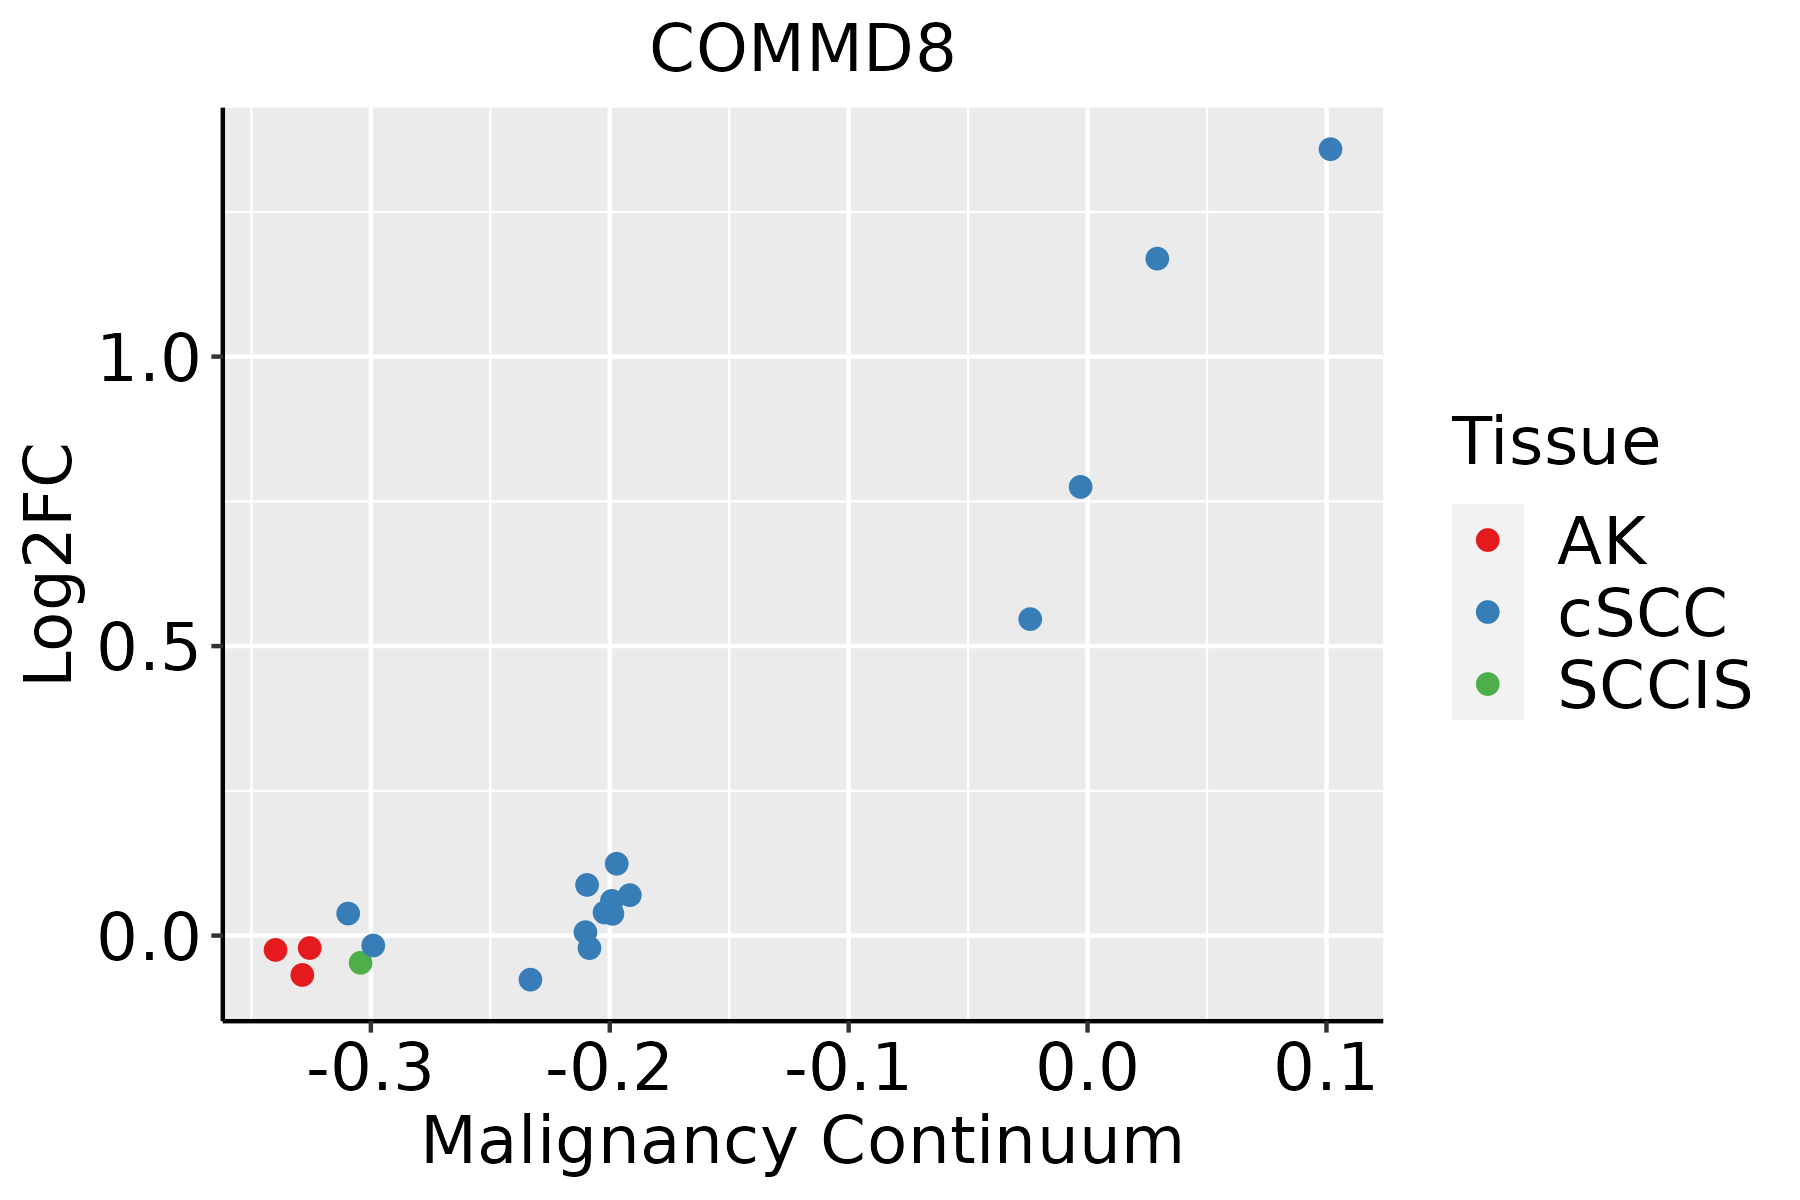 | AK: Actinic keratosis |
| cSCC: Cutaneous squamous cell carcinoma | ||
| SCCIS:squamous cell carcinoma in situ | ||
| Thyroid | 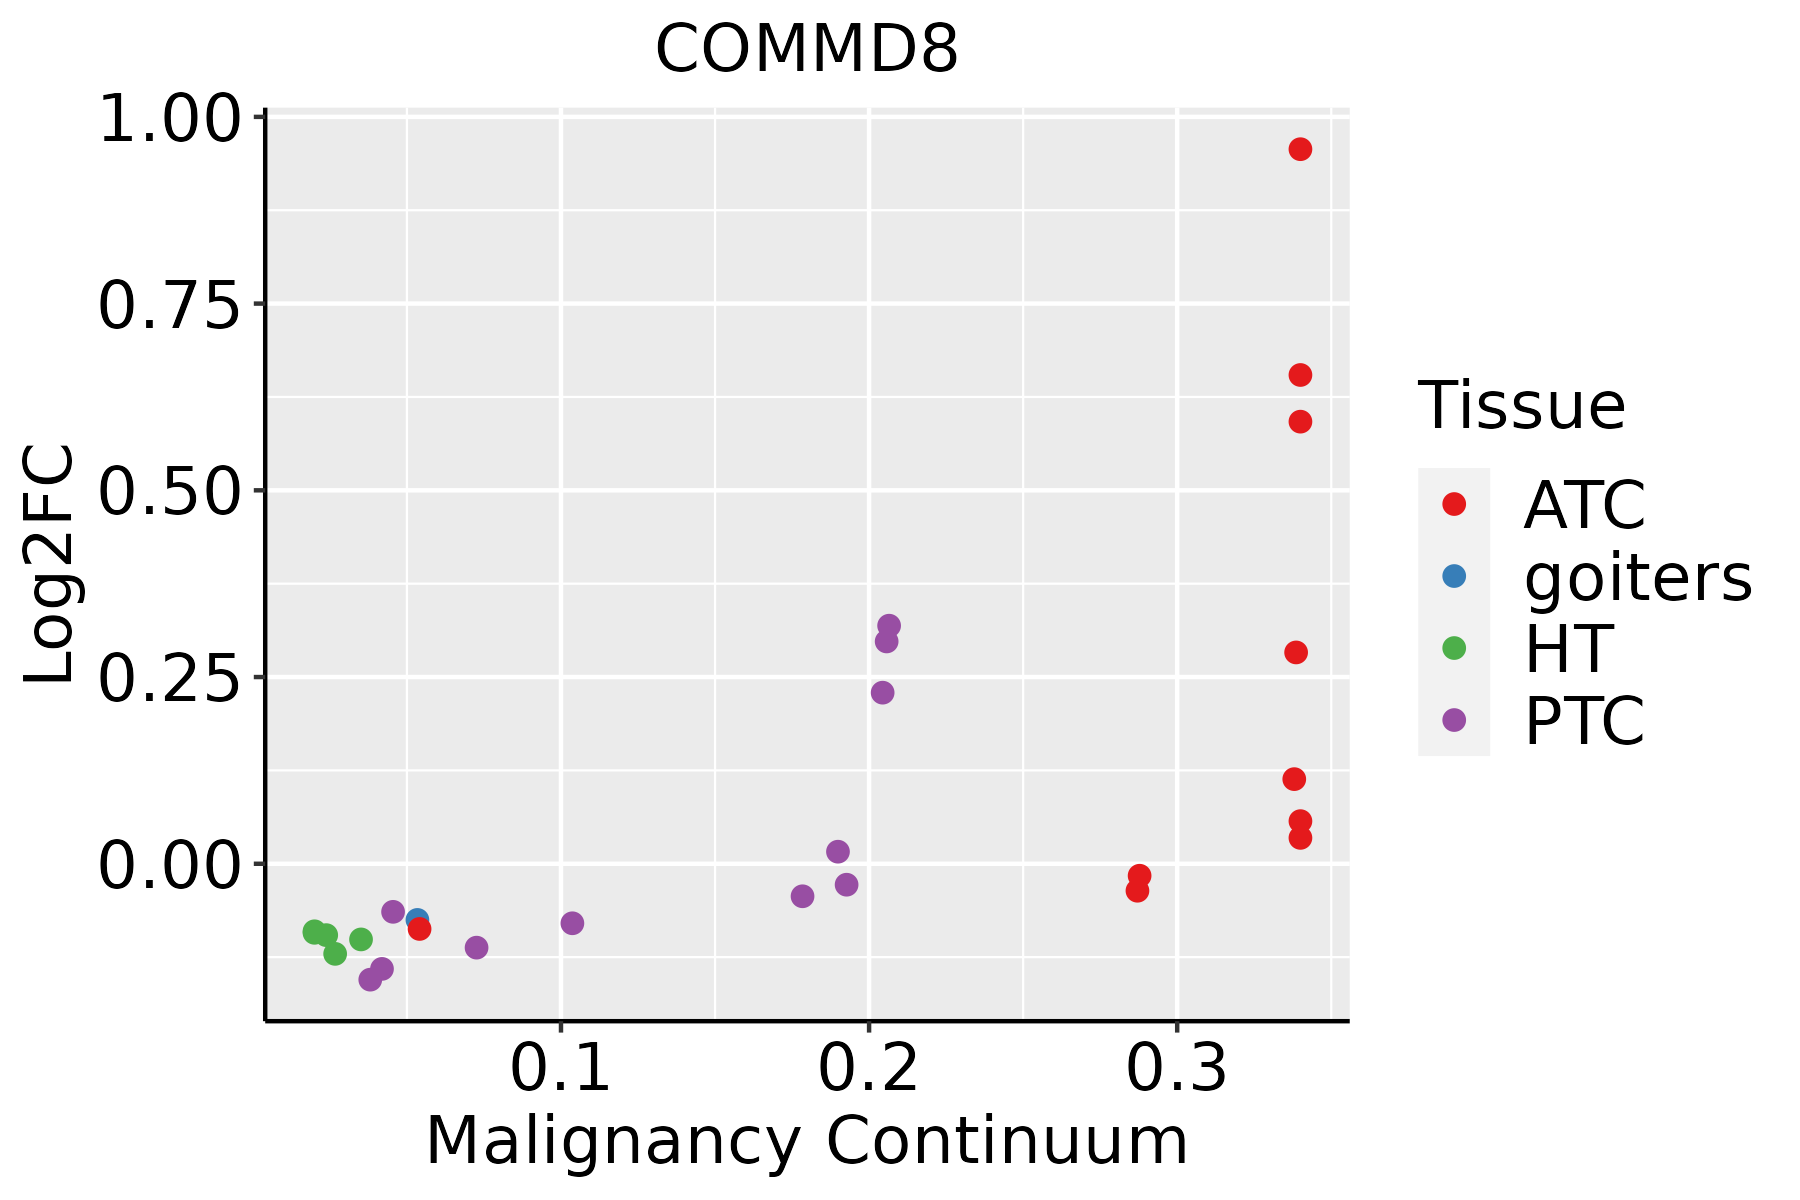 | ATC: Anaplastic thyroid cancer |
| HT: Hashimoto's thyroiditis | ||
| PTC: Papillary thyroid cancer |
| ∗log2FC in expression of this searched gene in stem-like cells from each diseased tissue sample relative to stem-like cells in normal samples in each tissue plotted against the malignancy continuum. Samples are colored based on if they are from different disease stage. |
Top |
Malignant transformation related pathway analysis |
| Find out the enriched GO biological processes and KEGG pathways involved in transition from healthy to precancer to cancer |
| Tissue | Disease Stage | Enriched GO biological Processes |
| Colorectum | AD |  |
| Colorectum | SER |  |
| Colorectum | MSS |  |
| Colorectum | MSI-H |  |
| Colorectum | FAP |  |
| ∗Top 15 enriched GO BP terms are showed in the bar plot of each disease state in each tissue. Each row represents a significant GO biological process which is colored according to the -log10(p.adjust). |
| Page: 1 2 3 4 5 6 7 8 9 |
| GO ID | Tissue | Disease Stage | Description | Gene Ratio | Bg Ratio | pvalue | p.adjust | Count |
| Page: 1 |
| Pathway ID | Tissue | Disease Stage | Description | Gene Ratio | Bg Ratio | pvalue | p.adjust | qvalue | Count |
| Page: 1 |
Top |
Cell-cell communication analysis |
| Identification of potential cell-cell interactions between two cell types and their ligand-receptor pairs for different disease states |
| Ligand | Receptor | LRpair | Pathway | Tissue | Disease Stage |
| Page: 1 |
Top |
Single-cell gene regulatory network inference analysis |
| Find out the significant the regulons (TFs) and the target genes of each regulon across cell types for different disease states |
| TF | Cell Type | Tissue | Disease Stage | Target Gene | RSS | Regulon Activity |
| ∗The dot plots of a searched regulon are shown for all cell subpopulations in each disease state of each tissue based on the regulon specific score inferred using pySCENIC and by calculating the average expression. |
| Page: 1 |
Top |
Somatic mutation of malignant transformation related genes |
| Annotation of somatic variants for genes involved in malignant transformation |
| Hugo Symbol | Variant Class | Variant Classification | dbSNP RS | HGVSc | HGVSp | HGVSp Short | SWISSPROT | BIOTYPE | SIFT | PolyPhen | Tumor Sample Barcode | Tissue | Histology | Sex | Age | Stage | Therapy Types | Drugs | Outcome |
| COMMD8 | SNV | Missense_Mutation | novel | c.371N>G | p.Val124Gly | p.V124G | Q9NX08 | protein_coding | deleterious(0) | benign(0.376) | TCGA-BH-A1FC-01 | Breast | breast invasive carcinoma | Female | >=65 | I/II | Unknown | Unknown | SD |
| COMMD8 | SNV | Missense_Mutation | novel | c.371N>G | p.Val124Gly | p.V124G | Q9NX08 | protein_coding | deleterious(0) | benign(0.376) | TCGA-E9-A1NF-01 | Breast | breast invasive carcinoma | Female | <65 | I/II | Chemotherapy | doxorubicin | PD |
| COMMD8 | SNV | Missense_Mutation | novel | c.440N>G | p.Val147Gly | p.V147G | Q9NX08 | protein_coding | deleterious(0) | possibly_damaging(0.893) | TCGA-VS-A8QF-01 | Cervix | cervical & endocervical cancer | Female | <65 | I/II | Chemotherapy | cisplatin | CR |
| COMMD8 | SNV | Missense_Mutation | c.179A>C | p.Lys60Thr | p.K60T | Q9NX08 | protein_coding | tolerated(0.99) | benign(0) | TCGA-A6-6141-01 | Colorectum | colon adenocarcinoma | Male | <65 | I/II | Chemotherapy | 5-fu | SD | |
| COMMD8 | SNV | Missense_Mutation | c.143C>T | p.Ser48Leu | p.S48L | Q9NX08 | protein_coding | tolerated(1) | benign(0.003) | TCGA-AA-3697-01 | Colorectum | colon adenocarcinoma | Male | >=65 | I/II | Unknown | Unknown | SD | |
| COMMD8 | SNV | Missense_Mutation | c.101N>A | p.Arg34Gln | p.R34Q | Q9NX08 | protein_coding | tolerated(0.2) | possibly_damaging(0.86) | TCGA-AA-A00N-01 | Colorectum | colon adenocarcinoma | Male | >=65 | I/II | Unknown | Unknown | PD | |
| COMMD8 | SNV | Missense_Mutation | c.227N>G | p.Phe76Cys | p.F76C | Q9NX08 | protein_coding | tolerated(0.13) | benign(0.183) | TCGA-AG-A002-01 | Colorectum | rectum adenocarcinoma | Male | <65 | I/II | Unknown | Unknown | SD | |
| COMMD8 | SNV | Missense_Mutation | novel | c.531N>T | p.Lys177Asn | p.K177N | Q9NX08 | protein_coding | deleterious(0) | probably_damaging(0.996) | TCGA-A5-A1OF-01 | Endometrium | uterine corpus endometrioid carcinoma | Female | <65 | I/II | Unknown | Unknown | SD |
| COMMD8 | SNV | Missense_Mutation | novel | c.79N>G | p.Ile27Val | p.I27V | Q9NX08 | protein_coding | tolerated(1) | benign(0.006) | TCGA-AJ-A3EK-01 | Endometrium | uterine corpus endometrioid carcinoma | Female | <65 | I/II | Chemotherapy | carboplatin | CR |
| COMMD8 | SNV | Missense_Mutation | novel | c.121N>T | p.Asp41Tyr | p.D41Y | Q9NX08 | protein_coding | deleterious(0) | probably_damaging(0.979) | TCGA-AP-A0LM-01 | Endometrium | uterine corpus endometrioid carcinoma | Female | <65 | III/IV | Chemotherapy | cisplatin | SD |
| Page: 1 2 3 |
Top |
Related drugs of malignant transformation related genes |
| Identification of chemicals and drugs interact with genes involved in malignant transfromation |
| (DGIdb 4.0) |
| Entrez ID | Symbol | Category | Interaction Types | Drug Claim Name | Drug Name | PMIDs |
| Page: 1 |

Copyright 2023-Present -The University of Texas Health Science Center at Houston |