
|
|||||
|
 | |
| |
| |
| |
| |
| |
|
Gene: COMMD2 |
Gene summary for COMMD2 |
| Gene information | Species | Human | Gene symbol | COMMD2 | Gene ID | 51122 |
| Gene name | COMM domain containing 2 | |
| Gene Alias | HSPC042 | |
| Cytomap | 3q25.1 | |
| Gene Type | protein-coding | GO ID | GO:0005575 | UniProtAcc | Q86X83 |
Top |
Malignant transformation analysis |
| Identification of the aberrant gene expression in precancerous and cancerous lesions by comparing the gene expression of stem-like cells in diseased tissues with normal stem cells |
| Entrez ID | Symbol | Replicates | Species | Organ | Tissue | Adj P-value | Log2FC | Malignancy |
| 51122 | COMMD2 | S015 | Human | Liver | HCC | 6.28e-17 | 1.23e+00 | 0.2375 |
| 51122 | COMMD2 | S016 | Human | Liver | HCC | 1.27e-38 | 1.33e+00 | 0.2243 |
| 51122 | COMMD2 | S027 | Human | Liver | HCC | 2.64e-05 | 7.20e-01 | 0.2446 |
| 51122 | COMMD2 | S028 | Human | Liver | HCC | 4.67e-11 | 8.61e-01 | 0.2503 |
| 51122 | COMMD2 | S029 | Human | Liver | HCC | 7.70e-10 | 7.43e-01 | 0.2581 |
| 51122 | COMMD2 | C04 | Human | Oral cavity | OSCC | 3.44e-29 | 1.17e+00 | 0.2633 |
| 51122 | COMMD2 | C21 | Human | Oral cavity | OSCC | 9.80e-56 | 1.40e+00 | 0.2678 |
| 51122 | COMMD2 | C30 | Human | Oral cavity | OSCC | 6.43e-47 | 1.90e+00 | 0.3055 |
| 51122 | COMMD2 | C38 | Human | Oral cavity | OSCC | 1.52e-19 | 1.26e+00 | 0.172 |
| 51122 | COMMD2 | C43 | Human | Oral cavity | OSCC | 3.09e-23 | 4.75e-01 | 0.1704 |
| 51122 | COMMD2 | C46 | Human | Oral cavity | OSCC | 3.50e-24 | 6.39e-01 | 0.1673 |
| 51122 | COMMD2 | C51 | Human | Oral cavity | OSCC | 6.70e-20 | 8.56e-01 | 0.2674 |
| 51122 | COMMD2 | C57 | Human | Oral cavity | OSCC | 2.08e-46 | 1.12e+00 | 0.1679 |
| 51122 | COMMD2 | C06 | Human | Oral cavity | OSCC | 3.98e-07 | 1.70e+00 | 0.2699 |
| 51122 | COMMD2 | C07 | Human | Oral cavity | OSCC | 2.62e-05 | 9.74e-01 | 0.2491 |
| 51122 | COMMD2 | C08 | Human | Oral cavity | OSCC | 1.26e-60 | 1.20e+00 | 0.1919 |
| 51122 | COMMD2 | C09 | Human | Oral cavity | OSCC | 5.52e-04 | 1.60e-01 | 0.1431 |
| 51122 | COMMD2 | LN22 | Human | Oral cavity | OSCC | 7.36e-10 | 1.30e+00 | 0.1733 |
| 51122 | COMMD2 | LN46 | Human | Oral cavity | OSCC | 9.18e-11 | 5.73e-01 | 0.1666 |
| 51122 | COMMD2 | LP15 | Human | Oral cavity | LP | 2.77e-08 | 1.32e+00 | 0.2174 |
| Page: 1 2 3 4 5 6 7 |
| Tissue | Expression Dynamics | Abbreviation |
| Esophagus |  | ESCC: Esophageal squamous cell carcinoma |
| HGIN: High-grade intraepithelial neoplasias | ||
| LGIN: Low-grade intraepithelial neoplasias | ||
| Liver | 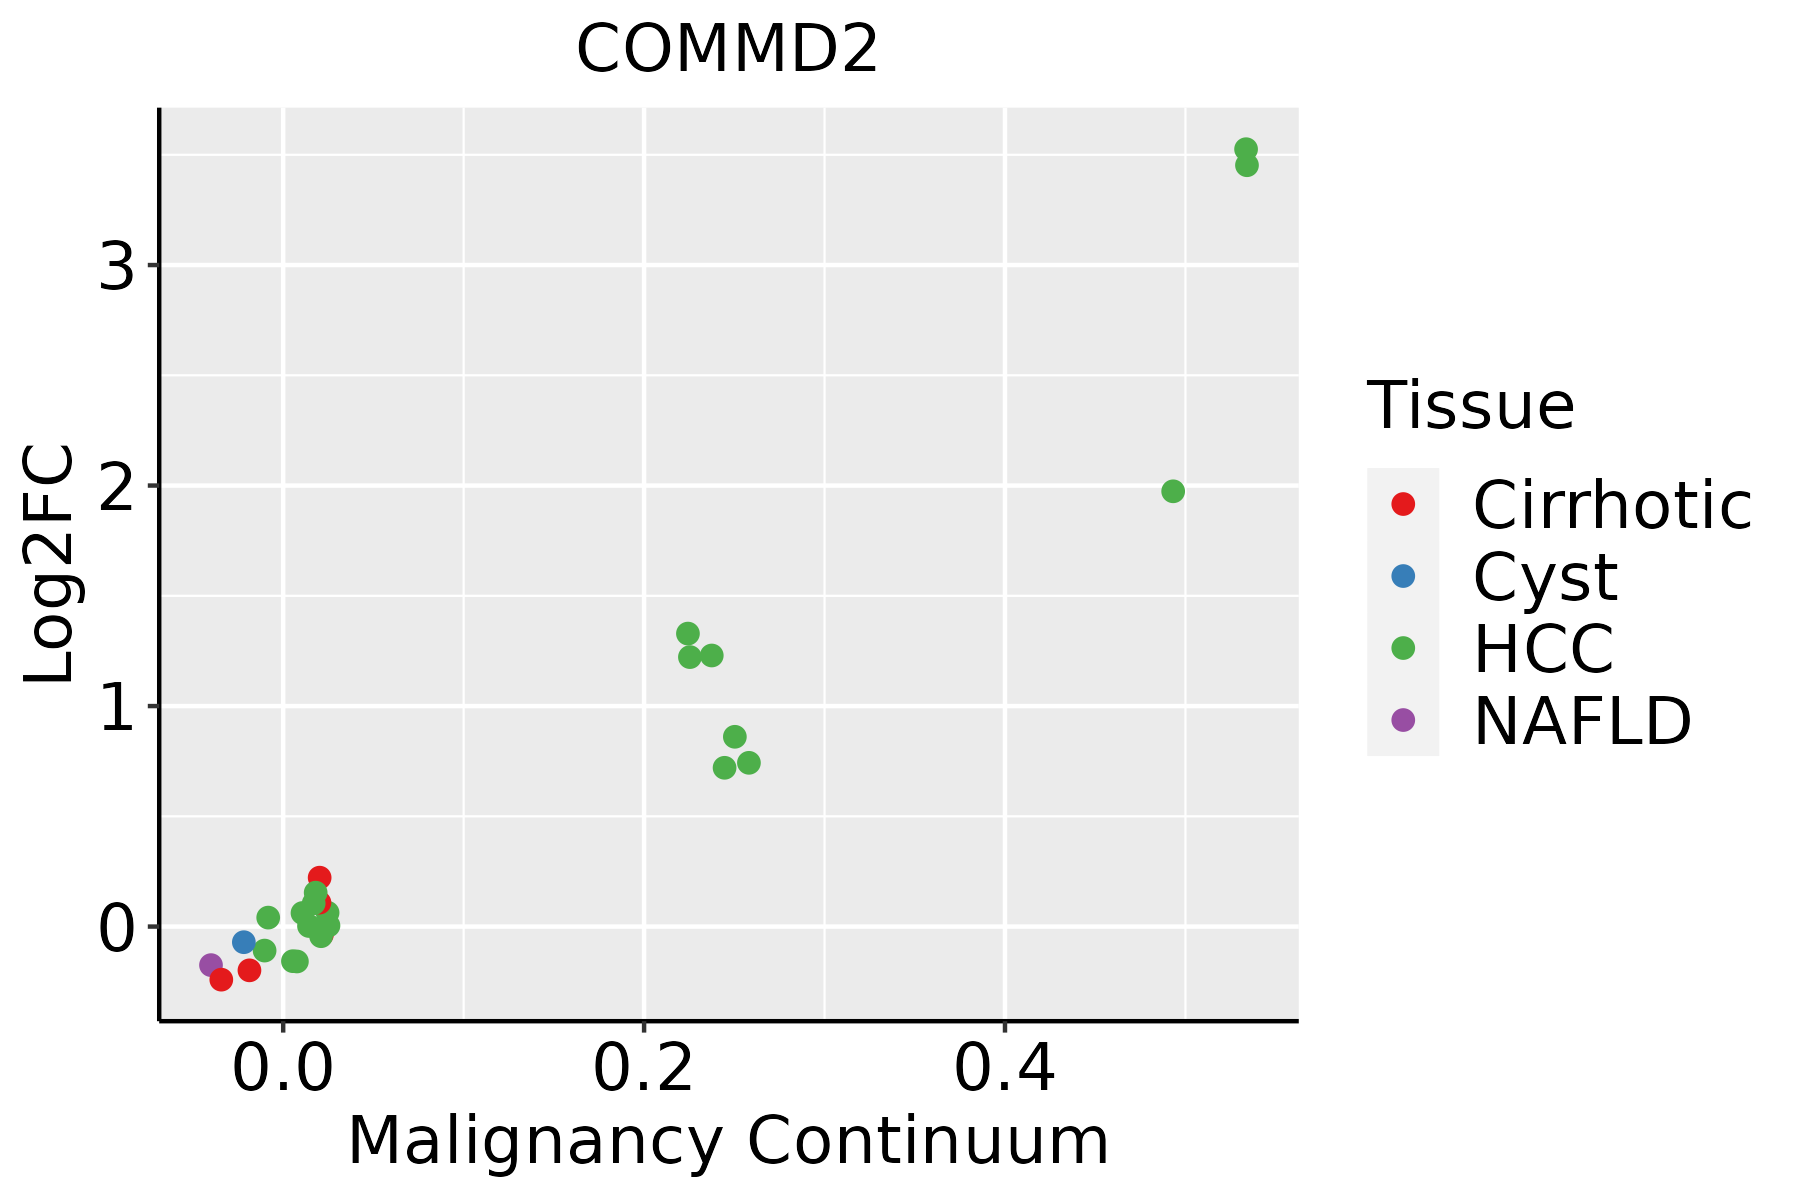 | HCC: Hepatocellular carcinoma |
| NAFLD: Non-alcoholic fatty liver disease | ||
| Oral Cavity | 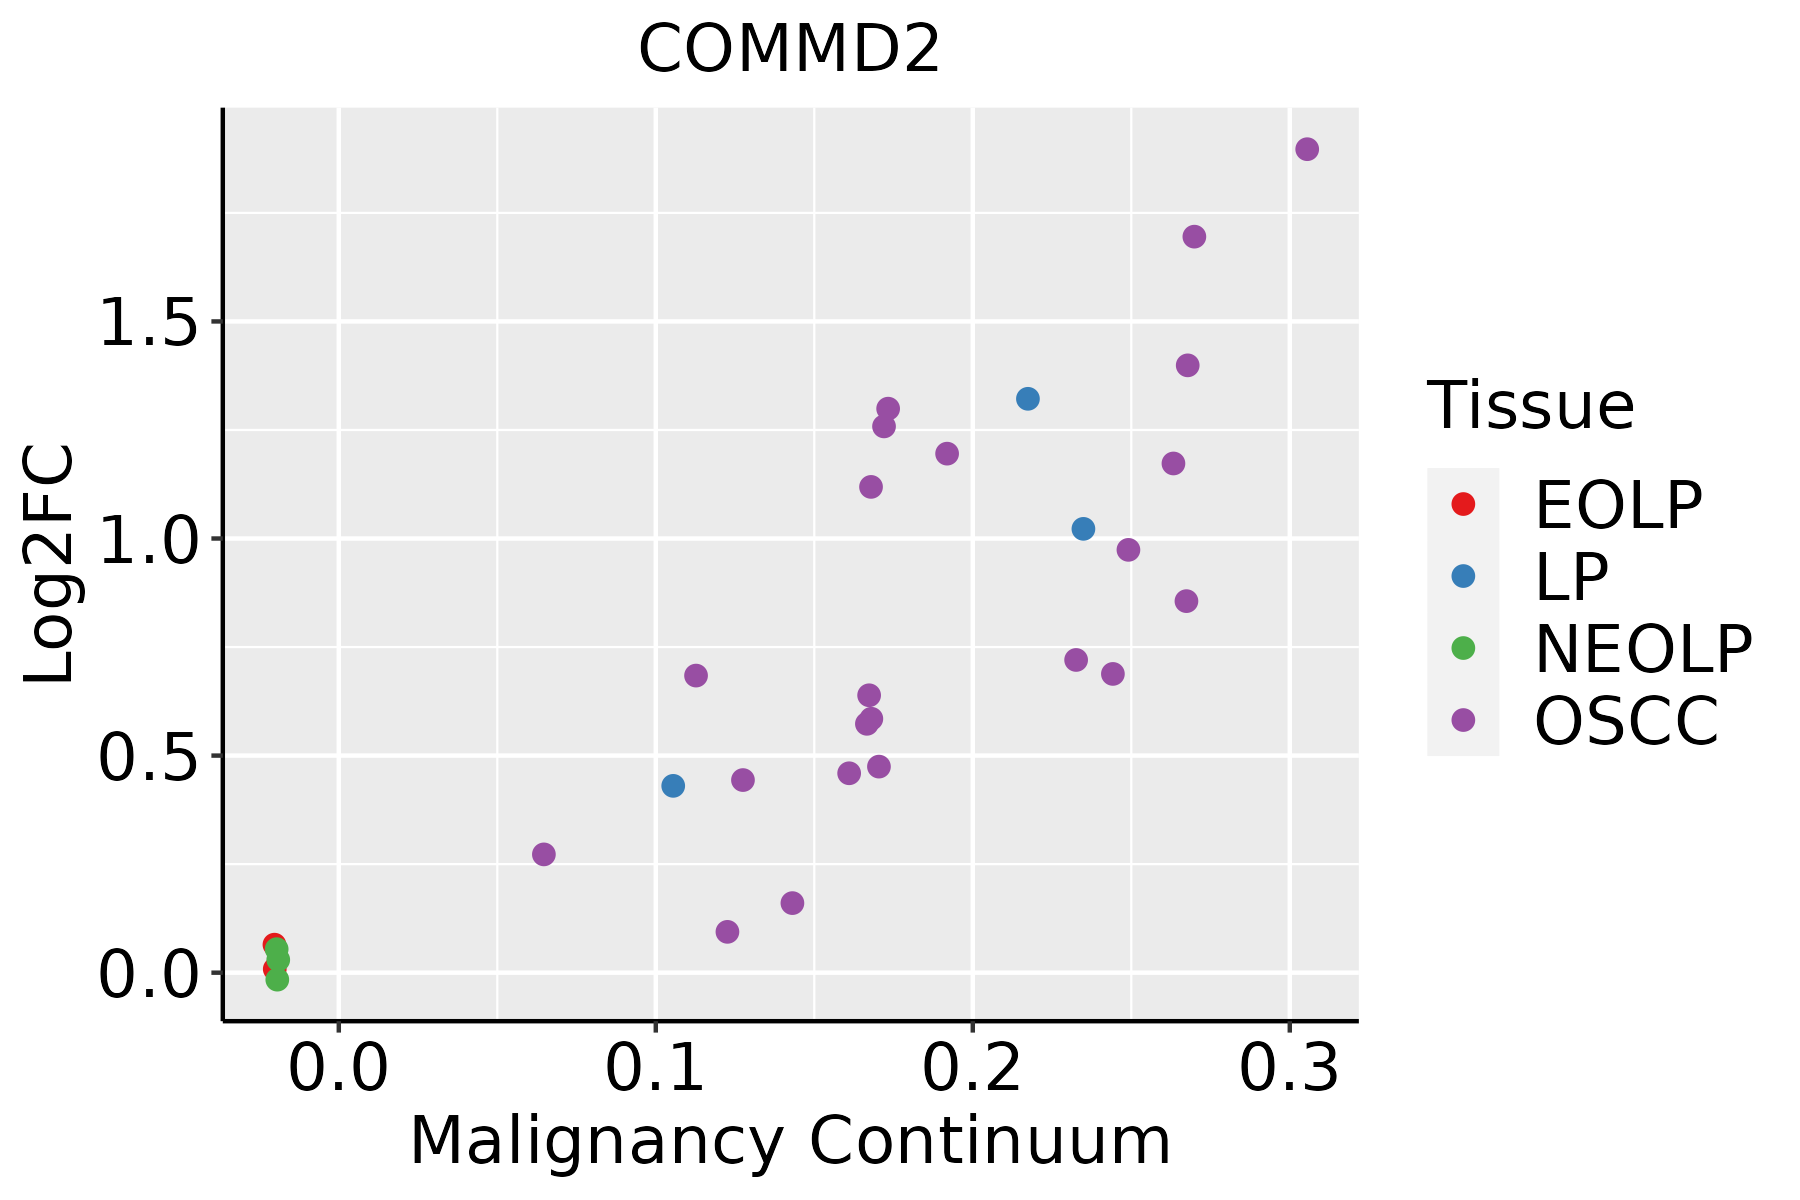 | EOLP: Erosive Oral lichen planus |
| LP: leukoplakia | ||
| NEOLP: Non-erosive oral lichen planus | ||
| OSCC: Oral squamous cell carcinoma | ||
| Skin | 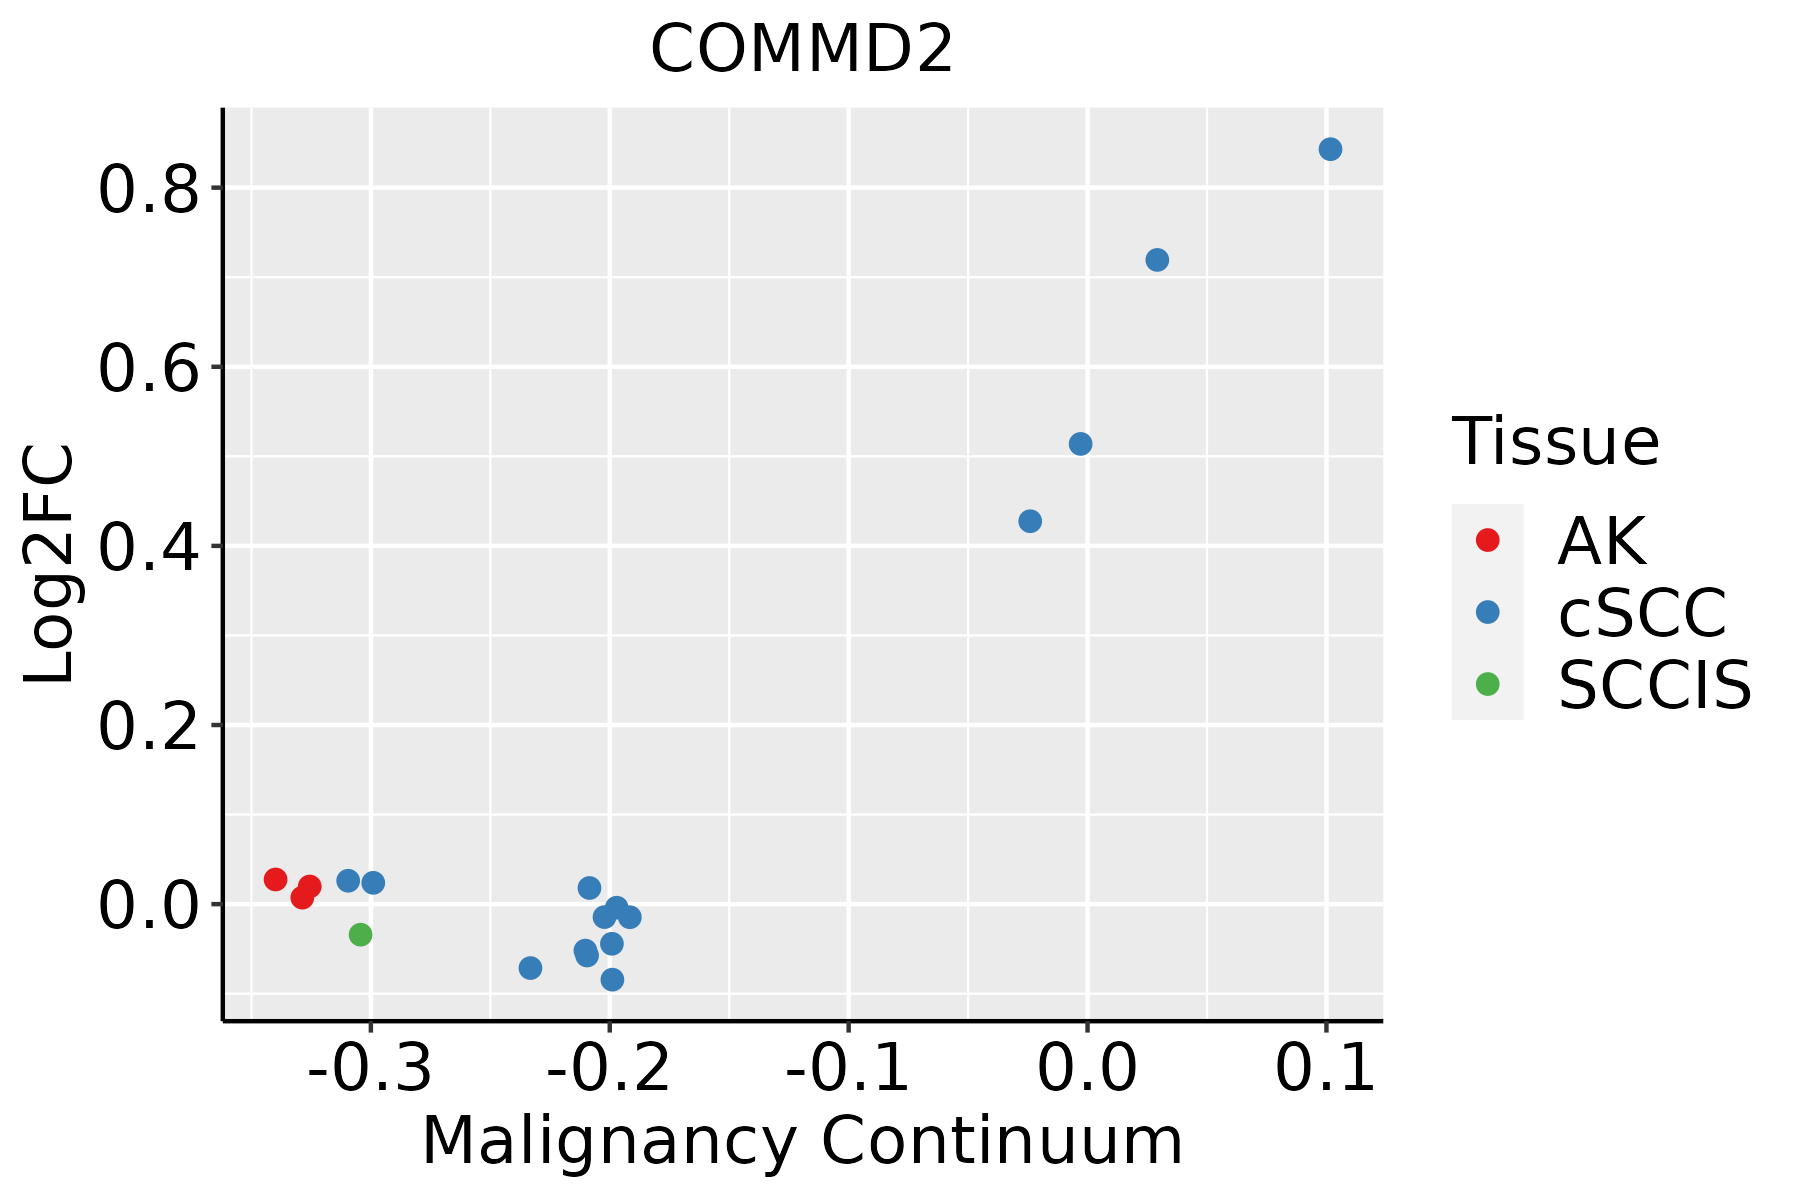 | AK: Actinic keratosis |
| cSCC: Cutaneous squamous cell carcinoma | ||
| SCCIS:squamous cell carcinoma in situ | ||
| Thyroid | 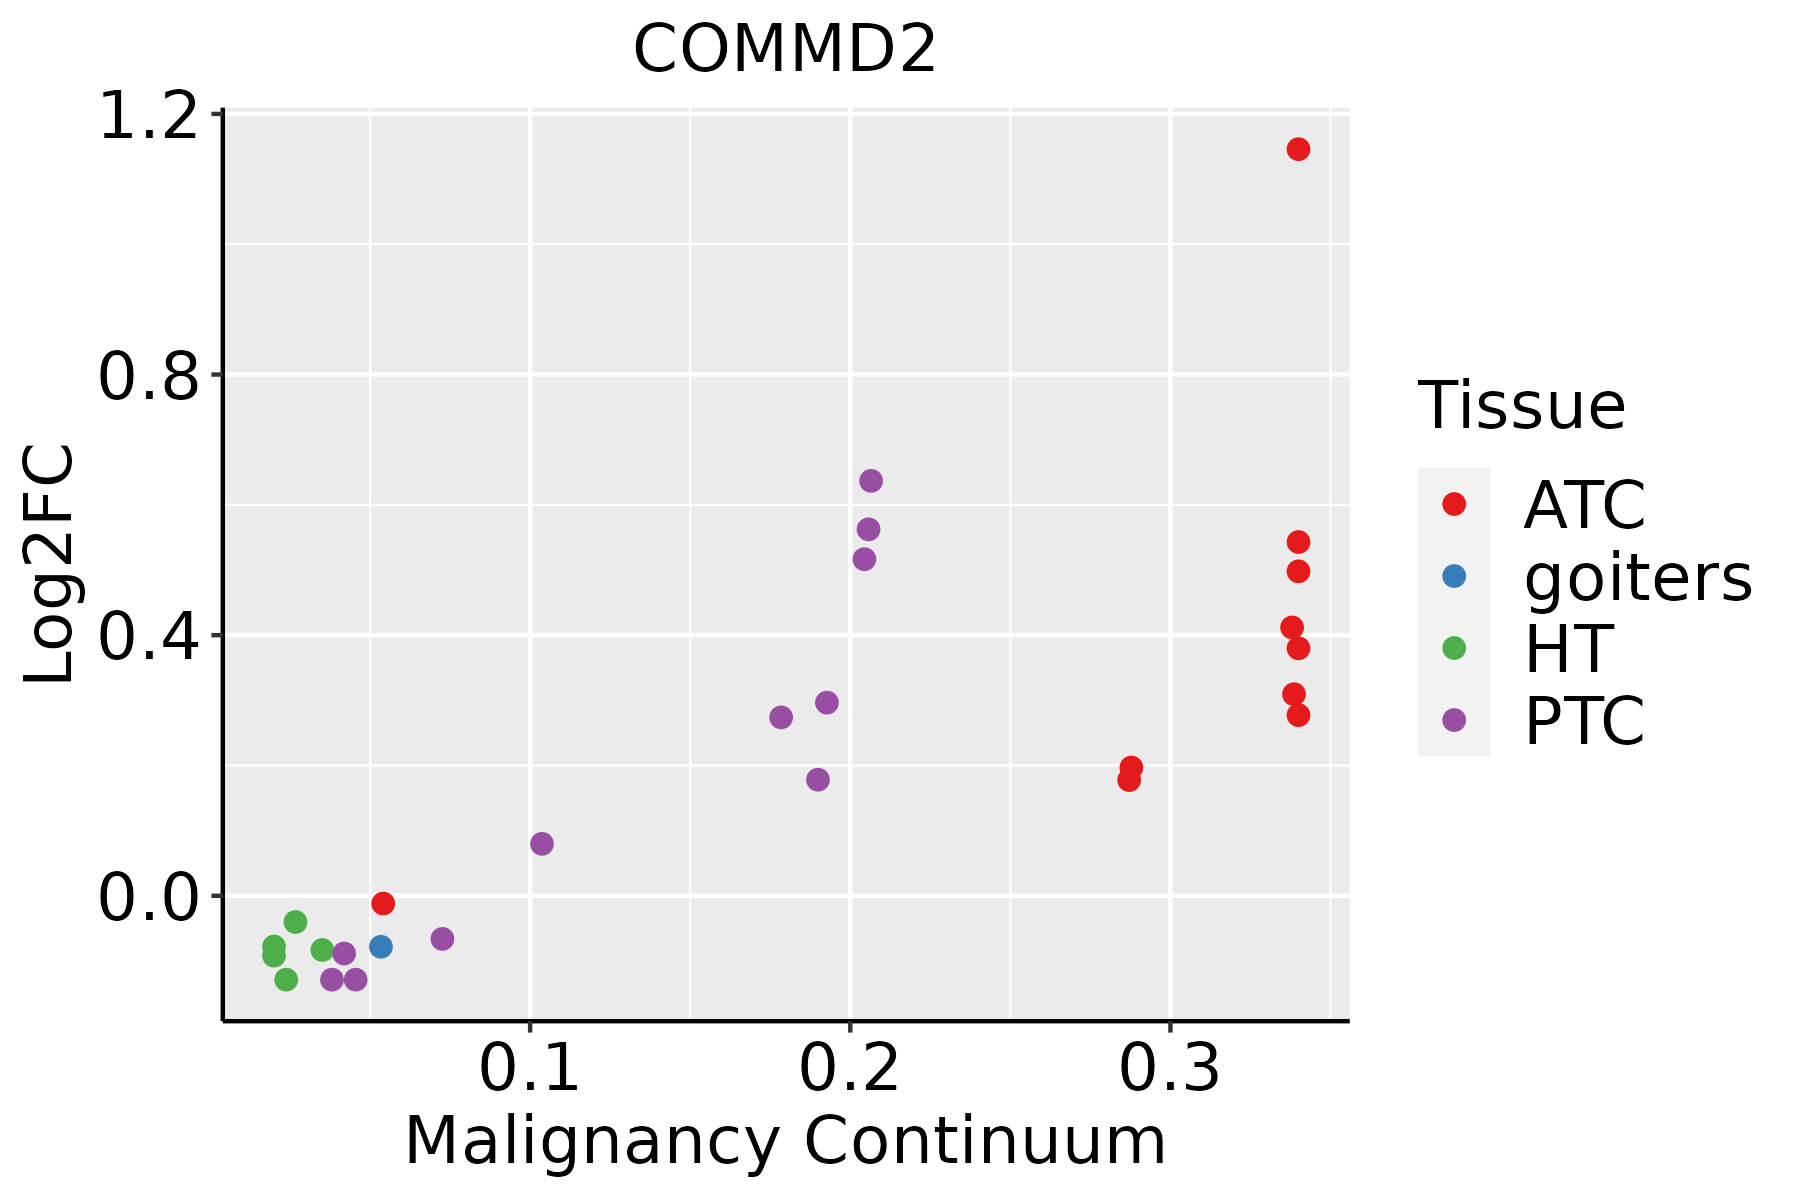 | ATC: Anaplastic thyroid cancer |
| HT: Hashimoto's thyroiditis | ||
| PTC: Papillary thyroid cancer |
| ∗log2FC in expression of this searched gene in stem-like cells from each diseased tissue sample relative to stem-like cells in normal samples in each tissue plotted against the malignancy continuum. Samples are colored based on if they are from different disease stage. |
Top |
Malignant transformation related pathway analysis |
| Find out the enriched GO biological processes and KEGG pathways involved in transition from healthy to precancer to cancer |
| Tissue | Disease Stage | Enriched GO biological Processes |
| Colorectum | AD |  |
| Colorectum | SER |  |
| Colorectum | MSS |  |
| Colorectum | MSI-H |  |
| Colorectum | FAP |  |
| ∗Top 15 enriched GO BP terms are showed in the bar plot of each disease state in each tissue. Each row represents a significant GO biological process which is colored according to the -log10(p.adjust). |
| Page: 1 2 3 4 5 6 7 8 9 |
| GO ID | Tissue | Disease Stage | Description | Gene Ratio | Bg Ratio | pvalue | p.adjust | Count |
| Page: 1 |
| Pathway ID | Tissue | Disease Stage | Description | Gene Ratio | Bg Ratio | pvalue | p.adjust | qvalue | Count |
| Page: 1 |
Top |
Cell-cell communication analysis |
| Identification of potential cell-cell interactions between two cell types and their ligand-receptor pairs for different disease states |
| Ligand | Receptor | LRpair | Pathway | Tissue | Disease Stage |
| Page: 1 |
Top |
Single-cell gene regulatory network inference analysis |
| Find out the significant the regulons (TFs) and the target genes of each regulon across cell types for different disease states |
| TF | Cell Type | Tissue | Disease Stage | Target Gene | RSS | Regulon Activity |
| ∗The dot plots of a searched regulon are shown for all cell subpopulations in each disease state of each tissue based on the regulon specific score inferred using pySCENIC and by calculating the average expression. |
| Page: 1 |
Top |
Somatic mutation of malignant transformation related genes |
| Annotation of somatic variants for genes involved in malignant transformation |
| Hugo Symbol | Variant Class | Variant Classification | dbSNP RS | HGVSc | HGVSp | HGVSp Short | SWISSPROT | BIOTYPE | SIFT | PolyPhen | Tumor Sample Barcode | Tissue | Histology | Sex | Age | Stage | Therapy Types | Drugs | Outcome |
| COMMD2 | SNV | Missense_Mutation | novel | c.305N>C | p.Leu102Pro | p.L102P | Q86X83 | protein_coding | deleterious(0.01) | probably_damaging(0.915) | TCGA-EW-A6SB-01 | Breast | breast invasive carcinoma | Female | <65 | I/II | Unknown | Unknown | SD |
| COMMD2 | deletion | In_Frame_Del | c.100_102delNNN | p.Phe34del | p.F34del | Q86X83 | protein_coding | TCGA-A8-A09V-01 | Breast | breast invasive carcinoma | Female | <65 | I/II | Hormone Therapy | tamoxiphen | SD | |||
| COMMD2 | SNV | Missense_Mutation | novel | c.478N>T | p.His160Tyr | p.H160Y | Q86X83 | protein_coding | tolerated(0.09) | benign(0.084) | TCGA-EA-A3HU-01 | Cervix | cervical & endocervical cancer | Female | <65 | I/II | Unknown | Unknown | SD |
| COMMD2 | SNV | Missense_Mutation | c.517N>T | p.Leu173Phe | p.L173F | Q86X83 | protein_coding | tolerated(0.06) | possibly_damaging(0.626) | TCGA-AA-3710-01 | Colorectum | colon adenocarcinoma | Female | >=65 | I/II | Unknown | Unknown | SD | |
| COMMD2 | SNV | Missense_Mutation | c.387G>T | p.Trp129Cys | p.W129C | Q86X83 | protein_coding | deleterious(0) | probably_damaging(0.997) | TCGA-AA-3815-01 | Colorectum | colon adenocarcinoma | Female | >=65 | I/II | Unknown | Unknown | SD | |
| COMMD2 | SNV | Missense_Mutation | rs779093793 | c.586N>T | p.Arg196Cys | p.R196C | Q86X83 | protein_coding | deleterious(0) | probably_damaging(1) | TCGA-AA-A00N-01 | Colorectum | colon adenocarcinoma | Male | >=65 | I/II | Unknown | Unknown | PD |
| COMMD2 | SNV | Missense_Mutation | c.439G>A | p.Ala147Thr | p.A147T | Q86X83 | protein_coding | tolerated(0.44) | benign(0.003) | TCGA-AA-A010-01 | Colorectum | colon adenocarcinoma | Female | <65 | I/II | Chemotherapy | folinic | CR | |
| COMMD2 | SNV | Missense_Mutation | novel | c.290A>G | p.Lys97Arg | p.K97R | Q86X83 | protein_coding | tolerated(0.25) | benign(0.018) | TCGA-AG-3892-01 | Colorectum | rectum adenocarcinoma | Female | <65 | I/II | Unknown | Unknown | SD |
| COMMD2 | SNV | Missense_Mutation | rs373377514 | c.49C>T | p.Pro17Ser | p.P17S | Q86X83 | protein_coding | tolerated(0.63) | benign(0.012) | TCGA-AP-A1DK-01 | Endometrium | uterine corpus endometrioid carcinoma | Female | <65 | I/II | Unknown | Unknown | SD |
| COMMD2 | SNV | Missense_Mutation | novel | c.293N>C | p.Leu98Ser | p.L98S | Q86X83 | protein_coding | tolerated(0.4) | benign(0.081) | TCGA-AX-A1CE-01 | Endometrium | uterine corpus endometrioid carcinoma | Female | <65 | I/II | Unspecific | Paclitaxel | SD |
| Page: 1 2 |
Top |
Related drugs of malignant transformation related genes |
| Identification of chemicals and drugs interact with genes involved in malignant transfromation |
| (DGIdb 4.0) |
| Entrez ID | Symbol | Category | Interaction Types | Drug Claim Name | Drug Name | PMIDs |
| Page: 1 |

Copyright 2023-Present -The University of Texas Health Science Center at Houston |