
|
|||||
|
 | |
| |
| |
| |
| |
| |
|
Gene: CNPY3 |
Gene summary for CNPY3 |
| Gene information | Species | Human | Gene symbol | CNPY3 | Gene ID | 10695 |
| Gene name | canopy FGF signaling regulator 3 | |
| Gene Alias | CAG4A | |
| Cytomap | 6p21.1 | |
| Gene Type | protein-coding | GO ID | GO:0002376 | UniProtAcc | Q9BT09 |
Top |
Malignant transformation analysis |
| Identification of the aberrant gene expression in precancerous and cancerous lesions by comparing the gene expression of stem-like cells in diseased tissues with normal stem cells |
| Entrez ID | Symbol | Replicates | Species | Organ | Tissue | Adj P-value | Log2FC | Malignancy |
| 10695 | CNPY3 | S015 | Human | Liver | HCC | 1.01e-37 | 1.75e+00 | 0.2375 |
| 10695 | CNPY3 | S016 | Human | Liver | HCC | 3.07e-43 | 1.39e+00 | 0.2243 |
| 10695 | CNPY3 | S027 | Human | Liver | HCC | 7.24e-11 | 7.61e-01 | 0.2446 |
| 10695 | CNPY3 | S028 | Human | Liver | HCC | 4.16e-18 | 7.18e-01 | 0.2503 |
| 10695 | CNPY3 | S029 | Human | Liver | HCC | 2.16e-22 | 9.45e-01 | 0.2581 |
| 10695 | CNPY3 | C04 | Human | Oral cavity | OSCC | 1.69e-20 | 1.14e+00 | 0.2633 |
| 10695 | CNPY3 | C21 | Human | Oral cavity | OSCC | 9.11e-62 | 1.75e+00 | 0.2678 |
| 10695 | CNPY3 | C30 | Human | Oral cavity | OSCC | 1.68e-56 | 2.51e+00 | 0.3055 |
| 10695 | CNPY3 | C38 | Human | Oral cavity | OSCC | 6.36e-09 | 1.22e+00 | 0.172 |
| 10695 | CNPY3 | C43 | Human | Oral cavity | OSCC | 1.57e-14 | 3.88e-01 | 0.1704 |
| 10695 | CNPY3 | C46 | Human | Oral cavity | OSCC | 1.09e-35 | 8.85e-01 | 0.1673 |
| 10695 | CNPY3 | C51 | Human | Oral cavity | OSCC | 7.54e-18 | 1.12e+00 | 0.2674 |
| 10695 | CNPY3 | C57 | Human | Oral cavity | OSCC | 2.04e-12 | 5.38e-01 | 0.1679 |
| 10695 | CNPY3 | C06 | Human | Oral cavity | OSCC | 4.41e-11 | 1.58e+00 | 0.2699 |
| 10695 | CNPY3 | C07 | Human | Oral cavity | OSCC | 8.15e-05 | 1.22e+00 | 0.2491 |
| 10695 | CNPY3 | C08 | Human | Oral cavity | OSCC | 5.30e-37 | 8.13e-01 | 0.1919 |
| 10695 | CNPY3 | C09 | Human | Oral cavity | OSCC | 4.85e-11 | 4.91e-01 | 0.1431 |
| 10695 | CNPY3 | LN22 | Human | Oral cavity | OSCC | 1.83e-12 | 1.35e+00 | 0.1733 |
| 10695 | CNPY3 | LN46 | Human | Oral cavity | OSCC | 4.07e-19 | 8.96e-01 | 0.1666 |
| 10695 | CNPY3 | LP15 | Human | Oral cavity | LP | 9.50e-08 | 1.60e+00 | 0.2174 |
| Page: 1 2 3 4 5 6 7 |
| Tissue | Expression Dynamics | Abbreviation |
| Esophagus |  | ESCC: Esophageal squamous cell carcinoma |
| HGIN: High-grade intraepithelial neoplasias | ||
| LGIN: Low-grade intraepithelial neoplasias | ||
| Liver |  | HCC: Hepatocellular carcinoma |
| NAFLD: Non-alcoholic fatty liver disease | ||
| Oral Cavity | 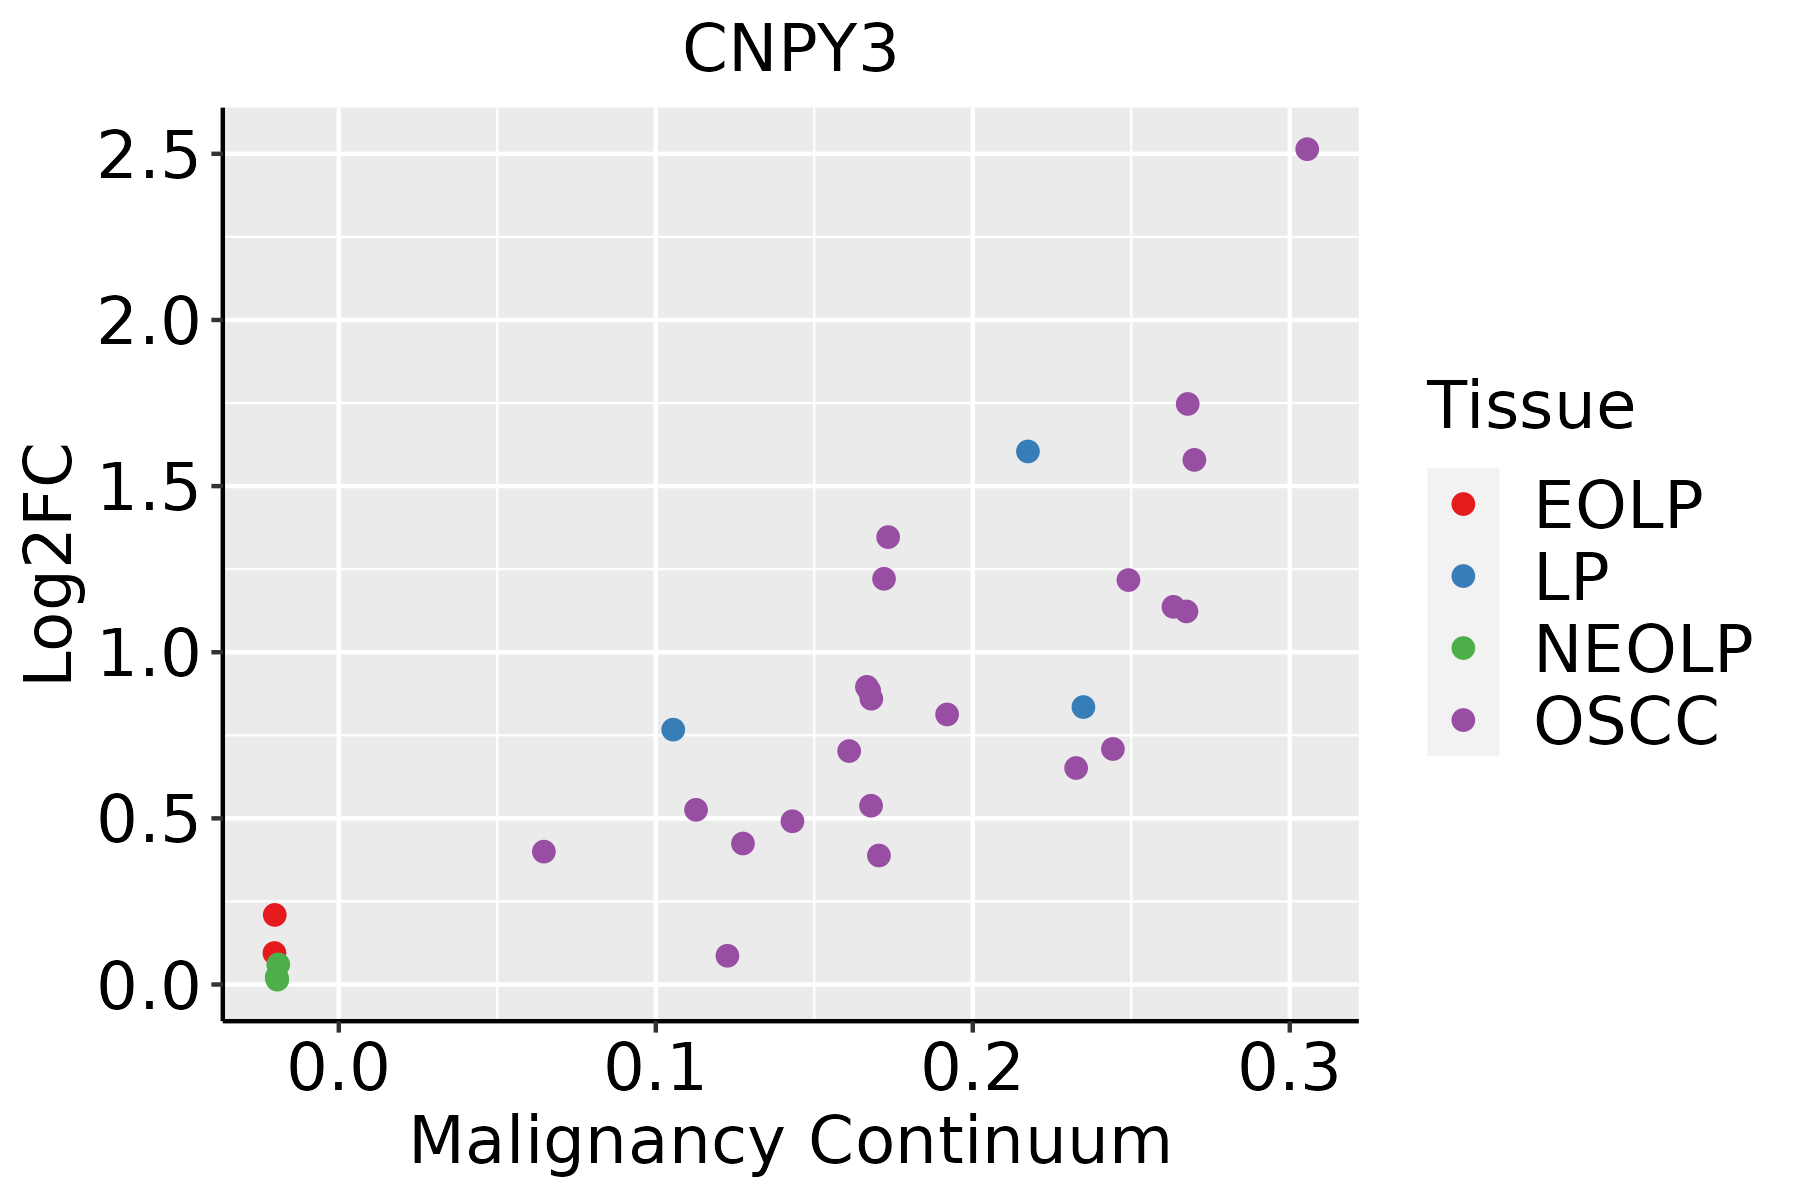 | EOLP: Erosive Oral lichen planus |
| LP: leukoplakia | ||
| NEOLP: Non-erosive oral lichen planus | ||
| OSCC: Oral squamous cell carcinoma | ||
| Skin | 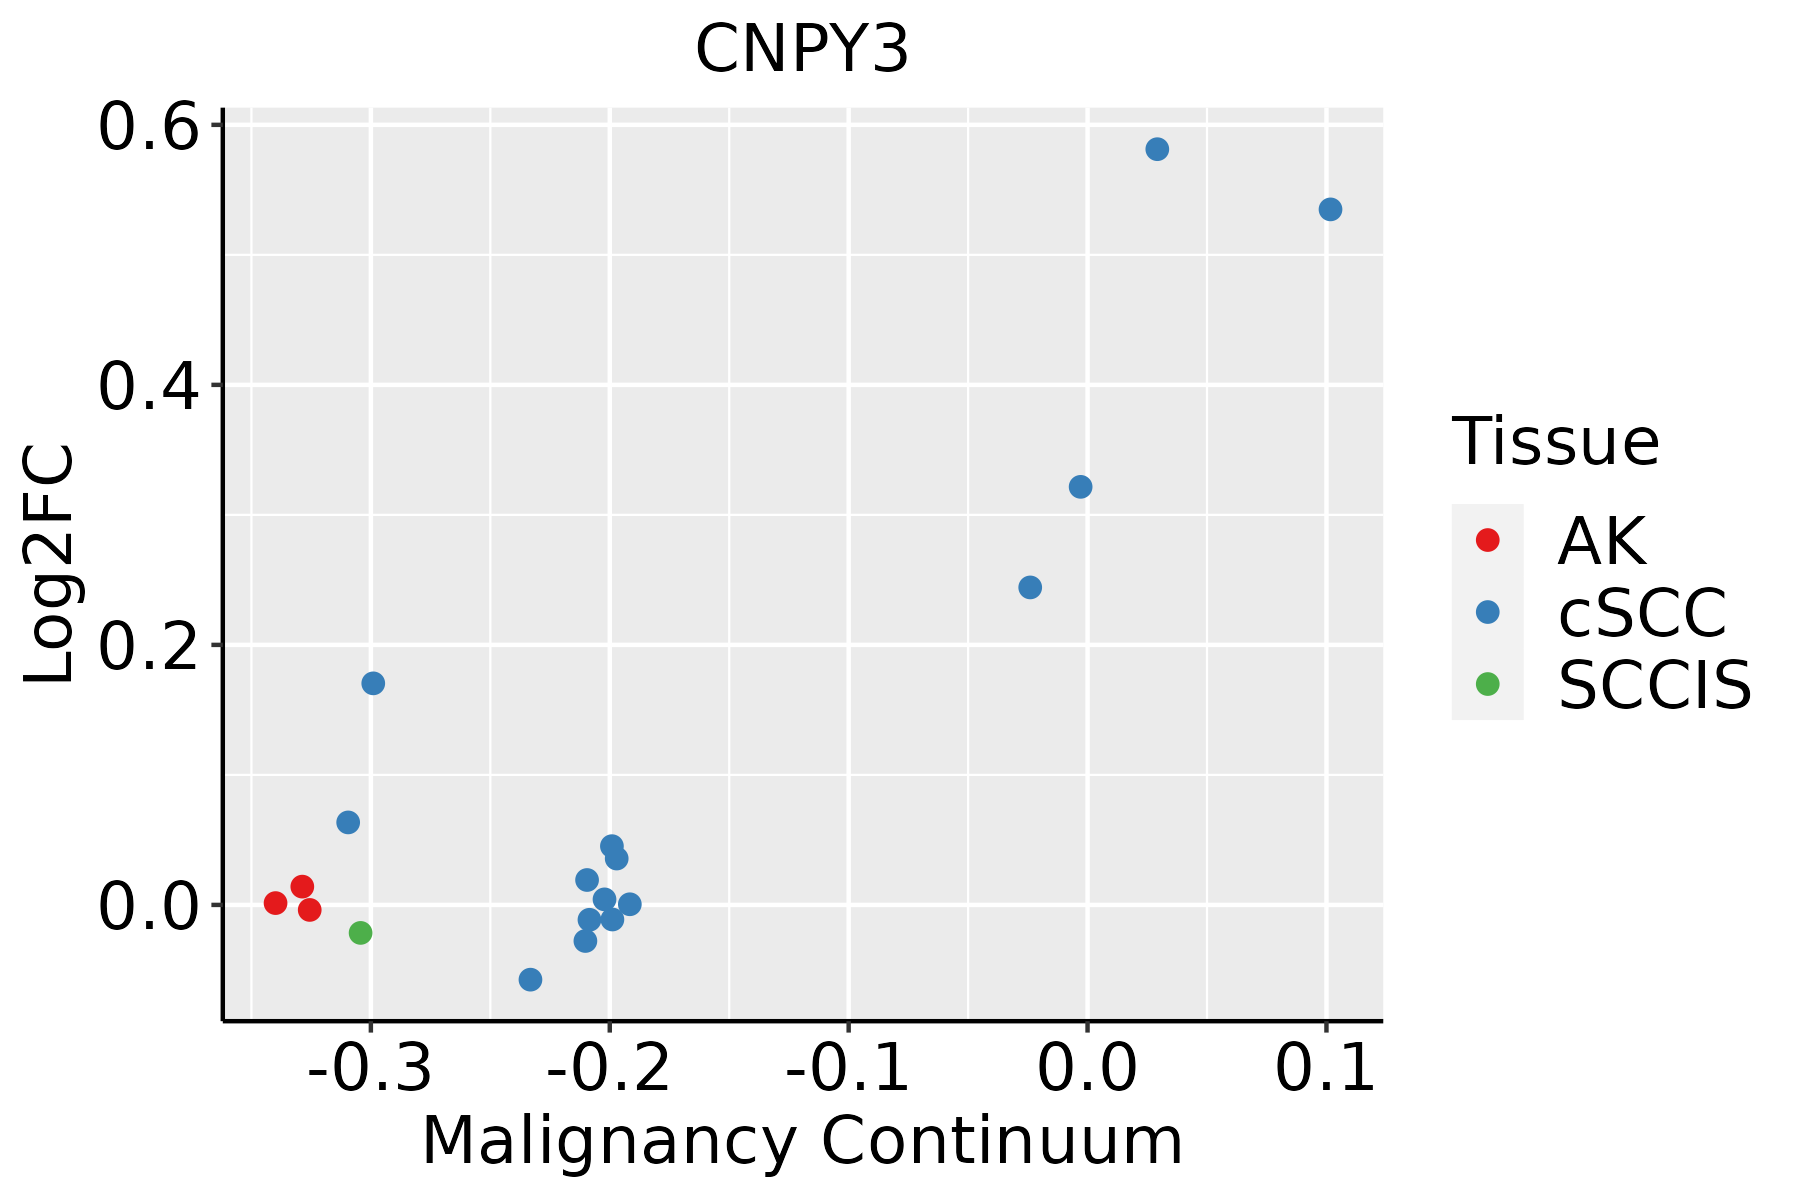 | AK: Actinic keratosis |
| cSCC: Cutaneous squamous cell carcinoma | ||
| SCCIS:squamous cell carcinoma in situ | ||
| Thyroid | 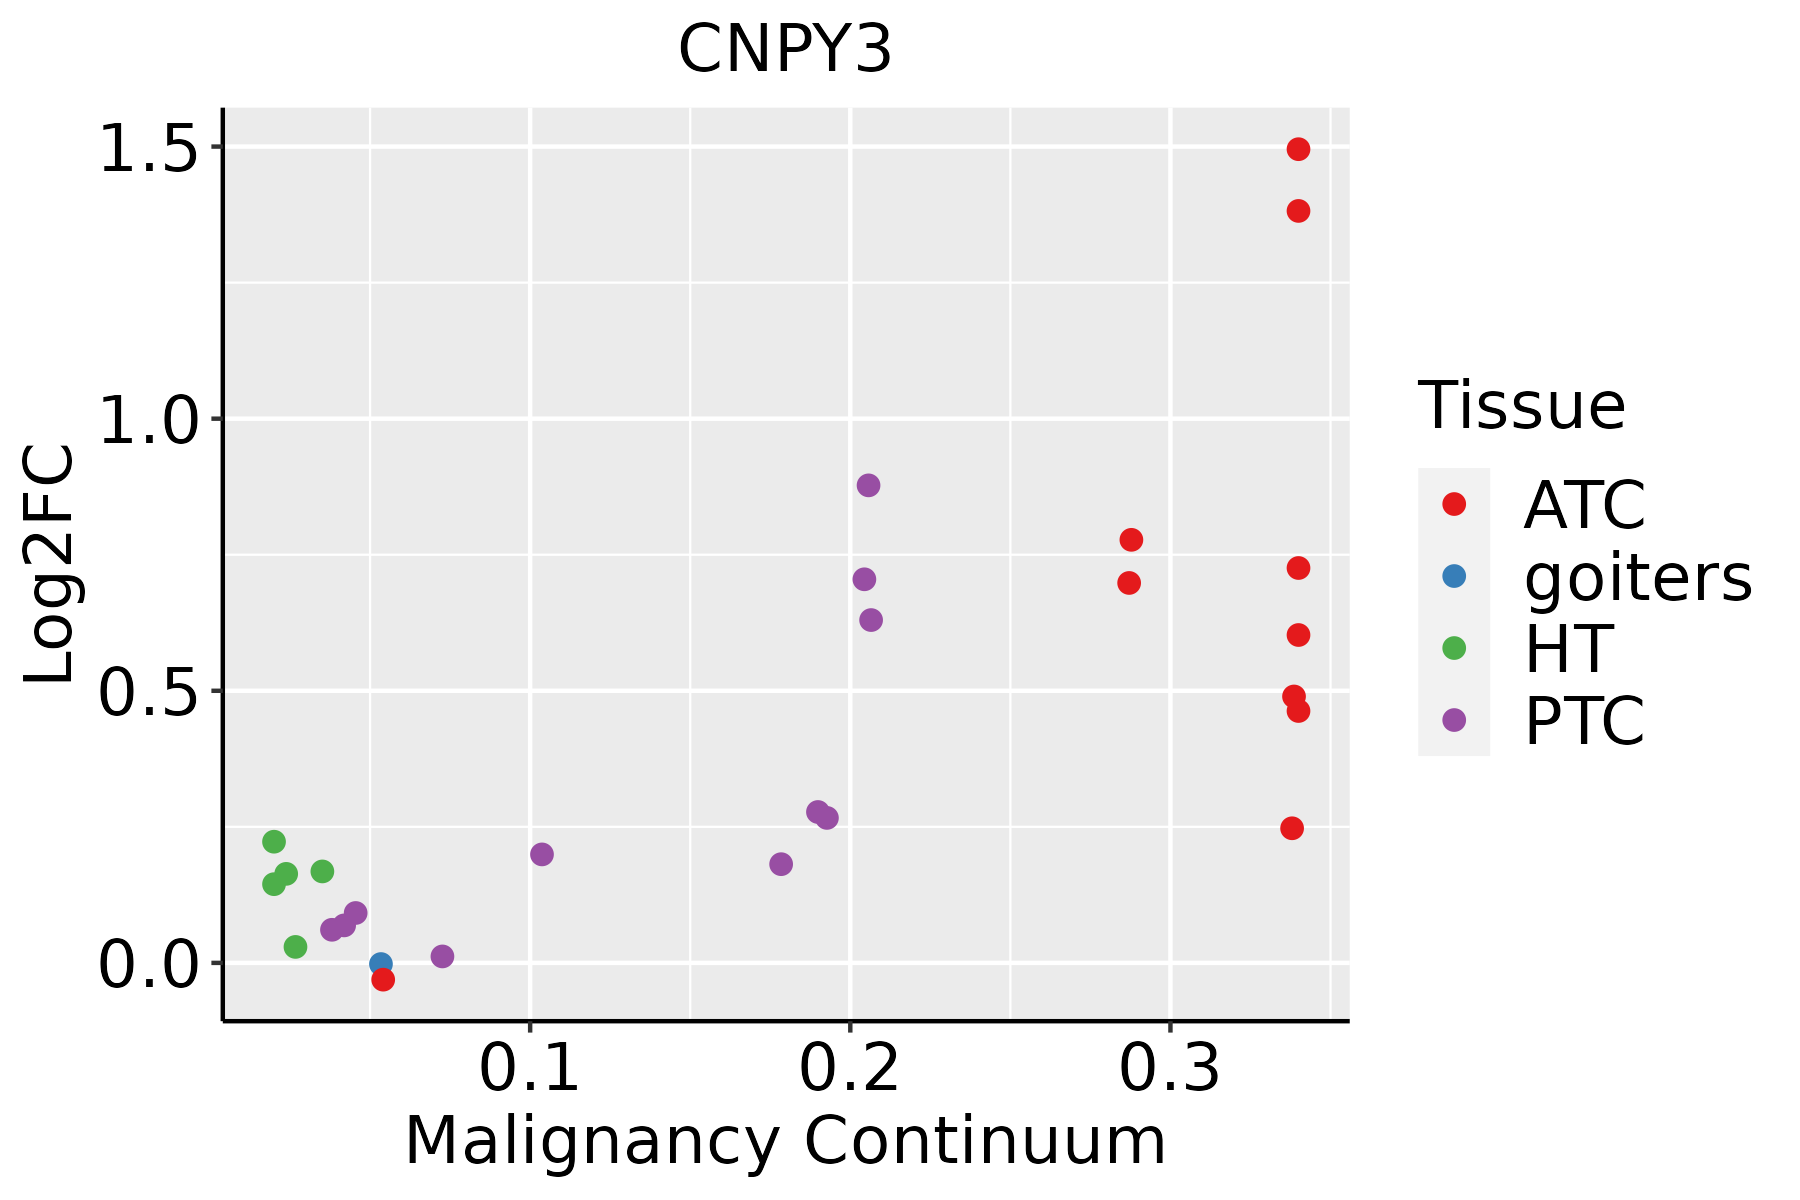 | ATC: Anaplastic thyroid cancer |
| HT: Hashimoto's thyroiditis | ||
| PTC: Papillary thyroid cancer |
| ∗log2FC in expression of this searched gene in stem-like cells from each diseased tissue sample relative to stem-like cells in normal samples in each tissue plotted against the malignancy continuum. Samples are colored based on if they are from different disease stage. |
Top |
Malignant transformation related pathway analysis |
| Find out the enriched GO biological processes and KEGG pathways involved in transition from healthy to precancer to cancer |
| Tissue | Disease Stage | Enriched GO biological Processes |
| Colorectum | AD |  |
| Colorectum | SER |  |
| Colorectum | MSS |  |
| Colorectum | MSI-H |  |
| Colorectum | FAP |  |
| ∗Top 15 enriched GO BP terms are showed in the bar plot of each disease state in each tissue. Each row represents a significant GO biological process which is colored according to the -log10(p.adjust). |
| Page: 1 2 3 4 5 6 7 8 9 |
| GO ID | Tissue | Disease Stage | Description | Gene Ratio | Bg Ratio | pvalue | p.adjust | Count |
| Page: 1 |
| Pathway ID | Tissue | Disease Stage | Description | Gene Ratio | Bg Ratio | pvalue | p.adjust | qvalue | Count |
| Page: 1 |
Top |
Cell-cell communication analysis |
| Identification of potential cell-cell interactions between two cell types and their ligand-receptor pairs for different disease states |
| Ligand | Receptor | LRpair | Pathway | Tissue | Disease Stage |
| Page: 1 |
Top |
Single-cell gene regulatory network inference analysis |
| Find out the significant the regulons (TFs) and the target genes of each regulon across cell types for different disease states |
| TF | Cell Type | Tissue | Disease Stage | Target Gene | RSS | Regulon Activity |
| ∗The dot plots of a searched regulon are shown for all cell subpopulations in each disease state of each tissue based on the regulon specific score inferred using pySCENIC and by calculating the average expression. |
| Page: 1 |
Top |
Somatic mutation of malignant transformation related genes |
| Annotation of somatic variants for genes involved in malignant transformation |
| Hugo Symbol | Variant Class | Variant Classification | dbSNP RS | HGVSc | HGVSp | HGVSp Short | SWISSPROT | BIOTYPE | SIFT | PolyPhen | Tumor Sample Barcode | Tissue | Histology | Sex | Age | Stage | Therapy Types | Drugs | Outcome |
| CNPY3 | SNV | Missense_Mutation | rs371606876 | c.712N>A | p.Gly238Ser | p.G238S | Q9BT09 | protein_coding | tolerated(0.36) | benign(0) | TCGA-AC-A2QH-01 | Breast | breast invasive carcinoma | Female | <65 | I/II | Chemotherapy | cytoxan | CR |
| CNPY3 | SNV | Missense_Mutation | c.667N>C | p.Gly223Arg | p.G223R | Q9BT09 | protein_coding | tolerated(0.23) | benign(0.11) | TCGA-AR-A1AQ-01 | Breast | breast invasive carcinoma | Female | <65 | I/II | Chemotherapy | doxorubicin | SD | |
| CNPY3 | insertion | Frame_Shift_Ins | novel | c.255_256insA | p.Gly86ArgfsTer16 | p.G86Rfs*16 | Q9BT09 | protein_coding | TCGA-A8-A096-01 | Breast | breast invasive carcinoma | Female | >=65 | I/II | Unknown | Unknown | SD | ||
| CNPY3 | insertion | In_Frame_Ins | novel | c.257_258insATTTCTATTTTATCT | p.Gly86_Val87insPheLeuPheTyrLeu | p.G86_V87insFLFYL | Q9BT09 | protein_coding | TCGA-A8-A096-01 | Breast | breast invasive carcinoma | Female | >=65 | I/II | Unknown | Unknown | SD | ||
| CNPY3 | SNV | Missense_Mutation | c.619N>A | p.Leu207Met | p.L207M | Q9BT09 | protein_coding | deleterious(0.01) | probably_damaging(0.999) | TCGA-AA-3713-01 | Colorectum | colon adenocarcinoma | Male | >=65 | III/IV | Chemotherapy | 5-fluorouracil | PR | |
| CNPY3 | SNV | Missense_Mutation | novel | c.622N>A | p.Ala208Thr | p.A208T | Q9BT09 | protein_coding | tolerated(0.59) | benign(0.005) | TCGA-AZ-4315-01 | Colorectum | colon adenocarcinoma | Male | <65 | I/II | Unknown | Unknown | SD |
| CNPY3 | SNV | Missense_Mutation | novel | c.712N>T | p.Gly238Cys | p.G238C | Q9BT09 | protein_coding | deleterious(0.01) | benign(0.189) | TCGA-DM-A288-01 | Colorectum | colon adenocarcinoma | Male | >=65 | III/IV | Unknown | Unknown | PD |
| CNPY3 | insertion | Frame_Shift_Ins | novel | c.818_819insC | p.Asp276Ter | p.D276* | Q9BT09 | protein_coding | TCGA-AD-5900-01 | Colorectum | colon adenocarcinoma | Male | >=65 | I/II | Unknown | Unknown | SD | ||
| CNPY3 | SNV | Missense_Mutation | rs755208427 | c.224C>T | p.Thr75Met | p.T75M | Q9BT09 | protein_coding | tolerated(0.19) | probably_damaging(0.993) | TCGA-A5-A0GB-01 | Endometrium | uterine corpus endometrioid carcinoma | Female | >=65 | I/II | Unknown | Unknown | SD |
| CNPY3 | SNV | Missense_Mutation | rs746471637 | c.292N>A | p.Glu98Lys | p.E98K | Q9BT09 | protein_coding | deleterious(0) | probably_damaging(0.996) | TCGA-A5-A2K5-01 | Endometrium | uterine corpus endometrioid carcinoma | Female | >=65 | I/II | Unknown | Unknown | SD |
| Page: 1 2 3 |
Top |
Related drugs of malignant transformation related genes |
| Identification of chemicals and drugs interact with genes involved in malignant transfromation |
| (DGIdb 4.0) |
| Entrez ID | Symbol | Category | Interaction Types | Drug Claim Name | Drug Name | PMIDs |
| Page: 1 |

Copyright 2023-Present -The University of Texas Health Science Center at Houston |