
|
|||||
|
 | |
| |
| |
| |
| |
| |
|
Gene: CGGBP1 |
Gene summary for CGGBP1 |
| Gene information | Species | Human | Gene symbol | CGGBP1 | Gene ID | 8545 |
| Gene name | CGG triplet repeat binding protein 1 | |
| Gene Alias | CGGBP | |
| Cytomap | 3p11.1 | |
| Gene Type | protein-coding | GO ID | GO:0000122 | UniProtAcc | Q9UFW8 |
Top |
Malignant transformation analysis |
| Identification of the aberrant gene expression in precancerous and cancerous lesions by comparing the gene expression of stem-like cells in diseased tissues with normal stem cells |
| Entrez ID | Symbol | Replicates | Species | Organ | Tissue | Adj P-value | Log2FC | Malignancy |
| 8545 | CGGBP1 | C21 | Human | Oral cavity | OSCC | 8.49e-43 | 1.21e+00 | 0.2678 |
| 8545 | CGGBP1 | C30 | Human | Oral cavity | OSCC | 5.27e-22 | 1.21e+00 | 0.3055 |
| 8545 | CGGBP1 | C38 | Human | Oral cavity | OSCC | 8.26e-13 | 1.10e+00 | 0.172 |
| 8545 | CGGBP1 | C43 | Human | Oral cavity | OSCC | 7.59e-06 | 6.32e-02 | 0.1704 |
| 8545 | CGGBP1 | C46 | Human | Oral cavity | OSCC | 1.48e-15 | 5.32e-01 | 0.1673 |
| 8545 | CGGBP1 | C57 | Human | Oral cavity | OSCC | 7.68e-14 | 5.81e-01 | 0.1679 |
| 8545 | CGGBP1 | C06 | Human | Oral cavity | OSCC | 1.05e-03 | 8.32e-01 | 0.2699 |
| 8545 | CGGBP1 | C08 | Human | Oral cavity | OSCC | 1.05e-04 | 1.41e-01 | 0.1919 |
| 8545 | CGGBP1 | C09 | Human | Oral cavity | OSCC | 2.64e-09 | 4.40e-01 | 0.1431 |
| 8545 | CGGBP1 | LN22 | Human | Oral cavity | OSCC | 9.42e-05 | 7.68e-01 | 0.1733 |
| 8545 | CGGBP1 | LN46 | Human | Oral cavity | OSCC | 3.88e-06 | 6.14e-01 | 0.1666 |
| 8545 | CGGBP1 | EOLP-1 | Human | Oral cavity | EOLP | 1.18e-04 | 1.57e-01 | -0.0202 |
| 8545 | CGGBP1 | NEOLP-3 | Human | Oral cavity | NEOLP | 2.64e-03 | 2.54e-01 | -0.0191 |
| 8545 | CGGBP1 | SYSMH1 | Human | Oral cavity | OSCC | 1.42e-03 | 1.02e-01 | 0.1127 |
| 8545 | CGGBP1 | SYSMH2 | Human | Oral cavity | OSCC | 2.15e-07 | 3.34e-01 | 0.2326 |
| 8545 | CGGBP1 | SYSMH3 | Human | Oral cavity | OSCC | 9.90e-15 | 4.92e-01 | 0.2442 |
| 8545 | CGGBP1 | SYSMH4 | Human | Oral cavity | OSCC | 8.39e-03 | -1.91e-02 | 0.1226 |
| 8545 | CGGBP1 | SYSMH5 | Human | Oral cavity | OSCC | 3.09e-08 | 3.33e-01 | 0.0647 |
| 8545 | CGGBP1 | SYSMH6 | Human | Oral cavity | OSCC | 2.90e-02 | 1.80e-01 | 0.1275 |
| 8545 | CGGBP1 | P4_S8_cSCC | Human | Skin | cSCC | 3.15e-03 | 6.84e-02 | -0.3095 |
| Page: 1 2 3 4 5 6 7 |
| Tissue | Expression Dynamics | Abbreviation |
| Esophagus |  | ESCC: Esophageal squamous cell carcinoma |
| HGIN: High-grade intraepithelial neoplasias | ||
| LGIN: Low-grade intraepithelial neoplasias | ||
| Liver |  | HCC: Hepatocellular carcinoma |
| NAFLD: Non-alcoholic fatty liver disease | ||
| Oral Cavity | 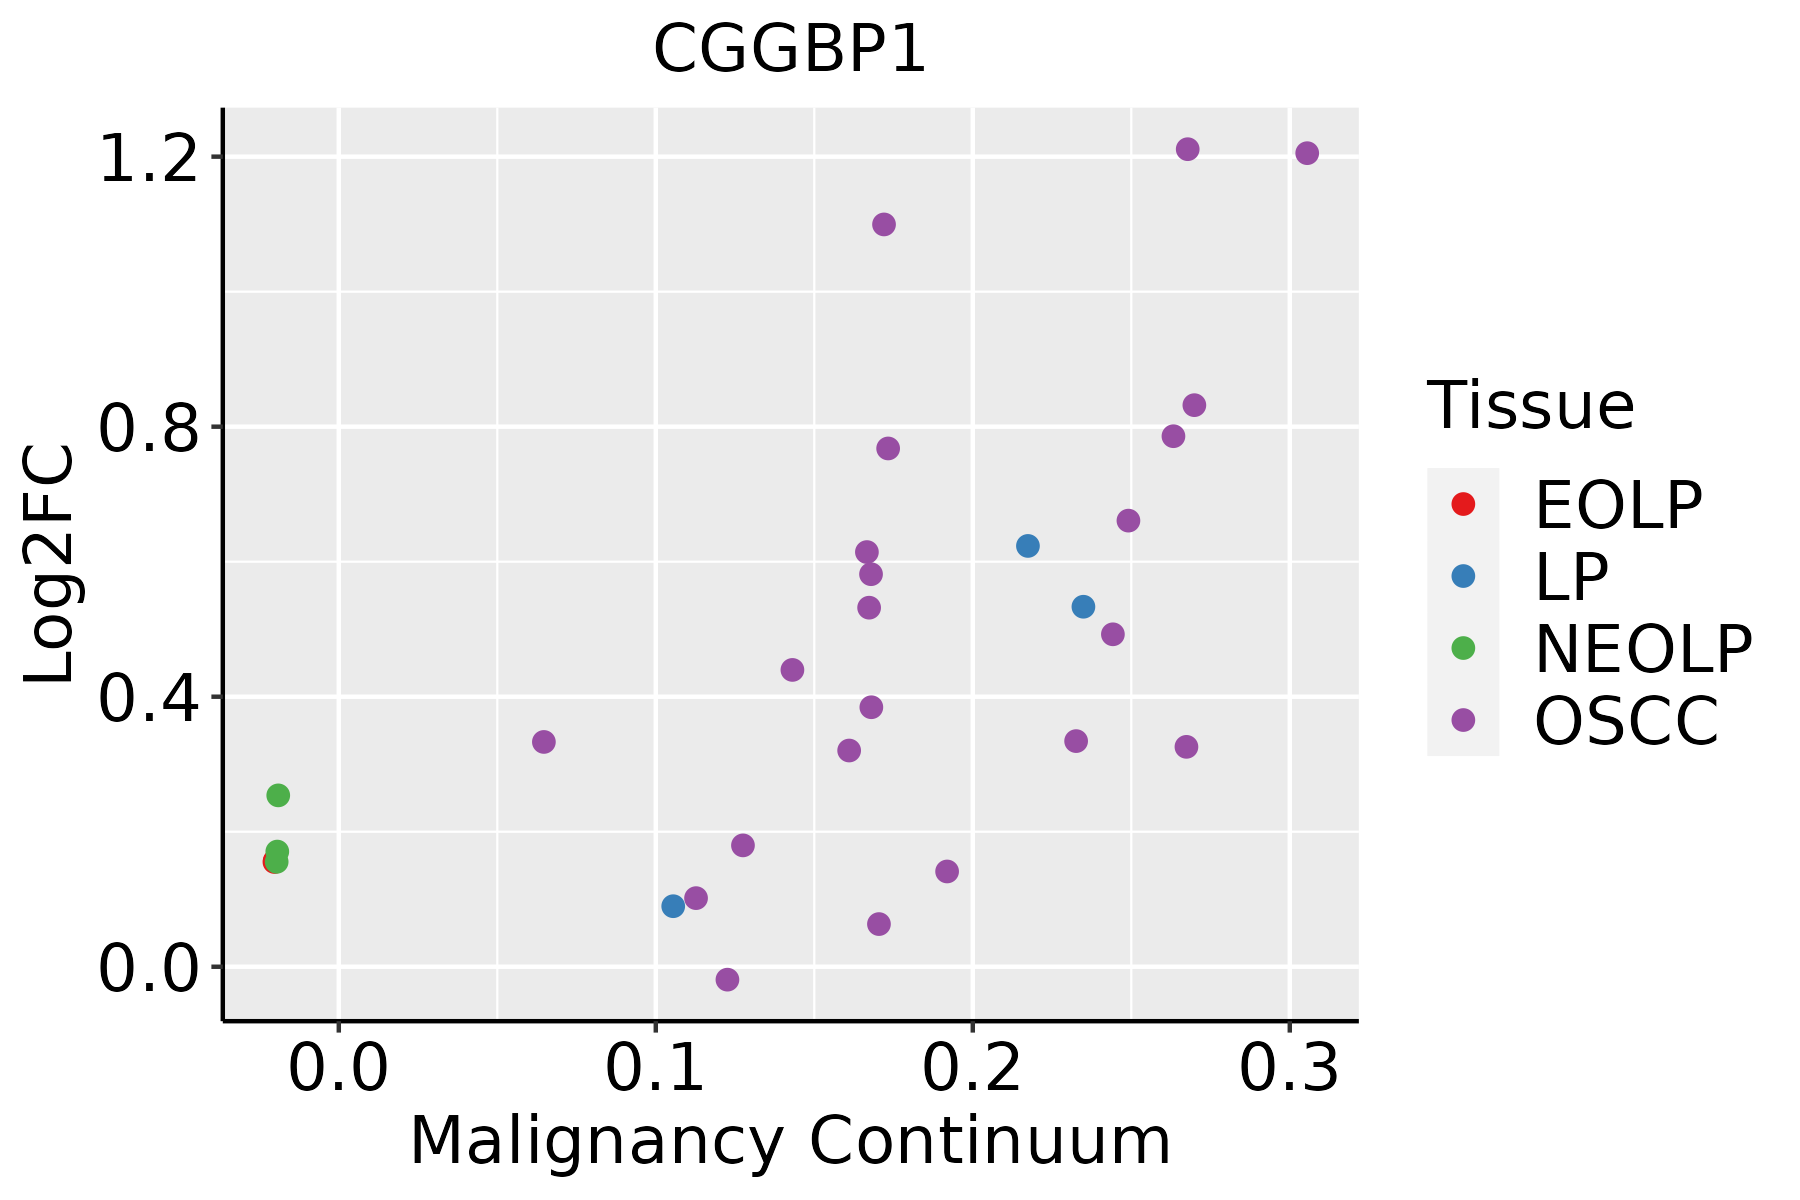 | EOLP: Erosive Oral lichen planus |
| LP: leukoplakia | ||
| NEOLP: Non-erosive oral lichen planus | ||
| OSCC: Oral squamous cell carcinoma | ||
| Skin | 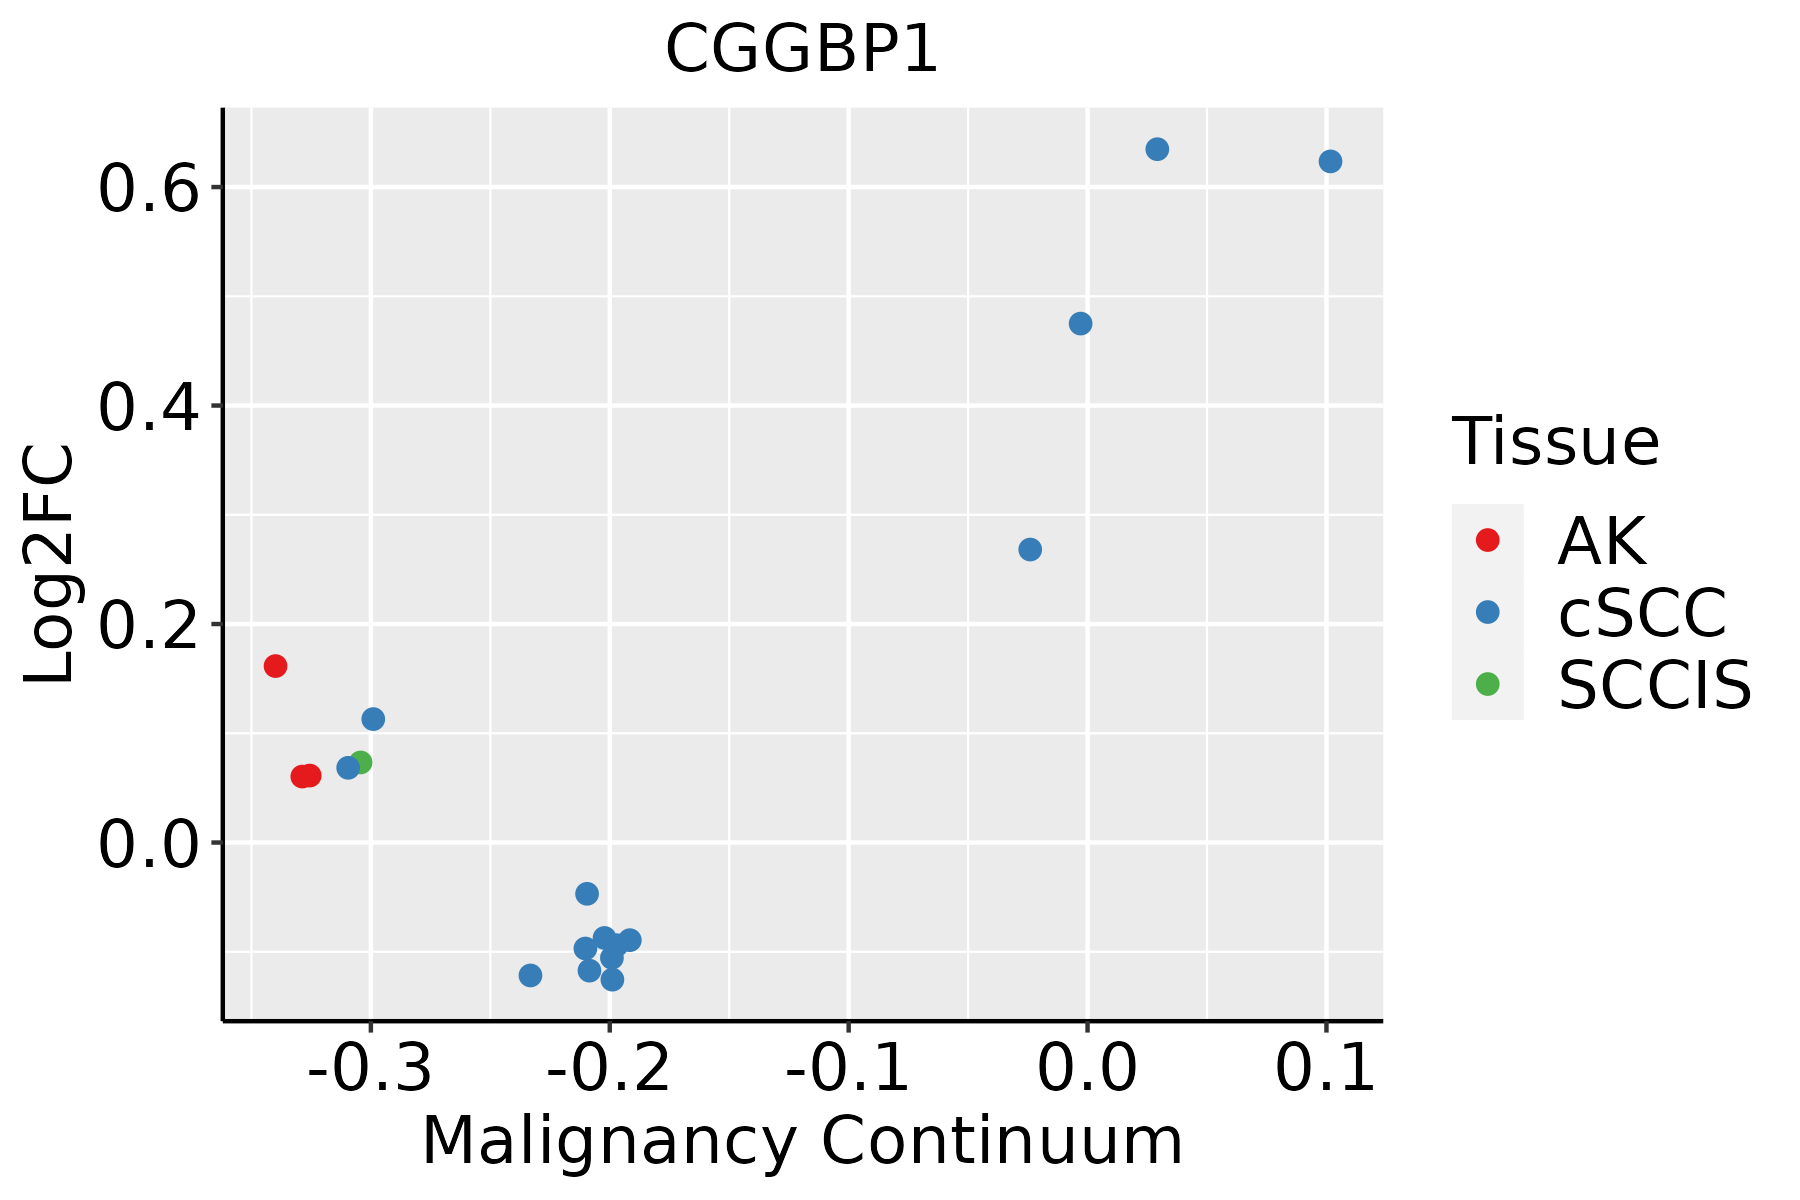 | AK: Actinic keratosis |
| cSCC: Cutaneous squamous cell carcinoma | ||
| SCCIS:squamous cell carcinoma in situ | ||
| Thyroid |  | ATC: Anaplastic thyroid cancer |
| HT: Hashimoto's thyroiditis | ||
| PTC: Papillary thyroid cancer |
| ∗log2FC in expression of this searched gene in stem-like cells from each diseased tissue sample relative to stem-like cells in normal samples in each tissue plotted against the malignancy continuum. Samples are colored based on if they are from different disease stage. |
Top |
Malignant transformation related pathway analysis |
| Find out the enriched GO biological processes and KEGG pathways involved in transition from healthy to precancer to cancer |
| Tissue | Disease Stage | Enriched GO biological Processes |
| Colorectum | AD |  |
| Colorectum | SER |  |
| Colorectum | MSS |  |
| Colorectum | MSI-H |  |
| Colorectum | FAP |  |
| ∗Top 15 enriched GO BP terms are showed in the bar plot of each disease state in each tissue. Each row represents a significant GO biological process which is colored according to the -log10(p.adjust). |
| Page: 1 2 3 4 5 6 7 8 9 |
| GO ID | Tissue | Disease Stage | Description | Gene Ratio | Bg Ratio | pvalue | p.adjust | Count |
| GO:00400295 | Esophagus | ESCC | regulation of gene expression, epigenetic | 74/8552 | 105/18723 | 2.24e-07 | 3.42e-06 | 74 |
| GO:0040029 | Liver | HCC | regulation of gene expression, epigenetic | 61/7958 | 105/18723 | 9.02e-04 | 5.31e-03 | 61 |
| GO:00400294 | Oral cavity | OSCC | regulation of gene expression, epigenetic | 59/7305 | 105/18723 | 2.62e-04 | 1.68e-03 | 59 |
| GO:00400292 | Oral cavity | EOLP | regulation of gene expression, epigenetic | 24/2218 | 105/18723 | 1.07e-03 | 7.87e-03 | 24 |
| GO:00400293 | Oral cavity | NEOLP | regulation of gene expression, epigenetic | 24/2005 | 105/18723 | 2.48e-04 | 2.55e-03 | 24 |
| GO:004002912 | Skin | cSCC | regulation of gene expression, epigenetic | 39/4864 | 105/18723 | 7.56e-03 | 3.53e-02 | 39 |
| GO:00400297 | Thyroid | PTC | regulation of gene expression, epigenetic | 57/5968 | 105/18723 | 1.60e-06 | 2.25e-05 | 57 |
| GO:004002913 | Thyroid | ATC | regulation of gene expression, epigenetic | 57/6293 | 105/18723 | 1.01e-05 | 1.00e-04 | 57 |
| Page: 1 |
| Pathway ID | Tissue | Disease Stage | Description | Gene Ratio | Bg Ratio | pvalue | p.adjust | qvalue | Count |
| Page: 1 |
Top |
Cell-cell communication analysis |
| Identification of potential cell-cell interactions between two cell types and their ligand-receptor pairs for different disease states |
| Ligand | Receptor | LRpair | Pathway | Tissue | Disease Stage |
| Page: 1 |
Top |
Single-cell gene regulatory network inference analysis |
| Find out the significant the regulons (TFs) and the target genes of each regulon across cell types for different disease states |
| TF | Cell Type | Tissue | Disease Stage | Target Gene | RSS | Regulon Activity |
| ∗The dot plots of a searched regulon are shown for all cell subpopulations in each disease state of each tissue based on the regulon specific score inferred using pySCENIC and by calculating the average expression. |
| Page: 1 |
Top |
Somatic mutation of malignant transformation related genes |
| Annotation of somatic variants for genes involved in malignant transformation |
| Hugo Symbol | Variant Class | Variant Classification | dbSNP RS | HGVSc | HGVSp | HGVSp Short | SWISSPROT | BIOTYPE | SIFT | PolyPhen | Tumor Sample Barcode | Tissue | Histology | Sex | Age | Stage | Therapy Types | Drugs | Outcome |
| CGGBP1 | SNV | Missense_Mutation | novel | c.22N>A | p.Ala8Thr | p.A8T | Q9UFW8 | protein_coding | tolerated(0.79) | benign(0.019) | TCGA-EA-A410-01 | Cervix | cervical & endocervical cancer | Female | <65 | I/II | Unknown | Unknown | SD |
| CGGBP1 | SNV | Missense_Mutation | c.160N>T | p.Arg54Cys | p.R54C | Q9UFW8 | protein_coding | tolerated(0.16) | benign(0.193) | TCGA-AA-3984-01 | Colorectum | colon adenocarcinoma | Female | <65 | I/II | Unknown | Unknown | SD | |
| CGGBP1 | SNV | Missense_Mutation | novel | c.179N>G | p.Asp60Gly | p.D60G | Q9UFW8 | protein_coding | tolerated(0.34) | possibly_damaging(0.908) | TCGA-AA-A00N-01 | Colorectum | colon adenocarcinoma | Male | >=65 | I/II | Unknown | Unknown | PD |
| CGGBP1 | SNV | Missense_Mutation | c.134N>A | p.Ser45Tyr | p.S45Y | Q9UFW8 | protein_coding | tolerated(1) | benign(0.278) | TCGA-AG-A002-01 | Colorectum | rectum adenocarcinoma | Male | <65 | I/II | Unknown | Unknown | SD | |
| CGGBP1 | SNV | Missense_Mutation | c.451C>T | p.Leu151Phe | p.L151F | Q9UFW8 | protein_coding | tolerated(0.18) | probably_damaging(0.934) | TCGA-DY-A1DD-01 | Colorectum | rectum adenocarcinoma | Female | >=65 | III/IV | Unknown | Unknown | SD | |
| CGGBP1 | SNV | Missense_Mutation | c.35G>A | p.Arg12Gln | p.R12Q | Q9UFW8 | protein_coding | tolerated(0.32) | benign(0.072) | TCGA-AP-A056-01 | Endometrium | uterine corpus endometrioid carcinoma | Female | <65 | I/II | Unknown | Unknown | SD | |
| CGGBP1 | SNV | Missense_Mutation | c.53N>A | p.Ala18Asp | p.A18D | Q9UFW8 | protein_coding | deleterious(0) | probably_damaging(0.958) | TCGA-AP-A0LM-01 | Endometrium | uterine corpus endometrioid carcinoma | Female | <65 | III/IV | Chemotherapy | cisplatin | SD | |
| CGGBP1 | SNV | Missense_Mutation | c.160C>T | p.Arg54Cys | p.R54C | Q9UFW8 | protein_coding | tolerated(0.16) | benign(0.193) | TCGA-B5-A0JY-01 | Endometrium | uterine corpus endometrioid carcinoma | Female | <65 | III/IV | Chemotherapy | doxorubicin | SD | |
| CGGBP1 | SNV | Missense_Mutation | c.341N>G | p.Ala114Gly | p.A114G | Q9UFW8 | protein_coding | deleterious(0.01) | possibly_damaging(0.866) | TCGA-BS-A0UF-01 | Endometrium | uterine corpus endometrioid carcinoma | Female | >=65 | I/II | Unknown | Unknown | SD | |
| CGGBP1 | SNV | Missense_Mutation | novel | c.415N>A | p.Ser139Thr | p.S139T | Q9UFW8 | protein_coding | deleterious(0.04) | possibly_damaging(0.682) | TCGA-EO-A22R-01 | Endometrium | uterine corpus endometrioid carcinoma | Female | <65 | I/II | Unknown | Unknown | SD |
| Page: 1 2 |
Top |
Related drugs of malignant transformation related genes |
| Identification of chemicals and drugs interact with genes involved in malignant transfromation |
| (DGIdb 4.0) |
| Entrez ID | Symbol | Category | Interaction Types | Drug Claim Name | Drug Name | PMIDs |
| Page: 1 |

Copyright 2023-Present -The University of Texas Health Science Center at Houston |