
|
|||||
|
 | |
| |
| |
| |
| |
| |
|
Gene: CEP83 |
Gene summary for CEP83 |
| Gene information | Species | Human | Gene symbol | CEP83 | Gene ID | 51134 |
| Gene name | centrosomal protein 83 | |
| Gene Alias | CCDC41 | |
| Cytomap | 12q22 | |
| Gene Type | protein-coding | GO ID | GO:0006810 | UniProtAcc | J3KNW7 |
Top |
Malignant transformation analysis |
| Identification of the aberrant gene expression in precancerous and cancerous lesions by comparing the gene expression of stem-like cells in diseased tissues with normal stem cells |
| Entrez ID | Symbol | Replicates | Species | Organ | Tissue | Adj P-value | Log2FC | Malignancy |
| 51134 | CEP83 | P80T-E | Human | Esophagus | ESCC | 2.15e-18 | 5.25e-01 | 0.155 |
| 51134 | CEP83 | P82T-E | Human | Esophagus | ESCC | 1.12e-03 | 2.64e-01 | 0.1072 |
| 51134 | CEP83 | P83T-E | Human | Esophagus | ESCC | 3.44e-20 | 5.31e-01 | 0.1738 |
| 51134 | CEP83 | P84T-E | Human | Esophagus | ESCC | 5.50e-03 | 2.54e-01 | 0.0933 |
| 51134 | CEP83 | P89T-E | Human | Esophagus | ESCC | 5.44e-03 | 4.46e-01 | 0.1752 |
| 51134 | CEP83 | P91T-E | Human | Esophagus | ESCC | 4.55e-12 | 8.30e-01 | 0.1828 |
| 51134 | CEP83 | P107T-E | Human | Esophagus | ESCC | 4.96e-23 | 4.91e-01 | 0.171 |
| 51134 | CEP83 | P126T-E | Human | Esophagus | ESCC | 5.19e-03 | 3.31e-01 | 0.1125 |
| 51134 | CEP83 | P127T-E | Human | Esophagus | ESCC | 1.25e-10 | 1.29e-01 | 0.0826 |
| 51134 | CEP83 | P128T-E | Human | Esophagus | ESCC | 1.07e-18 | 6.33e-01 | 0.1241 |
| 51134 | CEP83 | P130T-E | Human | Esophagus | ESCC | 1.13e-26 | 5.39e-01 | 0.1676 |
| Page: 1 2 3 4 5 |
| Tissue | Expression Dynamics | Abbreviation |
| Cervix | 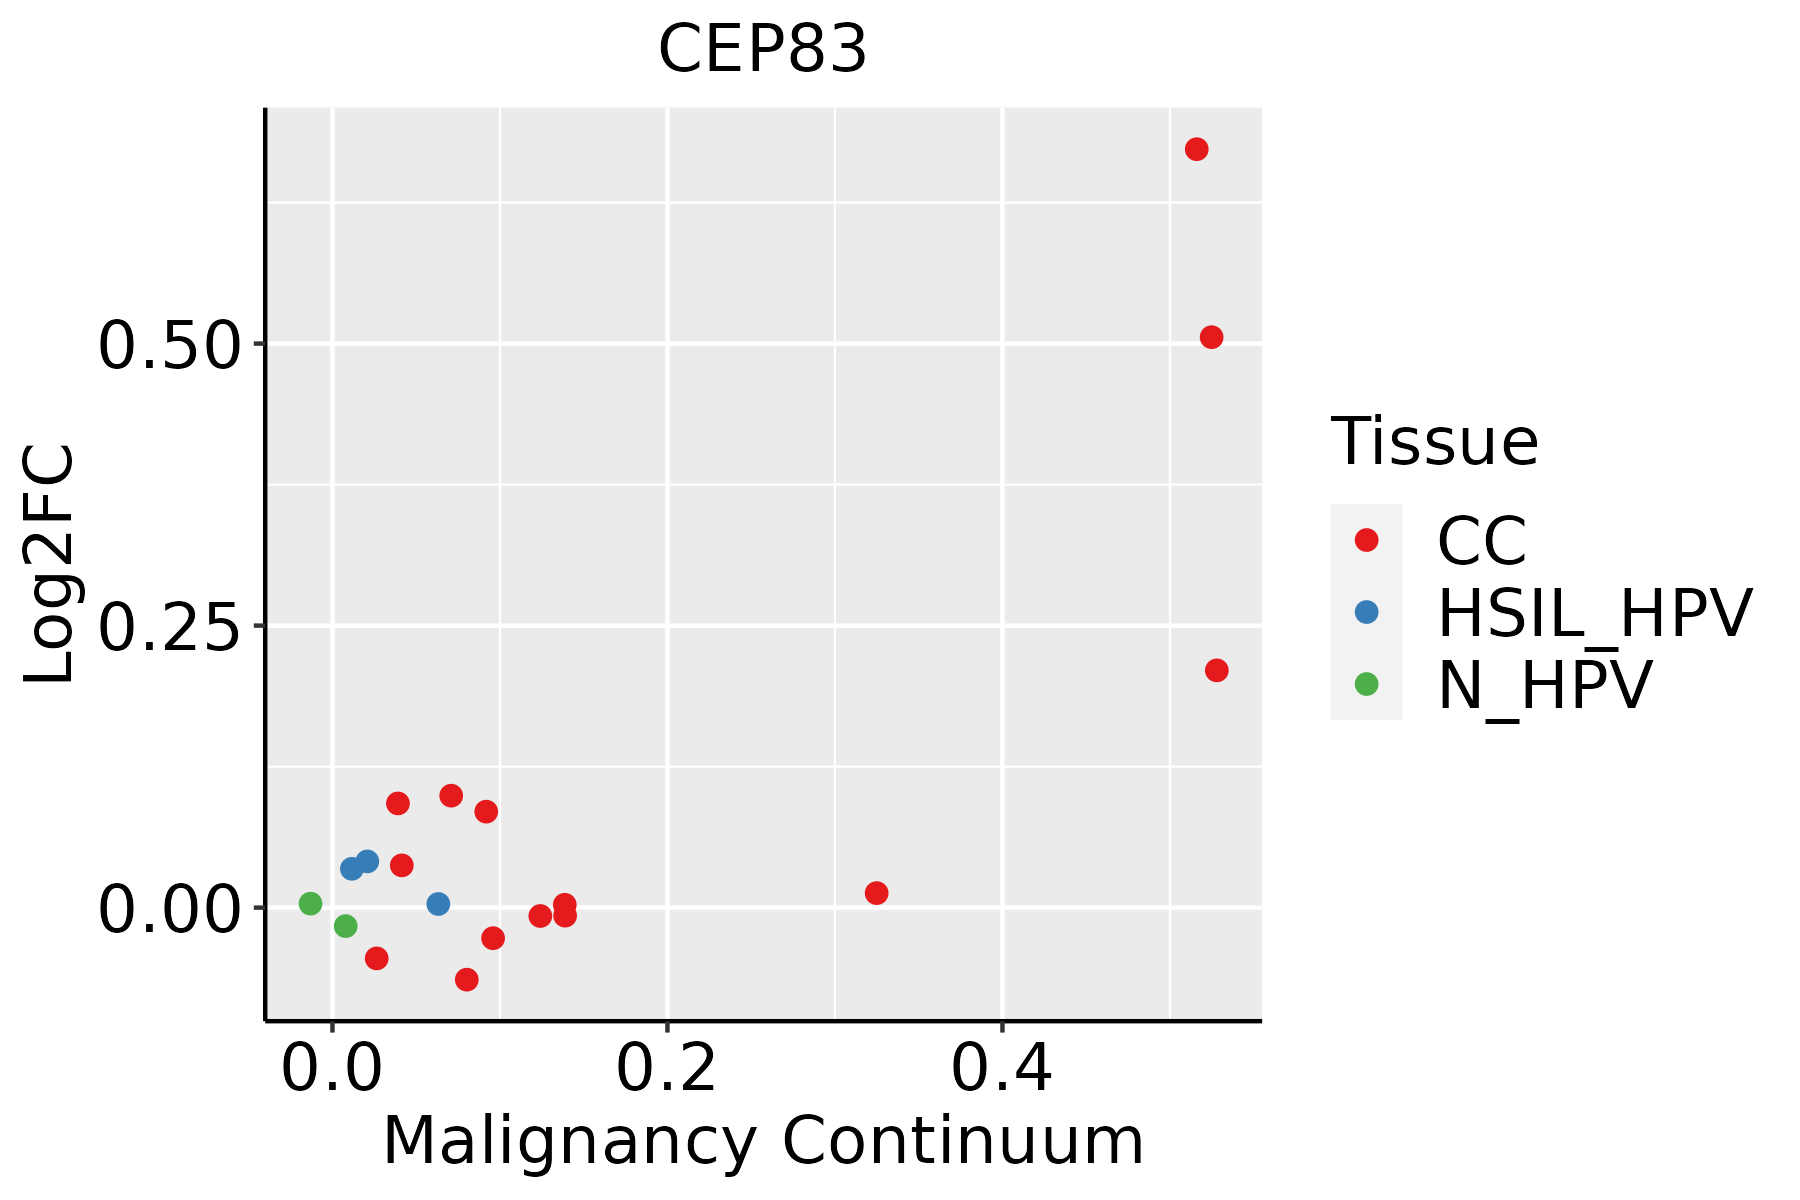 | CC: Cervix cancer |
| HSIL_HPV: HPV-infected high-grade squamous intraepithelial lesions | ||
| N_HPV: HPV-infected normal cervix | ||
| Colorectum (GSE201348) |  | FAP: Familial adenomatous polyposis |
| CRC: Colorectal cancer | ||
| Colorectum (HTA11) |  | AD: Adenomas |
| SER: Sessile serrated lesions | ||
| MSI-H: Microsatellite-high colorectal cancer | ||
| MSS: Microsatellite stable colorectal cancer | ||
| Esophagus | 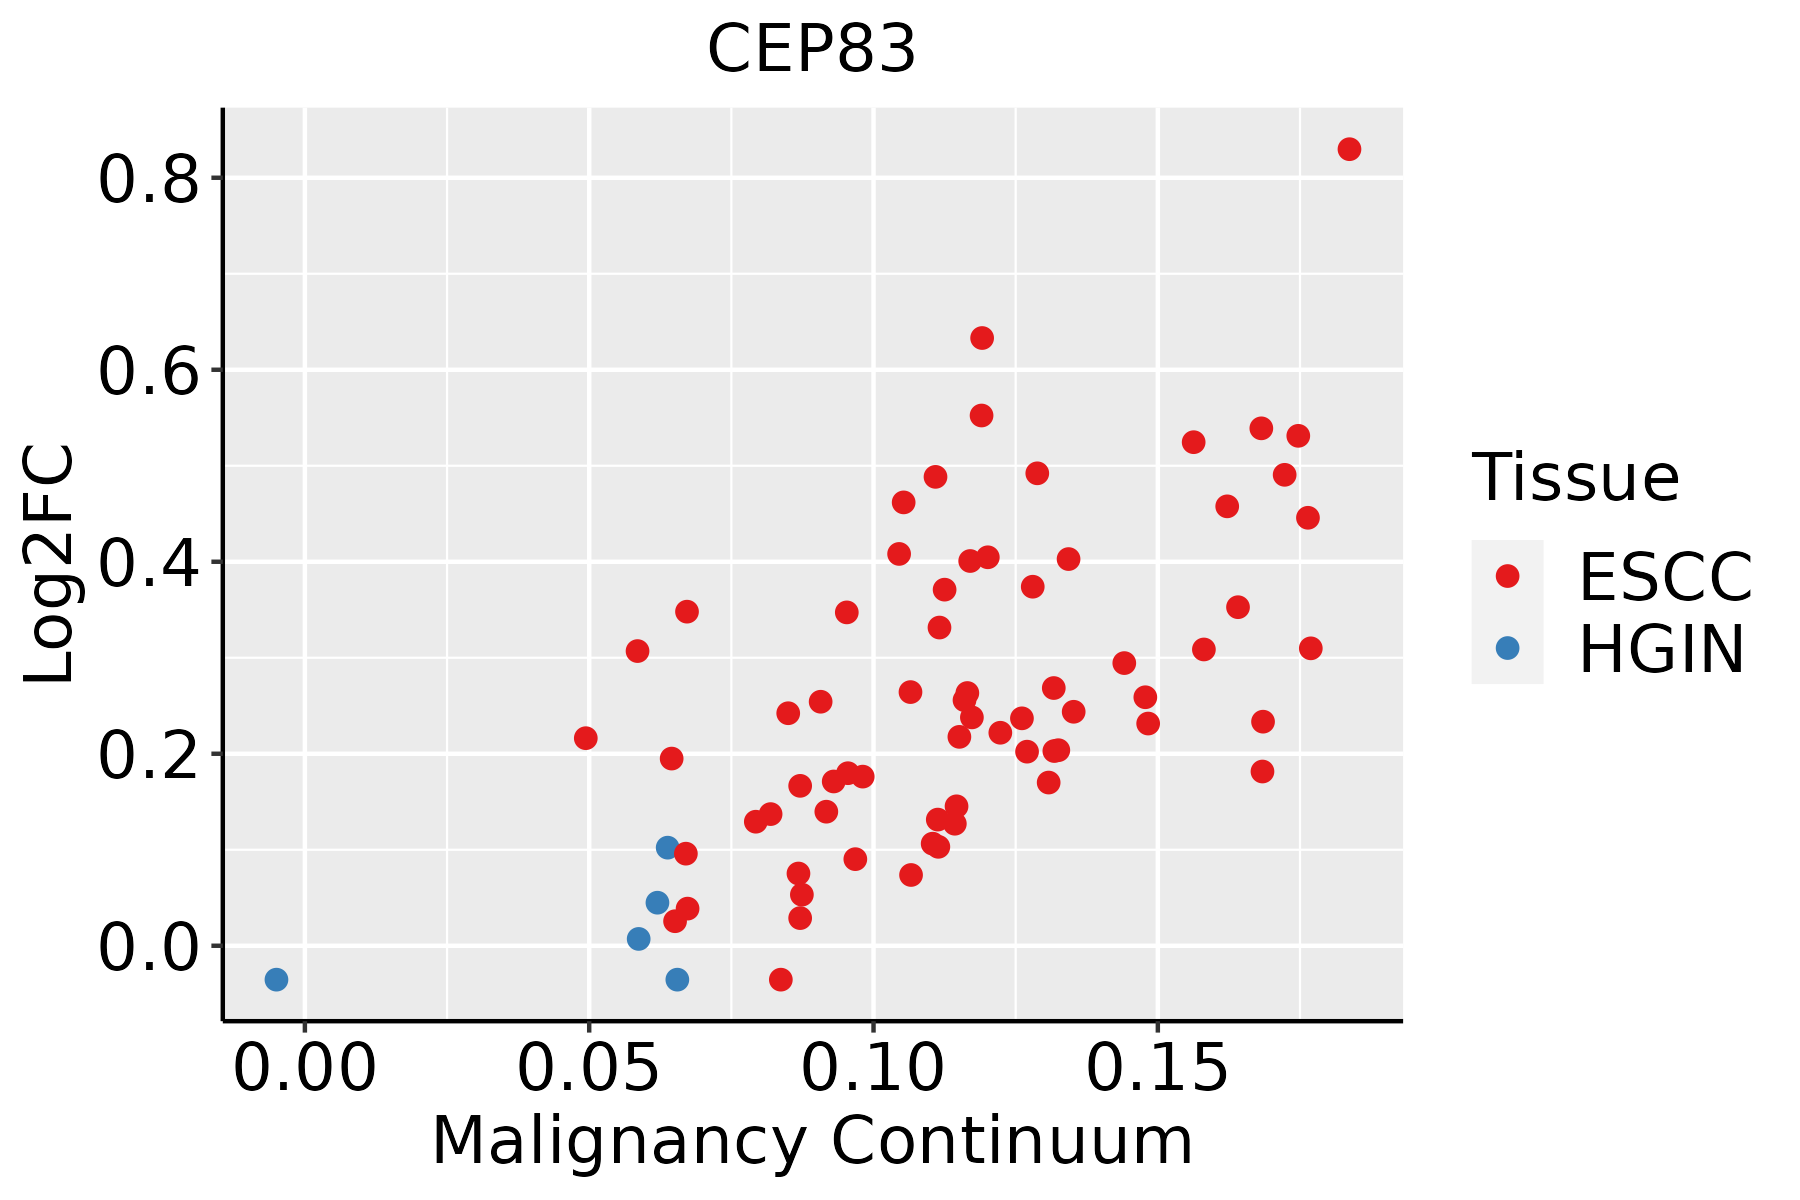 | ESCC: Esophageal squamous cell carcinoma |
| HGIN: High-grade intraepithelial neoplasias | ||
| LGIN: Low-grade intraepithelial neoplasias |
| ∗log2FC in expression of this searched gene in stem-like cells from each diseased tissue sample relative to stem-like cells in normal samples in each tissue plotted against the malignancy continuum. Samples are colored based on if they are from different disease stage. |
Top |
Malignant transformation related pathway analysis |
| Find out the enriched GO biological processes and KEGG pathways involved in transition from healthy to precancer to cancer |
| Tissue | Disease Stage | Enriched GO biological Processes |
| Colorectum | AD |  |
| Colorectum | SER |  |
| Colorectum | MSS |  |
| Colorectum | MSI-H |  |
| Colorectum | FAP |  |
| ∗Top 15 enriched GO BP terms are showed in the bar plot of each disease state in each tissue. Each row represents a significant GO biological process which is colored according to the -log10(p.adjust). |
| Page: 1 2 3 4 5 6 7 8 9 |
| GO ID | Tissue | Disease Stage | Description | Gene Ratio | Bg Ratio | pvalue | p.adjust | Count |
| GO:00516567 | Cervix | CC | establishment of organelle localization | 76/2311 | 390/18723 | 3.17e-05 | 5.21e-04 | 76 |
| GO:00618425 | Cervix | CC | microtubule organizing center localization | 11/2311 | 33/18723 | 1.42e-03 | 1.11e-02 | 11 |
| GO:00516425 | Cervix | CC | centrosome localization | 10/2311 | 32/18723 | 3.96e-03 | 2.48e-02 | 10 |
| GO:00516606 | Cervix | CC | establishment of centrosome localization | 5/2311 | 10/18723 | 4.20e-03 | 2.58e-02 | 5 |
| GO:0051656 | Colorectum | AD | establishment of organelle localization | 131/3918 | 390/18723 | 3.00e-09 | 2.06e-07 | 131 |
| GO:0071539 | Colorectum | AD | protein localization to centrosome | 16/3918 | 33/18723 | 3.86e-04 | 4.41e-03 | 16 |
| GO:0022406 | Colorectum | AD | membrane docking | 31/3918 | 86/18723 | 8.67e-04 | 8.45e-03 | 31 |
| GO:1905508 | Colorectum | AD | protein localization to microtubule organizing center | 16/3918 | 35/18723 | 8.76e-04 | 8.51e-03 | 16 |
| GO:0051660 | Colorectum | AD | establishment of centrosome localization | 7/3918 | 10/18723 | 1.15e-03 | 1.04e-02 | 7 |
| GO:0140056 | Colorectum | AD | organelle localization by membrane tethering | 28/3918 | 77/18723 | 1.29e-03 | 1.14e-02 | 28 |
| GO:00516562 | Colorectum | MSS | establishment of organelle localization | 115/3467 | 390/18723 | 7.30e-08 | 3.67e-06 | 115 |
| GO:00715391 | Colorectum | MSS | protein localization to centrosome | 16/3467 | 33/18723 | 8.66e-05 | 1.40e-03 | 16 |
| GO:19055081 | Colorectum | MSS | protein localization to microtubule organizing center | 16/3467 | 35/18723 | 2.07e-04 | 2.89e-03 | 16 |
| GO:00516601 | Colorectum | MSS | establishment of centrosome localization | 7/3467 | 10/18723 | 5.26e-04 | 5.99e-03 | 7 |
| GO:00224062 | Colorectum | MSS | membrane docking | 28/3467 | 86/18723 | 1.27e-03 | 1.21e-02 | 28 |
| GO:01400562 | Colorectum | MSS | organelle localization by membrane tethering | 25/3467 | 77/18723 | 2.34e-03 | 1.91e-02 | 25 |
| GO:0044380 | Colorectum | MSS | protein localization to cytoskeleton | 19/3467 | 58/18723 | 6.69e-03 | 4.38e-02 | 19 |
| GO:0072698 | Colorectum | MSS | protein localization to microtubule cytoskeleton | 18/3467 | 54/18723 | 6.70e-03 | 4.38e-02 | 18 |
| GO:00516563 | Colorectum | FAP | establishment of organelle localization | 97/2622 | 390/18723 | 5.91e-09 | 9.48e-07 | 97 |
| GO:00715392 | Colorectum | FAP | protein localization to centrosome | 14/2622 | 33/18723 | 6.39e-05 | 1.23e-03 | 14 |
| Page: 1 2 3 |
| Pathway ID | Tissue | Disease Stage | Description | Gene Ratio | Bg Ratio | pvalue | p.adjust | qvalue | Count |
| Page: 1 |
Top |
Cell-cell communication analysis |
| Identification of potential cell-cell interactions between two cell types and their ligand-receptor pairs for different disease states |
| Ligand | Receptor | LRpair | Pathway | Tissue | Disease Stage |
| Page: 1 |
Top |
Single-cell gene regulatory network inference analysis |
| Find out the significant the regulons (TFs) and the target genes of each regulon across cell types for different disease states |
| TF | Cell Type | Tissue | Disease Stage | Target Gene | RSS | Regulon Activity |
| ∗The dot plots of a searched regulon are shown for all cell subpopulations in each disease state of each tissue based on the regulon specific score inferred using pySCENIC and by calculating the average expression. |
| Page: 1 |
Top |
Somatic mutation of malignant transformation related genes |
| Annotation of somatic variants for genes involved in malignant transformation |
| Hugo Symbol | Variant Class | Variant Classification | dbSNP RS | HGVSc | HGVSp | HGVSp Short | SWISSPROT | BIOTYPE | SIFT | PolyPhen | Tumor Sample Barcode | Tissue | Histology | Sex | Age | Stage | Therapy Types | Drugs | Outcome |
| CEP83 | SNV | Missense_Mutation | c.688N>C | p.Glu230Gln | p.E230Q | protein_coding | deleterious(0) | probably_damaging(0.999) | TCGA-AC-A23H-01 | Breast | breast invasive carcinoma | Female | >=65 | I/II | Unknown | Unknown | PD | ||
| CEP83 | SNV | Missense_Mutation | novel | c.1894N>A | p.Leu632Ile | p.L632I | protein_coding | tolerated(0.17) | possibly_damaging(0.872) | TCGA-AN-A046-01 | Breast | breast invasive carcinoma | Female | >=65 | I/II | Unknown | Unknown | SD | |
| CEP83 | SNV | Missense_Mutation | novel | c.472N>G | p.Leu158Val | p.L158V | protein_coding | deleterious(0.04) | benign(0.216) | TCGA-C8-A8HP-01 | Breast | breast invasive carcinoma | Female | <65 | III/IV | Chemotherapy | 5-fluorouracil | CR | |
| CEP83 | SNV | Missense_Mutation | novel | c.878N>G | p.Phe293Cys | p.F293C | protein_coding | tolerated(0.18) | benign(0.003) | TCGA-2W-A8YY-01 | Cervix | cervical & endocervical cancer | Female | <65 | I/II | Chemotherapy | cisplatin | CR | |
| CEP83 | SNV | Missense_Mutation | novel | c.1248N>A | p.Asp416Glu | p.D416E | protein_coding | tolerated(0.42) | benign(0.017) | TCGA-C5-A902-01 | Cervix | cervical & endocervical cancer | Female | <65 | I/II | Chemotherapy | cisplatin | SD | |
| CEP83 | SNV | Missense_Mutation | c.1393A>G | p.Lys465Glu | p.K465E | protein_coding | deleterious(0) | possibly_damaging(0.492) | TCGA-FU-A3NI-01 | Cervix | cervical & endocervical cancer | Female | <65 | I/II | Unknown | Unknown | SD | ||
| CEP83 | SNV | Missense_Mutation | novel | c.1790N>T | p.Thr597Ile | p.T597I | protein_coding | tolerated(0.63) | benign(0.073) | TCGA-AA-3811-01 | Colorectum | colon adenocarcinoma | Female | >=65 | III/IV | Unknown | Unknown | PD | |
| CEP83 | SNV | Missense_Mutation | c.1244N>T | p.His415Leu | p.H415L | protein_coding | deleterious(0.02) | benign(0.096) | TCGA-AA-A01K-01 | Colorectum | colon adenocarcinoma | Female | >=65 | III/IV | Chemotherapy | folinic | CR | ||
| CEP83 | SNV | Missense_Mutation | c.1944C>A | p.Ser648Arg | p.S648R | protein_coding | deleterious(0.05) | possibly_damaging(0.642) | TCGA-AM-5821-01 | Colorectum | colon adenocarcinoma | Female | >=65 | I/II | Unknown | Unknown | SD | ||
| CEP83 | SNV | Missense_Mutation | c.1115A>G | p.Lys372Arg | p.K372R | protein_coding | deleterious(0.03) | probably_damaging(0.999) | TCGA-AZ-6598-01 | Colorectum | colon adenocarcinoma | Female | >=65 | I/II | Unknown | Unknown | SD |
| Page: 1 2 3 4 5 6 7 |
Top |
Related drugs of malignant transformation related genes |
| Identification of chemicals and drugs interact with genes involved in malignant transfromation |
| (DGIdb 4.0) |
| Entrez ID | Symbol | Category | Interaction Types | Drug Claim Name | Drug Name | PMIDs |
| Page: 1 |

Copyright 2023-Present -The University of Texas Health Science Center at Houston |