Schematic overview of the cellular and molecular mechanisms involved in the cancer progression, including the proposed cellular and molecular mechanisms in cancer cells trajectory. AT1: alveolar type 1 cells; AT2: alveolar type 2 cells; AAH: atypical adenomatous hyperplasia; AIS: adenocarcinoma in situ; MIA: minimally invasive adenocarcinoma; IA: invasive adenocarcinoma; EMT: epithelial-mesenchymal transition

Home

Download

Statistics

Help

Contact

Center for Computational Systems Medicine
leaf

Gene summary

leaf

Malignant transformation analysis

leaf

Malignant transformation related pathway analysis

leaf

Cell-cell communication analysis

leaf

Single-cell gene regulatory network inference analysis

leaf

Somatic mutation of malignant transformation related genes

leaf

Related drugs of malignant transformation related genes

Gene: CCDC14

Gene summary for CCDC14

check button Gene summary.

Gene informationSpeciesHuman
Gene symbol

CCDC14

Gene ID

64770

Gene namecoiled-coil domain containing 14
Gene AliasCCDC14
Cytomap3q21.1
Gene Typeprotein-coding
GO ID

GO:0007275

UniProtAcc

Q49A88


Top

Malignant transformation analysis

check button Identification of the aberrant gene expression in precancerous and cancerous lesions by comparing the gene expression of stem-like cells in diseased tissues with normal stem cells
check button Malignant transformation involving gene list.
Entrez IDSymbolReplicatesSpeciesOrganTissueAdj P-valueLog2FCMalignancy
64770CCDC14P10T-EHumanEsophagusESCC1.44e-551.00e+000.116
64770CCDC14P11T-EHumanEsophagusESCC7.62e-085.56e-010.1426
64770CCDC14P12T-EHumanEsophagusESCC2.02e-172.49e-010.1122
64770CCDC14P15T-EHumanEsophagusESCC5.90e-204.27e-010.1149
64770CCDC14P16T-EHumanEsophagusESCC7.36e-478.81e-010.1153
64770CCDC14P17T-EHumanEsophagusESCC9.88e-083.80e-010.1278
64770CCDC14P20T-EHumanEsophagusESCC8.58e-213.27e-010.1124
64770CCDC14P21T-EHumanEsophagusESCC2.37e-194.65e-010.1617
64770CCDC14P22T-EHumanEsophagusESCC1.24e-275.21e-010.1236
64770CCDC14P23T-EHumanEsophagusESCC1.01e-123.56e-010.108
64770CCDC14P24T-EHumanEsophagusESCC5.62e-082.34e-010.1287
64770CCDC14P26T-EHumanEsophagusESCC5.00e-234.17e-010.1276
64770CCDC14P27T-EHumanEsophagusESCC5.56e-274.66e-010.1055
64770CCDC14P28T-EHumanEsophagusESCC2.12e-264.66e-010.1149
64770CCDC14P30T-EHumanEsophagusESCC4.47e-103.64e-010.137
64770CCDC14P31T-EHumanEsophagusESCC6.66e-183.74e-010.1251
64770CCDC14P32T-EHumanEsophagusESCC1.41e-173.35e-010.1666
64770CCDC14P36T-EHumanEsophagusESCC8.33e-195.41e-010.1187
64770CCDC14P37T-EHumanEsophagusESCC5.31e-255.28e-010.1371
64770CCDC14P39T-EHumanEsophagusESCC2.63e-112.48e-010.0894
Page: 1 2 3 4 5 6 7 8 9 10 

check button Transcriptomic changes along malignancy continuum.
TissueExpression DynamicsAbbreviation
CervixThe image shows the transcriptomic changes along malignancy continuum.log2FC in expression of this searched gene in stem-like cells from each diseased tissue sample relative to stem-like cells in normal samples in each tissue plotted against the malignancy continuum. Samples are colored based on if they are from different disease stage.CC: Cervix cancer
HSIL_HPV: HPV-infected high-grade squamous intraepithelial lesions
N_HPV: HPV-infected normal cervix
Colorectum (GSE201348)The image shows the transcriptomic changes along malignancy continuum.log2FC in expression of this searched gene in stem-like cells from each diseased tissue sample relative to stem-like cells in normal samples in each tissue plotted against the malignancy continuum. Samples are colored based on if they are from different disease stage.FAP: Familial adenomatous polyposis
CRC: Colorectal cancer
Colorectum (HTA11)The image shows the transcriptomic changes along malignancy continuum.log2FC in expression of this searched gene in stem-like cells from each diseased tissue sample relative to stem-like cells in normal samples in each tissue plotted against the malignancy continuum. Samples are colored based on if they are from different disease stage.AD: Adenomas
SER: Sessile serrated lesions
MSI-H: Microsatellite-high colorectal cancer
MSS: Microsatellite stable colorectal cancer
EsophagusThe image shows the transcriptomic changes along malignancy continuum.log2FC in expression of this searched gene in stem-like cells from each diseased tissue sample relative to stem-like cells in normal samples in each tissue plotted against the malignancy continuum. Samples are colored based on if they are from different disease stage.ESCC: Esophageal squamous cell carcinoma
HGIN: High-grade intraepithelial neoplasias
LGIN: Low-grade intraepithelial neoplasias
LiverThe image shows the transcriptomic changes along malignancy continuum.log2FC in expression of this searched gene in stem-like cells from each diseased tissue sample relative to stem-like cells in normal samples in each tissue plotted against the malignancy continuum. Samples are colored based on if they are from different disease stage.
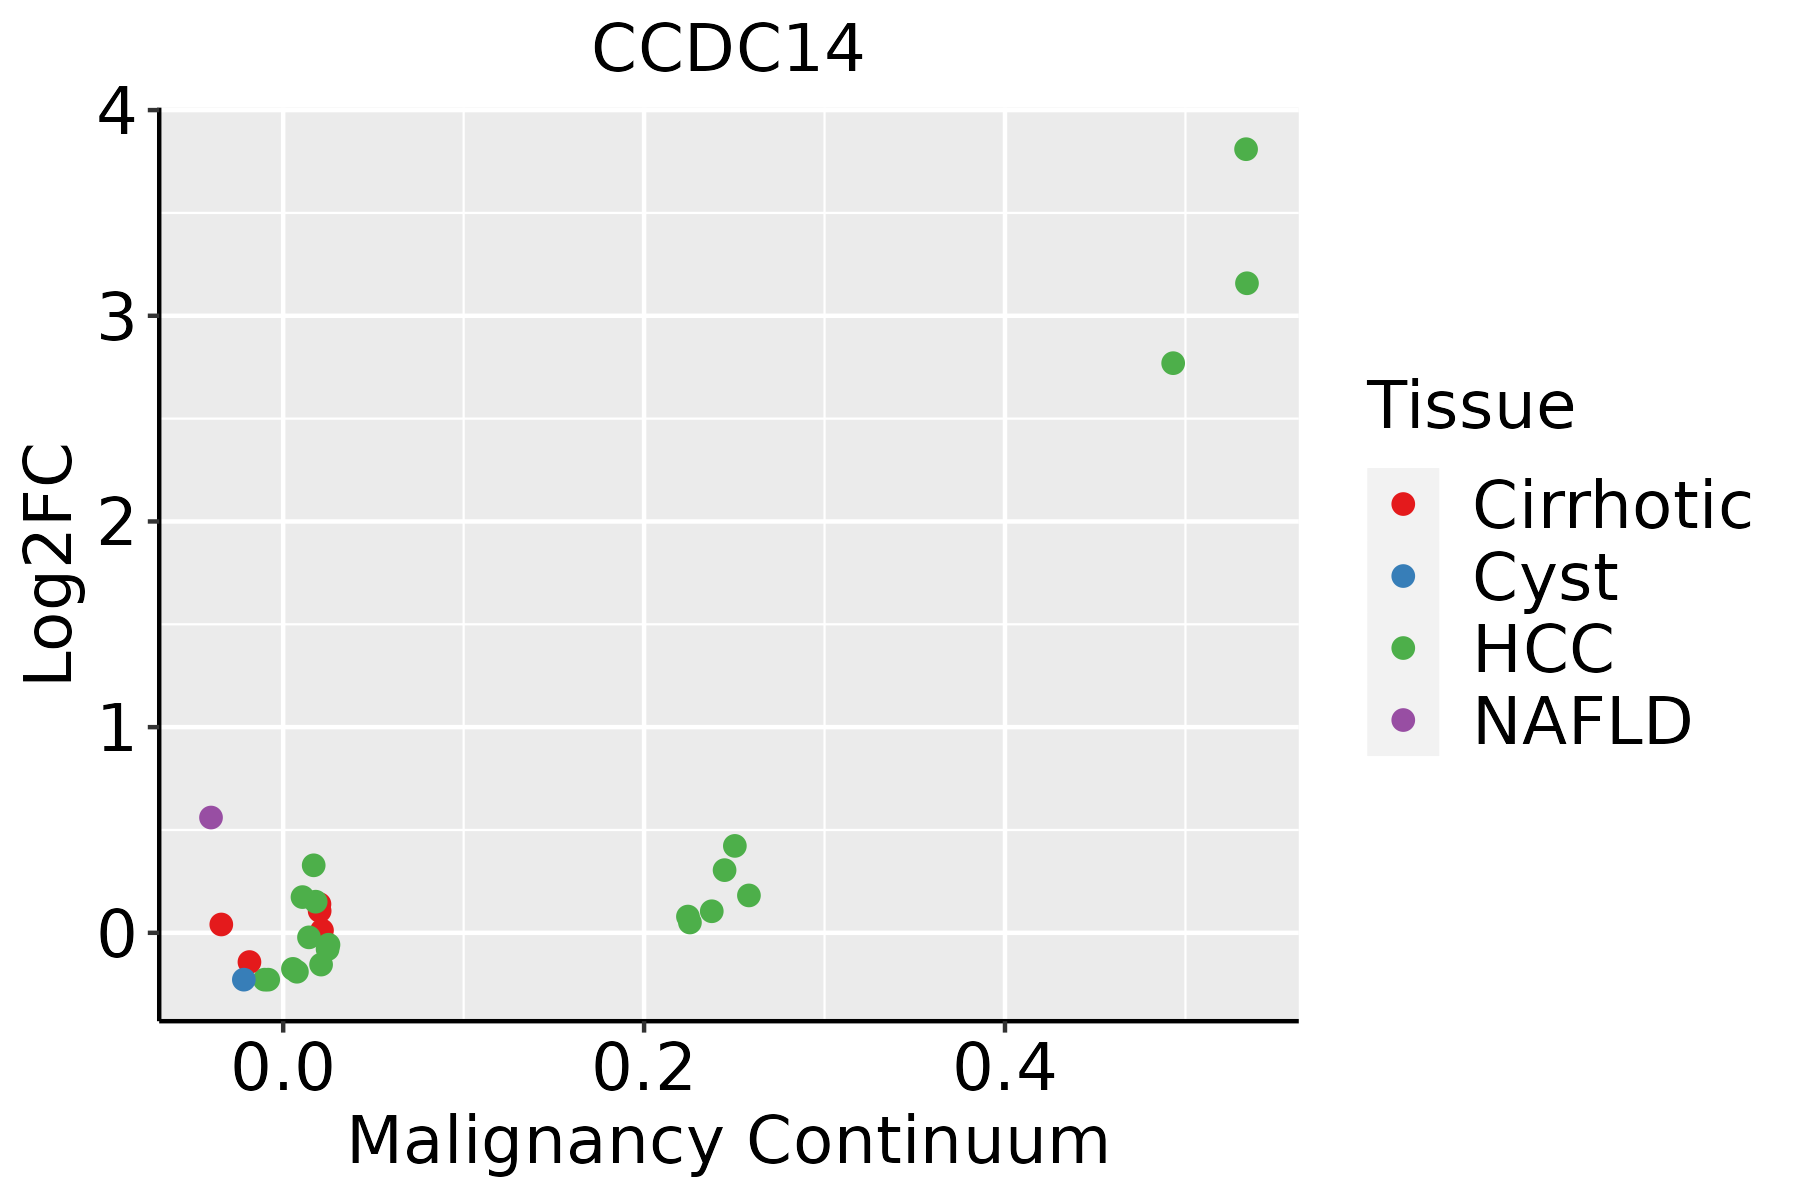
HCC: Hepatocellular carcinoma
NAFLD: Non-alcoholic fatty liver disease
LungThe image shows the transcriptomic changes along malignancy continuum.log2FC in expression of this searched gene in stem-like cells from each diseased tissue sample relative to stem-like cells in normal samples in each tissue plotted against the malignancy continuum. Samples are colored based on if they are from different disease stage.
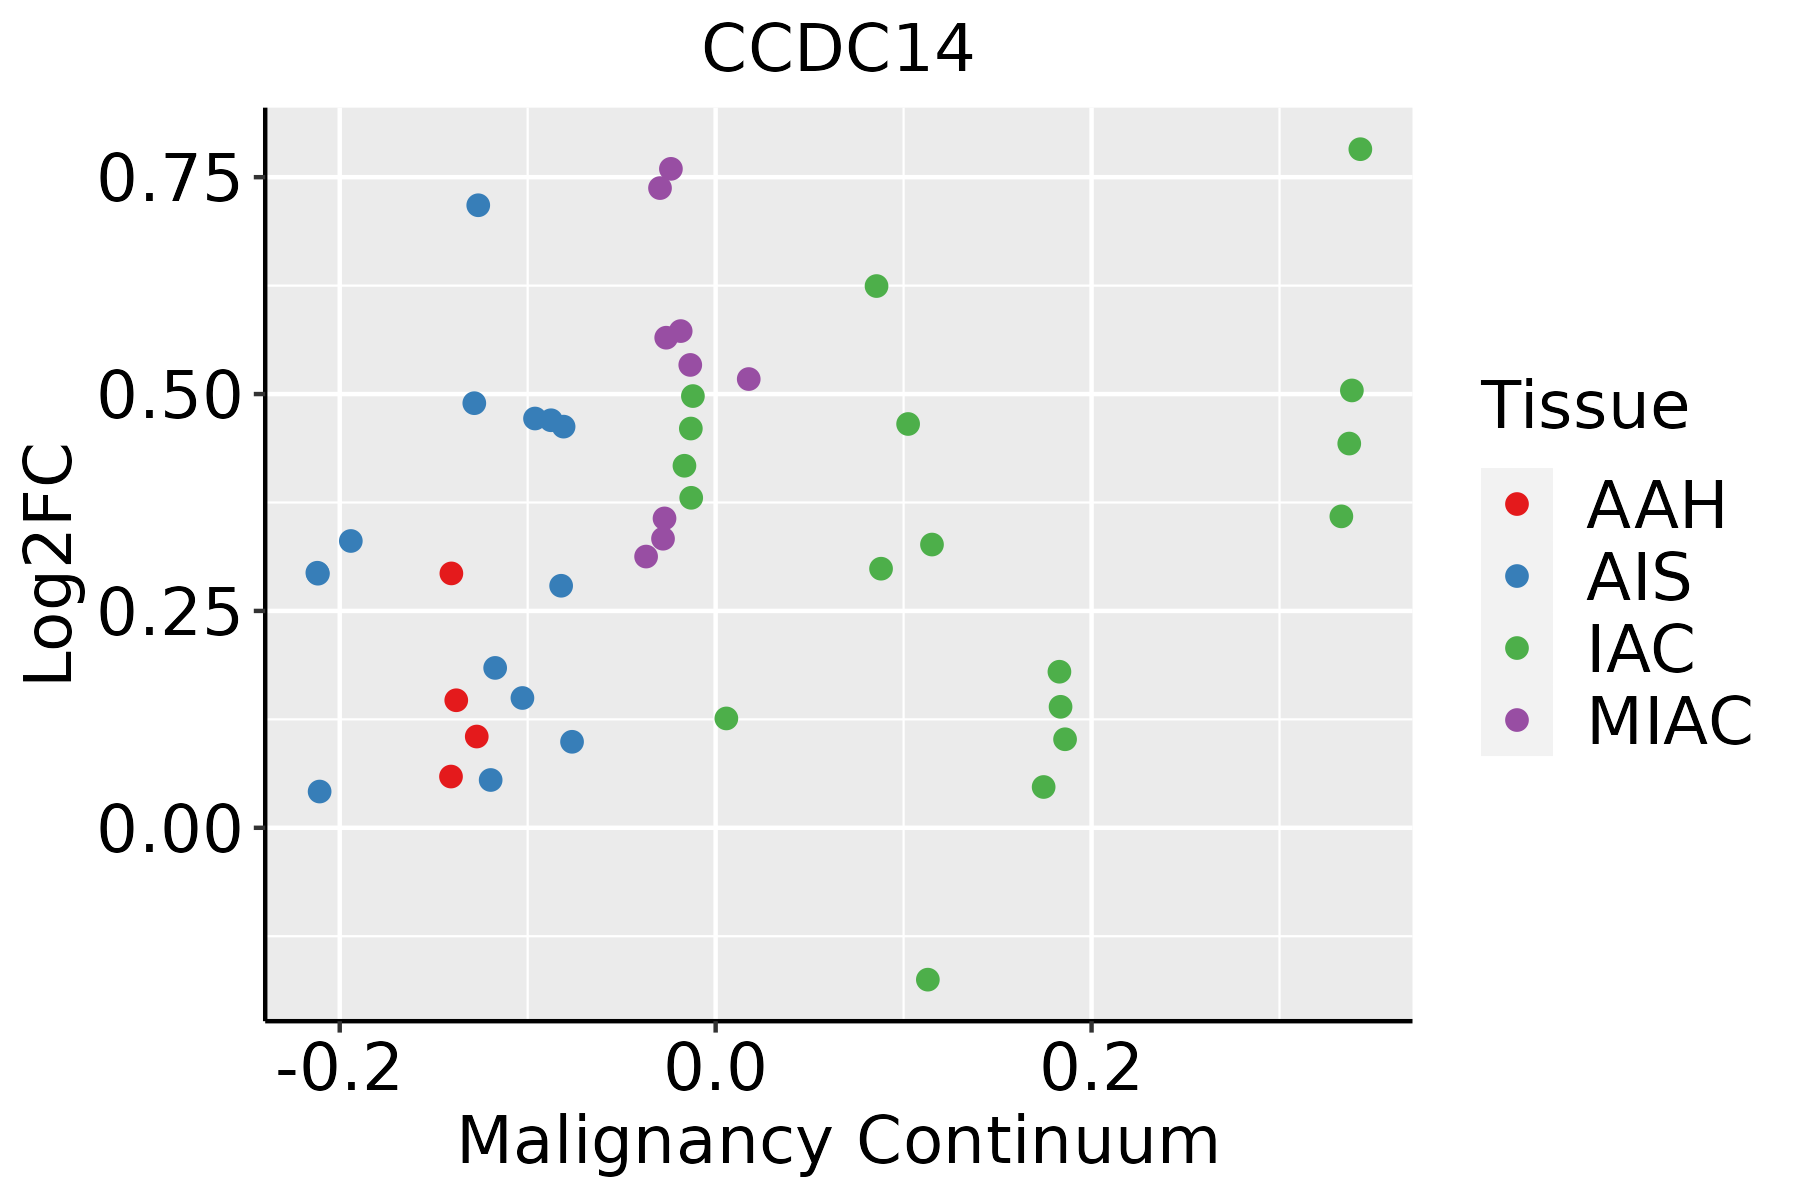
AAH: Atypical adenomatous hyperplasia
AIS: Adenocarcinoma in situ
IAC: Invasive lung adenocarcinoma
MIA: Minimally invasive adenocarcinoma
Oral CavityThe image shows the transcriptomic changes along malignancy continuum.log2FC in expression of this searched gene in stem-like cells from each diseased tissue sample relative to stem-like cells in normal samples in each tissue plotted against the malignancy continuum. Samples are colored based on if they are from different disease stage.
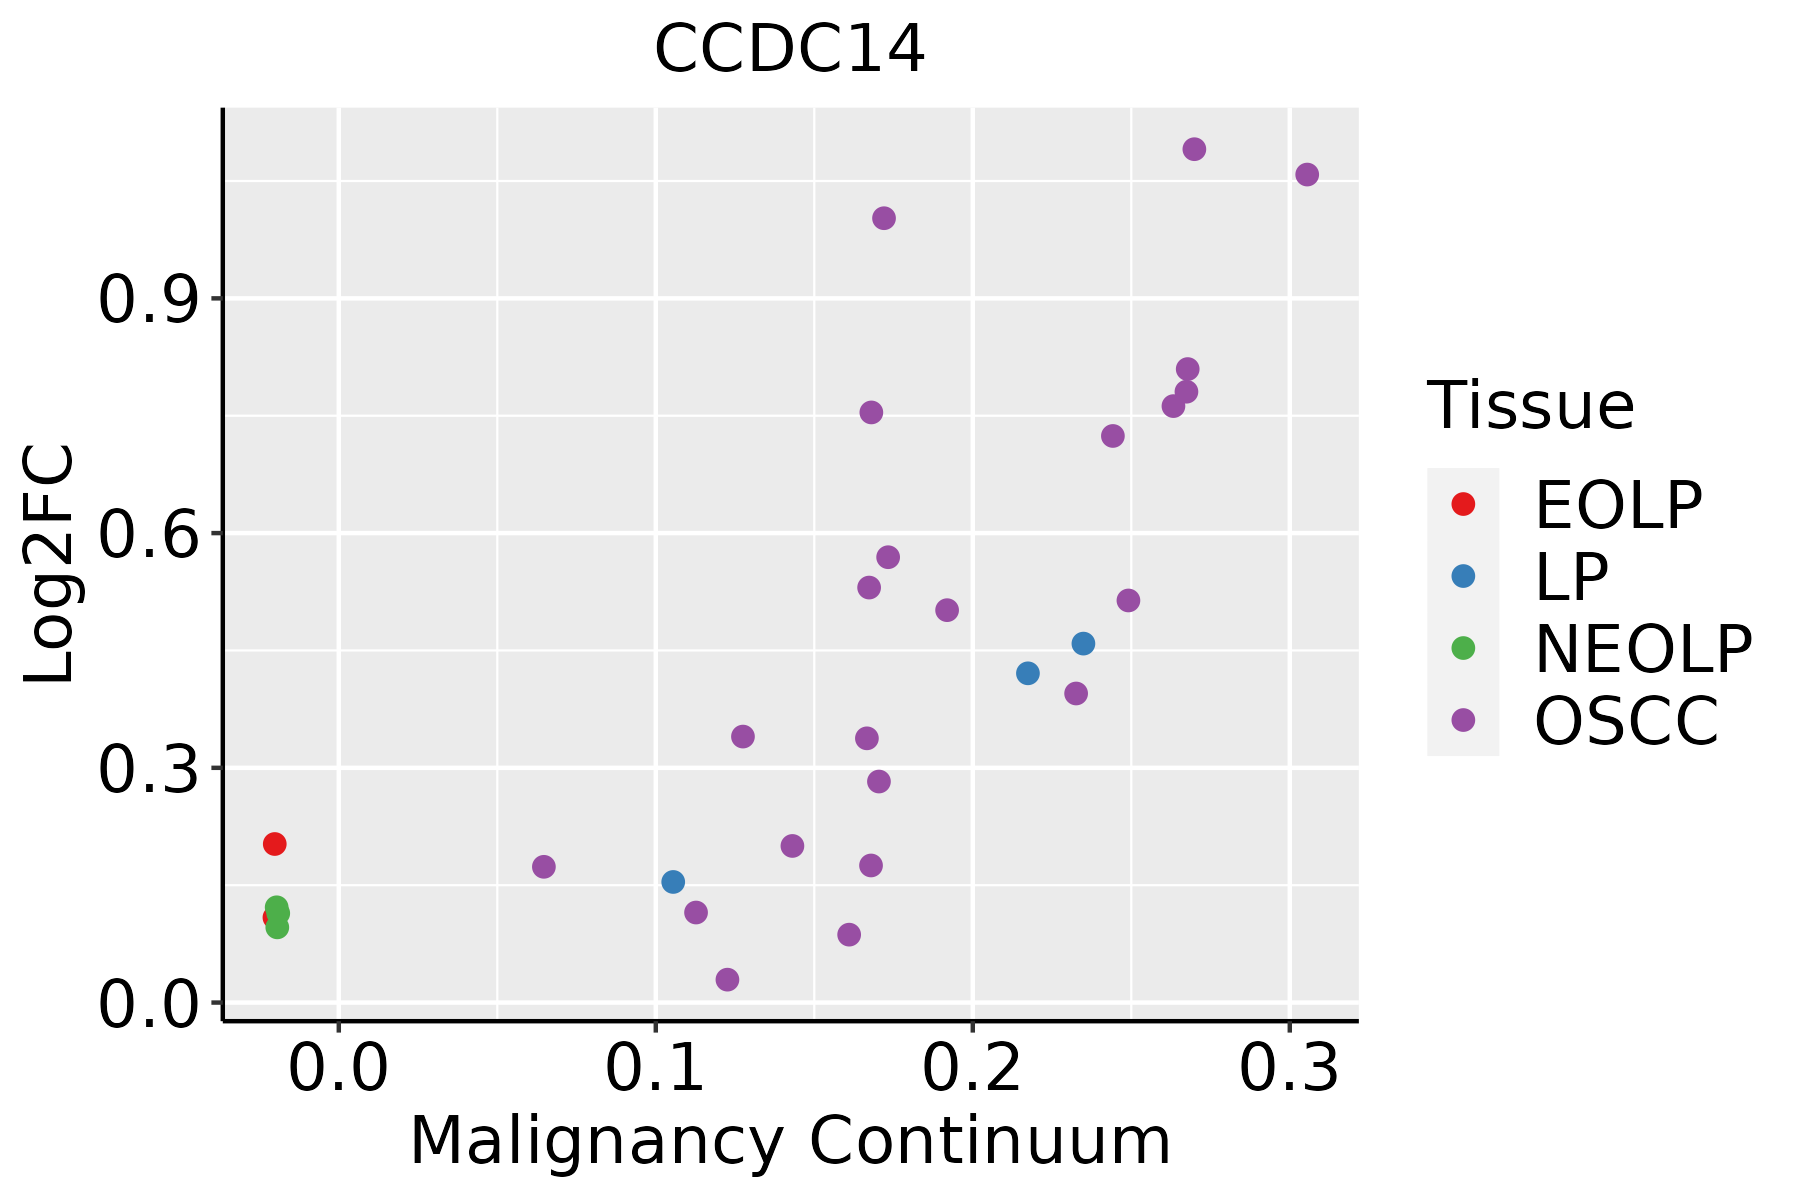
EOLP: Erosive Oral lichen planus
LP: leukoplakia
NEOLP: Non-erosive oral lichen planus
OSCC: Oral squamous cell carcinoma
ProstateThe image shows the transcriptomic changes along malignancy continuum.log2FC in expression of this searched gene in stem-like cells from each diseased tissue sample relative to stem-like cells in normal samples in each tissue plotted against the malignancy continuum. Samples are colored based on if they are from different disease stage.
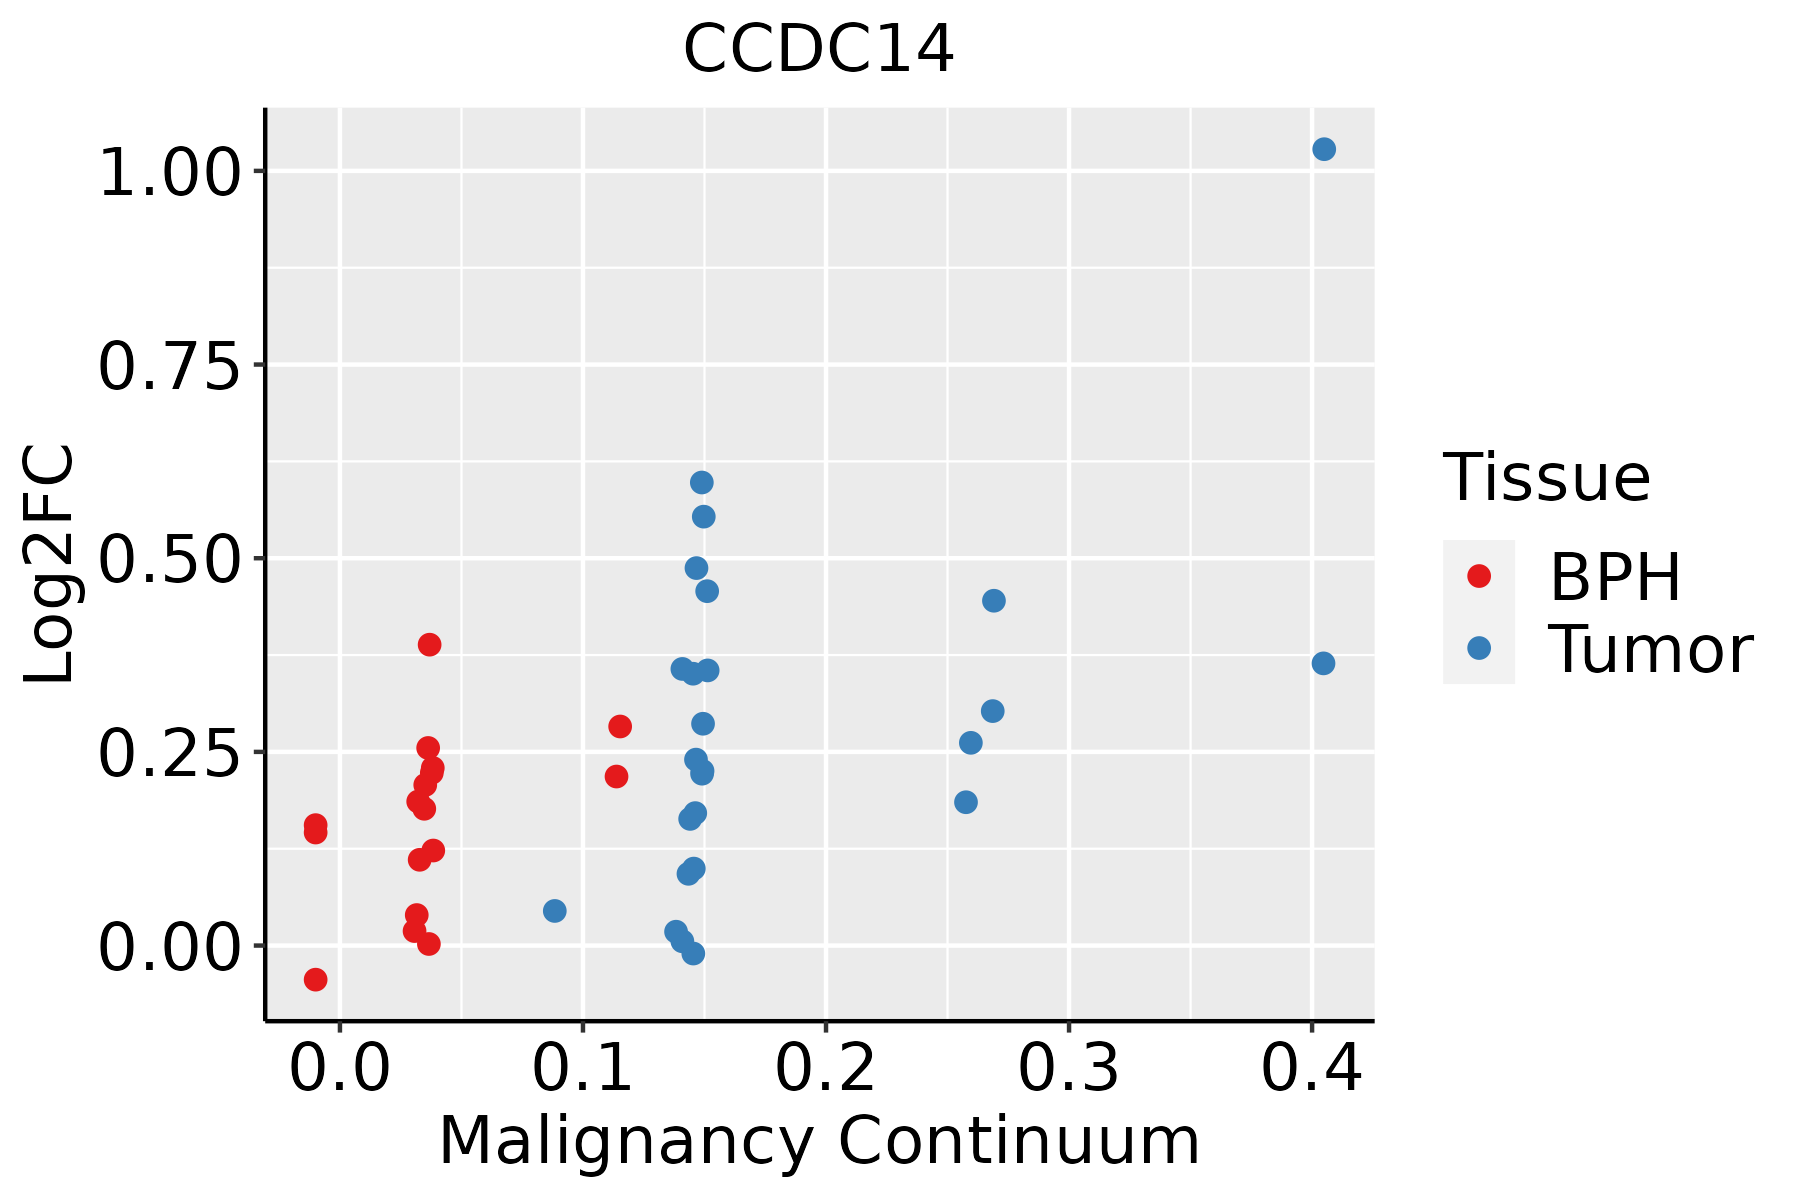
BPH: Benign Prostatic Hyperplasia
SkinThe image shows the transcriptomic changes along malignancy continuum.log2FC in expression of this searched gene in stem-like cells from each diseased tissue sample relative to stem-like cells in normal samples in each tissue plotted against the malignancy continuum. Samples are colored based on if they are from different disease stage.AK: Actinic keratosis
cSCC: Cutaneous squamous cell carcinoma
SCCIS:squamous cell carcinoma in situ
ThyroidThe image shows the transcriptomic changes along malignancy continuum.log2FC in expression of this searched gene in stem-like cells from each diseased tissue sample relative to stem-like cells in normal samples in each tissue plotted against the malignancy continuum. Samples are colored based on if they are from different disease stage.ATC: Anaplastic thyroid cancer
HT: Hashimoto's thyroiditis
PTC: Papillary thyroid cancer
∗log2FC in expression of this searched gene in stem-like cells from each diseased tissue sample relative to stem-like cells in normal samples in each tissue plotted against the malignancy continuum. Samples are colored based on if they are from different disease stage.

Top

Malignant transformation related pathway analysis

check buttonFind out the enriched GO biological processes and KEGG pathways involved in transition from healthy to precancer to cancer
check button Figure of enriched GO biological processes.
TissueDisease StageEnriched GO biological Processes
ColorectumADGO analysis - Figure of enriched GO biological processes: Top 15 enriched GO BP terms are showed in the bar plot of each disease state in each tissue. Each row represents a significant GO biological process which is colored according to the -log10(p.adjust).
ColorectumSERGO analysis - Figure of enriched GO biological processes: Top 15 enriched GO BP terms are showed in the bar plot of each disease state in each tissue. Each row represents a significant GO biological process which is colored according to the -log10(p.adjust).
ColorectumMSSGO analysis - Figure of enriched GO biological processes: Top 15 enriched GO BP terms are showed in the bar plot of each disease state in each tissue. Each row represents a significant GO biological process which is colored according to the -log10(p.adjust).
ColorectumMSI-HGO analysis - Figure of enriched GO biological processes: Top 15 enriched GO BP terms are showed in the bar plot of each disease state in each tissue. Each row represents a significant GO biological process which is colored according to the -log10(p.adjust).
ColorectumFAPGO analysis - Figure of enriched GO biological processes: Top 15 enriched GO BP terms are showed in the bar plot of each disease state in each tissue. Each row represents a significant GO biological process which is colored according to the -log10(p.adjust).
∗Top 15 enriched GO BP terms are showed in the bar plot of each disease state in each tissue. Each row represents a significant GO biological process which is colored according to the -log10(p.adjust).
Page: 1 2 3 4 5 6 7 8 9 

check button Enriched GO biological processes.
GO IDTissueDisease StageDescriptionGene RatioBg Ratiopvaluep.adjustCount
GO:00309019CervixCCmidbrain development26/231190/187232.12e-053.82e-0426
GO:002176210CervixCCsubstantia nigra development16/231144/187233.81e-055.99e-0416
GO:00488579CervixCCneural nucleus development18/231164/187235.42e-045.23e-0318
GO:0021762ColorectumADsubstantia nigra development21/391844/187236.60e-051.07e-0321
GO:0048857ColorectumADneural nucleus development27/391864/187239.57e-051.45e-0327
GO:0071539ColorectumADprotein localization to centrosome16/391833/187233.86e-044.41e-0316
GO:1905508ColorectumADprotein localization to microtubule organizing center16/391835/187238.76e-048.51e-0316
GO:0030901ColorectumADmidbrain development32/391890/187239.45e-048.95e-0332
GO:00217621ColorectumSERsubstantia nigra development21/289744/187234.77e-072.40e-0521
GO:00488571ColorectumSERneural nucleus development26/289764/187231.09e-065.11e-0526
GO:00309011ColorectumSERmidbrain development29/289790/187235.50e-051.30e-0329
GO:00217622ColorectumMSSsubstantia nigra development21/346744/187239.54e-062.33e-0421
GO:00488572ColorectumMSSneural nucleus development26/346764/187233.19e-056.30e-0426
GO:00715391ColorectumMSSprotein localization to centrosome16/346733/187238.66e-051.40e-0316
GO:19055081ColorectumMSSprotein localization to microtubule organizing center16/346735/187232.07e-042.89e-0316
GO:00309012ColorectumMSSmidbrain development31/346790/187232.36e-043.24e-0331
GO:0044380ColorectumMSSprotein localization to cytoskeleton19/346758/187236.69e-034.38e-0219
GO:0072698ColorectumMSSprotein localization to microtubule cytoskeleton18/346754/187236.70e-034.38e-0218
GO:00715392ColorectumFAPprotein localization to centrosome14/262233/187236.39e-051.23e-0314
GO:19055082ColorectumFAPprotein localization to microtubule organizing center14/262235/187231.38e-042.18e-0314
Page: 1 2 3 4 5 

check button Enriched KEGG pathways.
Pathway IDTissueDisease StageDescriptionGene RatioBg Ratiopvaluep.adjustqvalueCount
Page: 1 

Top

Cell-cell communication analysis

check buttonIdentification of potential cell-cell interactions between two cell types and their ligand-receptor pairs for different disease states
LigandReceptorLRpairPathwayTissueDisease Stage
Page: 1 

Top

Single-cell gene regulatory network inference analysis

check buttonFind out the significant the regulons (TFs) and the target genes of each regulon across cell types for different disease states
TFCell TypeTissueDisease StageTarget GeneRSSRegulon Activity
∗The dot plots of a searched regulon are shown for all cell subpopulations in each disease state of each tissue based on the regulon specific score inferred using pySCENIC and by calculating the average expression.
Page: 1 

Top

Somatic mutation of malignant transformation related genes

check buttonAnnotation of somatic variants for genes involved in malignant transformation
Hugo SymbolVariant ClassVariant ClassificationdbSNP RSHGVScHGVSpHGVSp ShortSWISSPROTBIOTYPESIFTPolyPhenTumor Sample BarcodeTissueHistologySexAgeStageTherapy TypesDrugsOutcome
CCDC14SNVMissense_Mutationc.1394G>Cp.Arg465Thrp.R465TQ49A88protein_codingdeleterious(0.01)benign(0.096)TCGA-A2-A0CL-01Breastbreast invasive carcinomaFemale<65III/IVChemotherapycytoxanSD
CCDC14SNVMissense_Mutationrs372947520c.2045N>Gp.Thr682Serp.T682SQ49A88protein_codingtolerated(0.53)benign(0)TCGA-A8-A08L-01Breastbreast invasive carcinomaFemale>=65III/IVUnknownUnknownSD
CCDC14SNVMissense_Mutationc.116N>Gp.Ser39Trpp.S39WQ49A88protein_codingtolerated_low_confidence(0.2)benign(0.001)TCGA-AC-A23H-01Breastbreast invasive carcinomaFemale>=65I/IIUnknownUnknownPD
CCDC14SNVMissense_Mutationnovelc.806N>Cp.Gly269Alap.G269AQ49A88protein_codingtolerated(0.24)benign(0.027)TCGA-AC-A5XS-01Breastbreast invasive carcinomaFemale>=65I/IIHormone TherapyfemaraSD
CCDC14SNVMissense_Mutationc.679N>Tp.Pro227Serp.P227SQ49A88protein_codingtolerated(0.81)benign(0.046)TCGA-B6-A0WV-01Breastbreast invasive carcinomaFemale>=65I/IIUnknownUnknownSD
CCDC14SNVMissense_Mutationc.1682N>Cp.Leu561Prop.L561PQ49A88protein_codingdeleterious(0)probably_damaging(0.986)TCGA-BH-A18G-01Breastbreast invasive carcinomaFemale>=65I/IIUnknownUnknownSD
CCDC14SNVMissense_Mutationc.2129N>Tp.Ser710Phep.S710FQ49A88protein_codingtolerated(0.62)benign(0.146)TCGA-D8-A1JA-01Breastbreast invasive carcinomaFemale<65III/IVChemotherapyadriamycinPD
CCDC14SNVMissense_Mutationc.1269N>Gp.Ile423Metp.I423MQ49A88protein_codingdeleterious(0.02)possibly_damaging(0.882)TCGA-E9-A1RA-01Breastbreast invasive carcinomaFemale<65I/IIHormone TherapytamoxiphenSD
CCDC14deletionFrame_Shift_Delc.228delAp.Ala77ArgfsTer4p.A77Rfs*4Q49A88protein_codingTCGA-A2-A0EY-01Breastbreast invasive carcinomaFemale<65I/IIChemotherapyadriamycinSD
CCDC14insertionFrame_Shift_Insnovelc.1883_1884insGTCTCTCCCTCCTCTAATCCTTCCTATTTACTp.Leu631ProfsTer12p.L631Pfs*12Q49A88protein_codingTCGA-AO-A0J9-01Breastbreast invasive carcinomaFemale<65III/IVChemotherapycyclophosphamidePD
Page: 1 2 3 4 5 6 7 8 9 

Top

Related drugs of malignant transformation related genes

check buttonIdentification of chemicals and drugs interact with genes involved in malignant transfromation
(DGIdb 4.0)
Entrez IDSymbolCategoryInteraction TypesDrug Claim NameDrug NamePMIDs
Page: 1