
|
|||||
|
 | |
| |
| |
| |
| |
| |
|
Gene: CBX4 |
Gene summary for CBX4 |
| Gene information | Species | Human | Gene symbol | CBX4 | Gene ID | 8535 |
| Gene name | chromobox 4 | |
| Gene Alias | NBP16 | |
| Cytomap | 17q25.3 | |
| Gene Type | protein-coding | GO ID | GO:0000122 | UniProtAcc | A0A0S2Z5B2 |
Top |
Malignant transformation analysis |
| Identification of the aberrant gene expression in precancerous and cancerous lesions by comparing the gene expression of stem-like cells in diseased tissues with normal stem cells |
| Entrez ID | Symbol | Replicates | Species | Organ | Tissue | Adj P-value | Log2FC | Malignancy |
| 8535 | CBX4 | C57 | Human | Oral cavity | OSCC | 4.65e-02 | 2.03e-01 | 0.1679 |
| 8535 | CBX4 | C08 | Human | Oral cavity | OSCC | 4.92e-07 | 3.07e-01 | 0.1919 |
| 8535 | CBX4 | C09 | Human | Oral cavity | OSCC | 2.86e-05 | 3.05e-01 | 0.1431 |
| 8535 | CBX4 | LP15 | Human | Oral cavity | LP | 3.25e-06 | 1.00e+00 | 0.2174 |
| 8535 | CBX4 | EOLP-1 | Human | Oral cavity | EOLP | 3.11e-02 | 1.86e-01 | -0.0202 |
| 8535 | CBX4 | NEOLP-3 | Human | Oral cavity | NEOLP | 2.19e-02 | 2.22e-01 | -0.0191 |
| 8535 | CBX4 | SYSMH1 | Human | Oral cavity | OSCC | 3.92e-03 | 2.34e-01 | 0.1127 |
| 8535 | CBX4 | SYSMH2 | Human | Oral cavity | OSCC | 2.55e-09 | 3.55e-01 | 0.2326 |
| 8535 | CBX4 | SYSMH3 | Human | Oral cavity | OSCC | 2.37e-07 | 3.16e-01 | 0.2442 |
| 8535 | CBX4 | SYSMH4 | Human | Oral cavity | OSCC | 4.09e-06 | 2.19e-01 | 0.1226 |
| 8535 | CBX4 | SYSMH6 | Human | Oral cavity | OSCC | 2.47e-11 | 3.38e-01 | 0.1275 |
| 8535 | CBX4 | GSM5252136_BPH556PrGA1_Fcol | Human | Prostate | BPH | 3.93e-07 | 3.06e-01 | -0.23 |
| 8535 | CBX4 | GSM5252137_BPH556PrGA2_Fcol | Human | Prostate | BPH | 3.45e-06 | 2.82e-01 | -0.23 |
| 8535 | CBX4 | 048752_1579-all-cells | Human | Prostate | BPH | 4.61e-05 | 1.70e-01 | 0.1008 |
| 8535 | CBX4 | Dong_P1 | Human | Prostate | Tumor | 1.87e-12 | 1.42e-01 | 0.035 |
| 8535 | CBX4 | Dong_P3 | Human | Prostate | Tumor | 1.43e-09 | 1.68e-01 | 0.0278 |
| 8535 | CBX4 | Dong_P4 | Human | Prostate | Tumor | 3.94e-12 | 3.70e-01 | 0.0292 |
| 8535 | CBX4 | Dong_P5 | Human | Prostate | Tumor | 1.51e-31 | 2.17e-01 | 0.053 |
| 8535 | CBX4 | P9 | Human | Prostate | Tumor | 7.56e-05 | 3.39e-01 | -0.0285 |
| 8535 | CBX4 | GSM5353220_PA_PB1B_Pool_3_S51_L002 | Human | Prostate | Tumor | 3.86e-04 | 7.09e-01 | 0.1531 |
| Page: 1 2 3 4 5 6 |
| Tissue | Expression Dynamics | Abbreviation |
| Colorectum (GSE201348) |  | FAP: Familial adenomatous polyposis |
| CRC: Colorectal cancer | ||
| Colorectum (HTA11) | 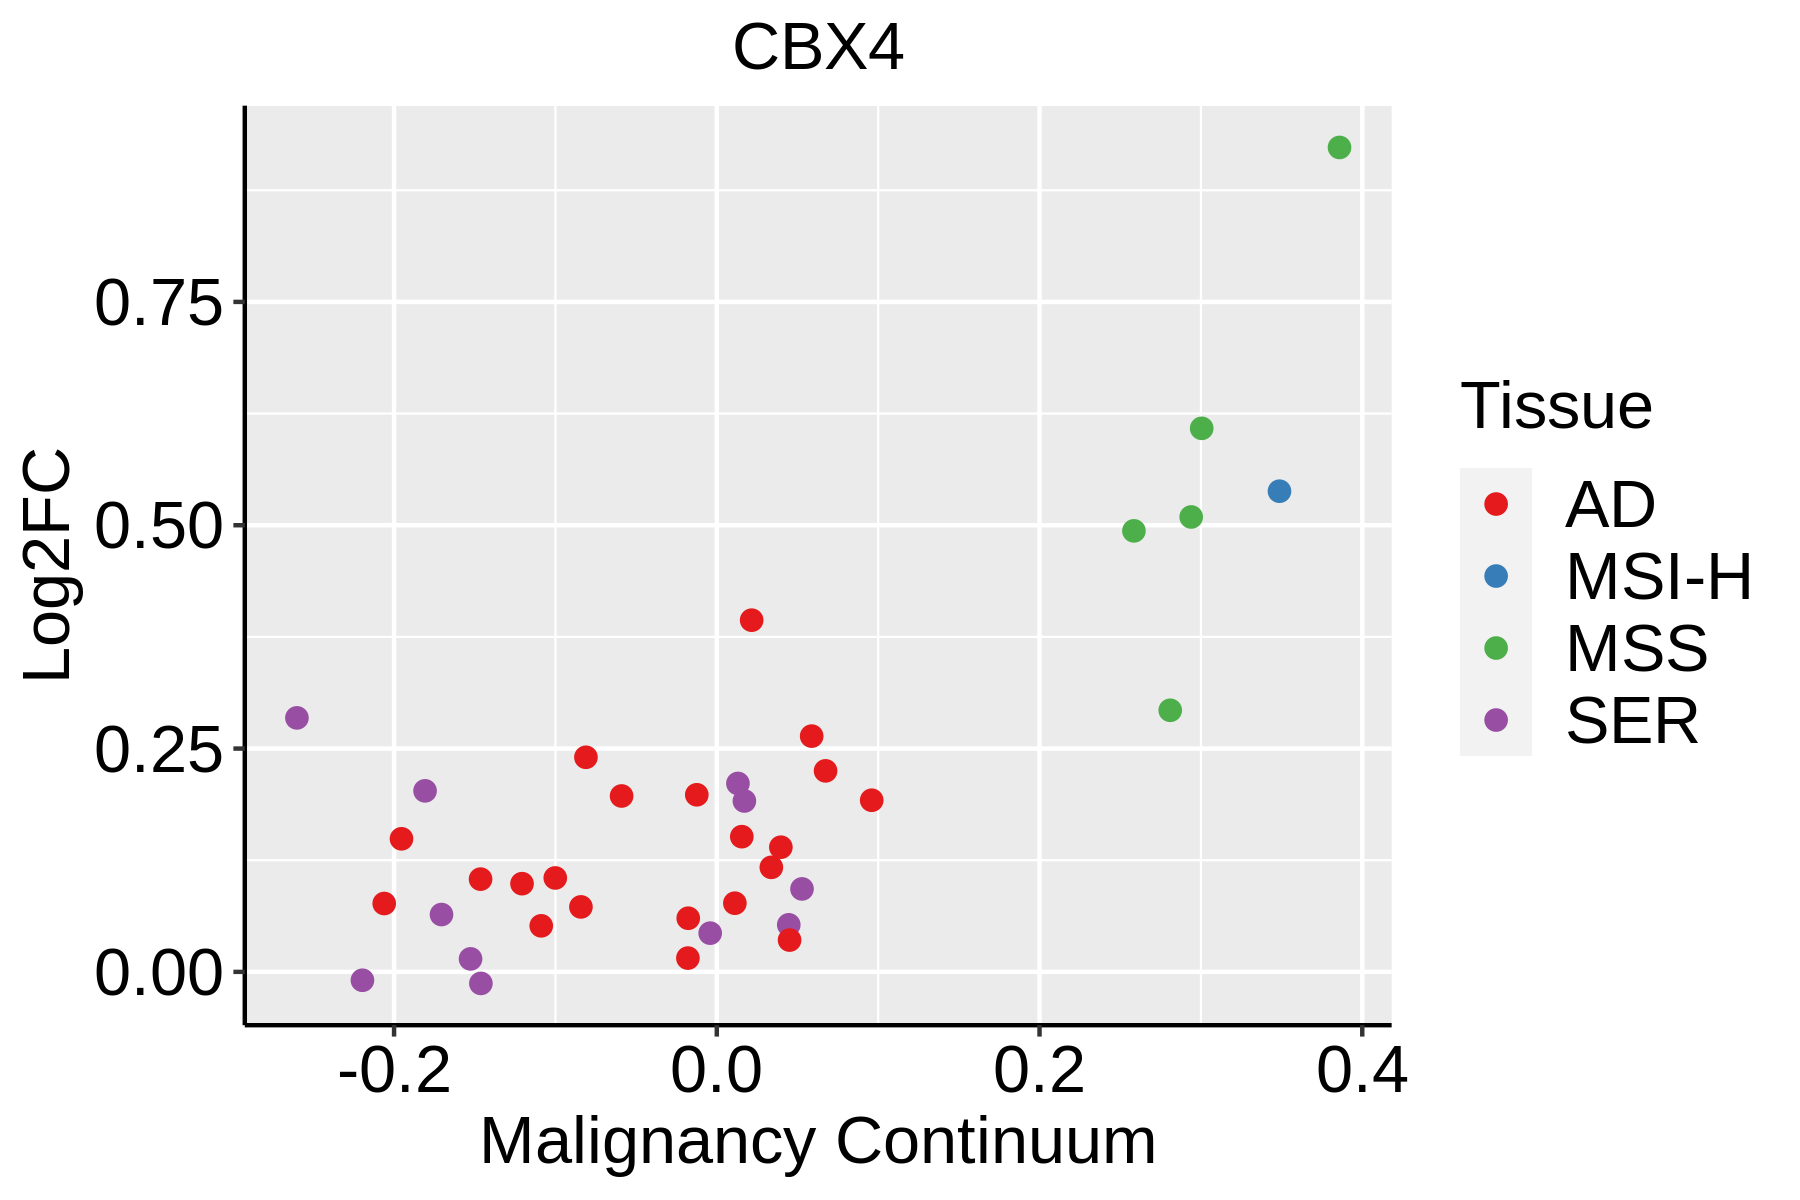 | AD: Adenomas |
| SER: Sessile serrated lesions | ||
| MSI-H: Microsatellite-high colorectal cancer | ||
| MSS: Microsatellite stable colorectal cancer | ||
| Esophagus |  | ESCC: Esophageal squamous cell carcinoma |
| HGIN: High-grade intraepithelial neoplasias | ||
| LGIN: Low-grade intraepithelial neoplasias | ||
| Liver | 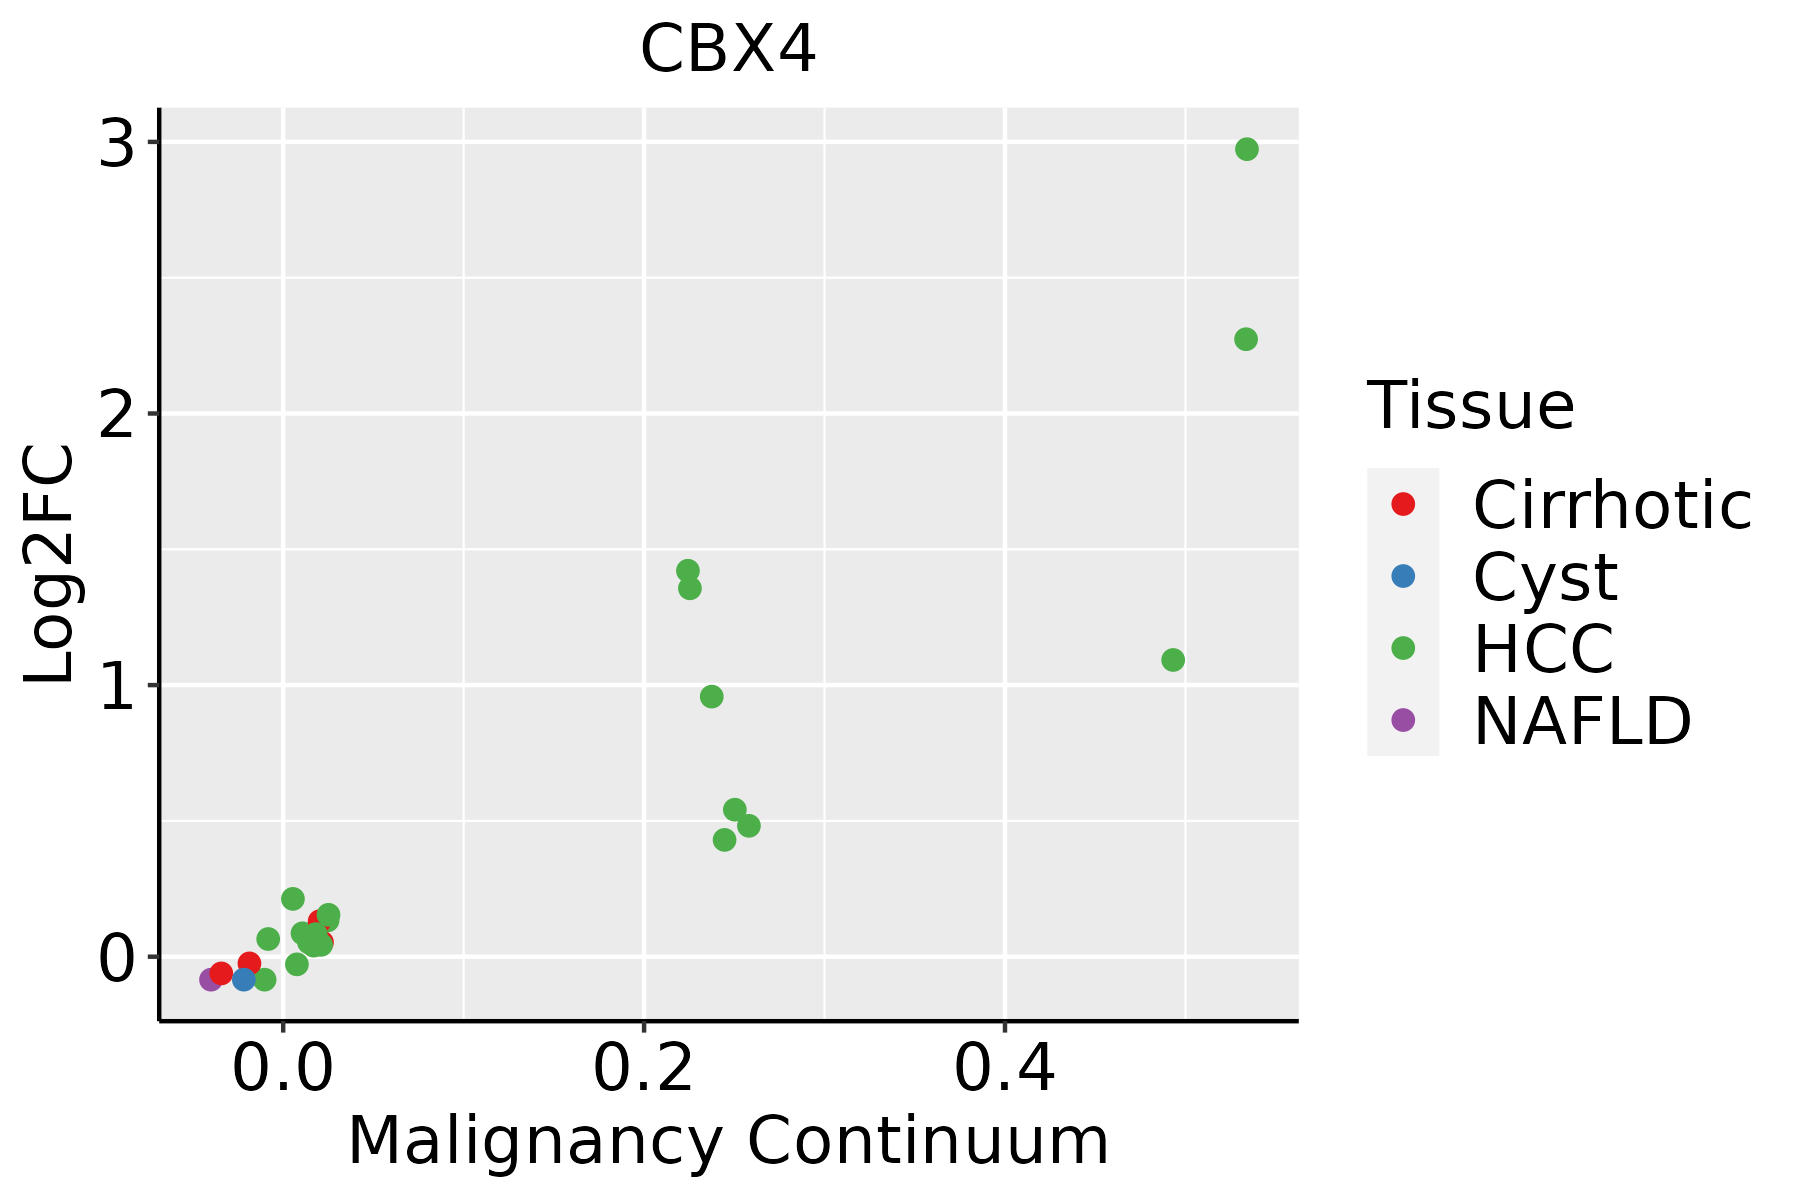 | HCC: Hepatocellular carcinoma |
| NAFLD: Non-alcoholic fatty liver disease | ||
| Oral Cavity | 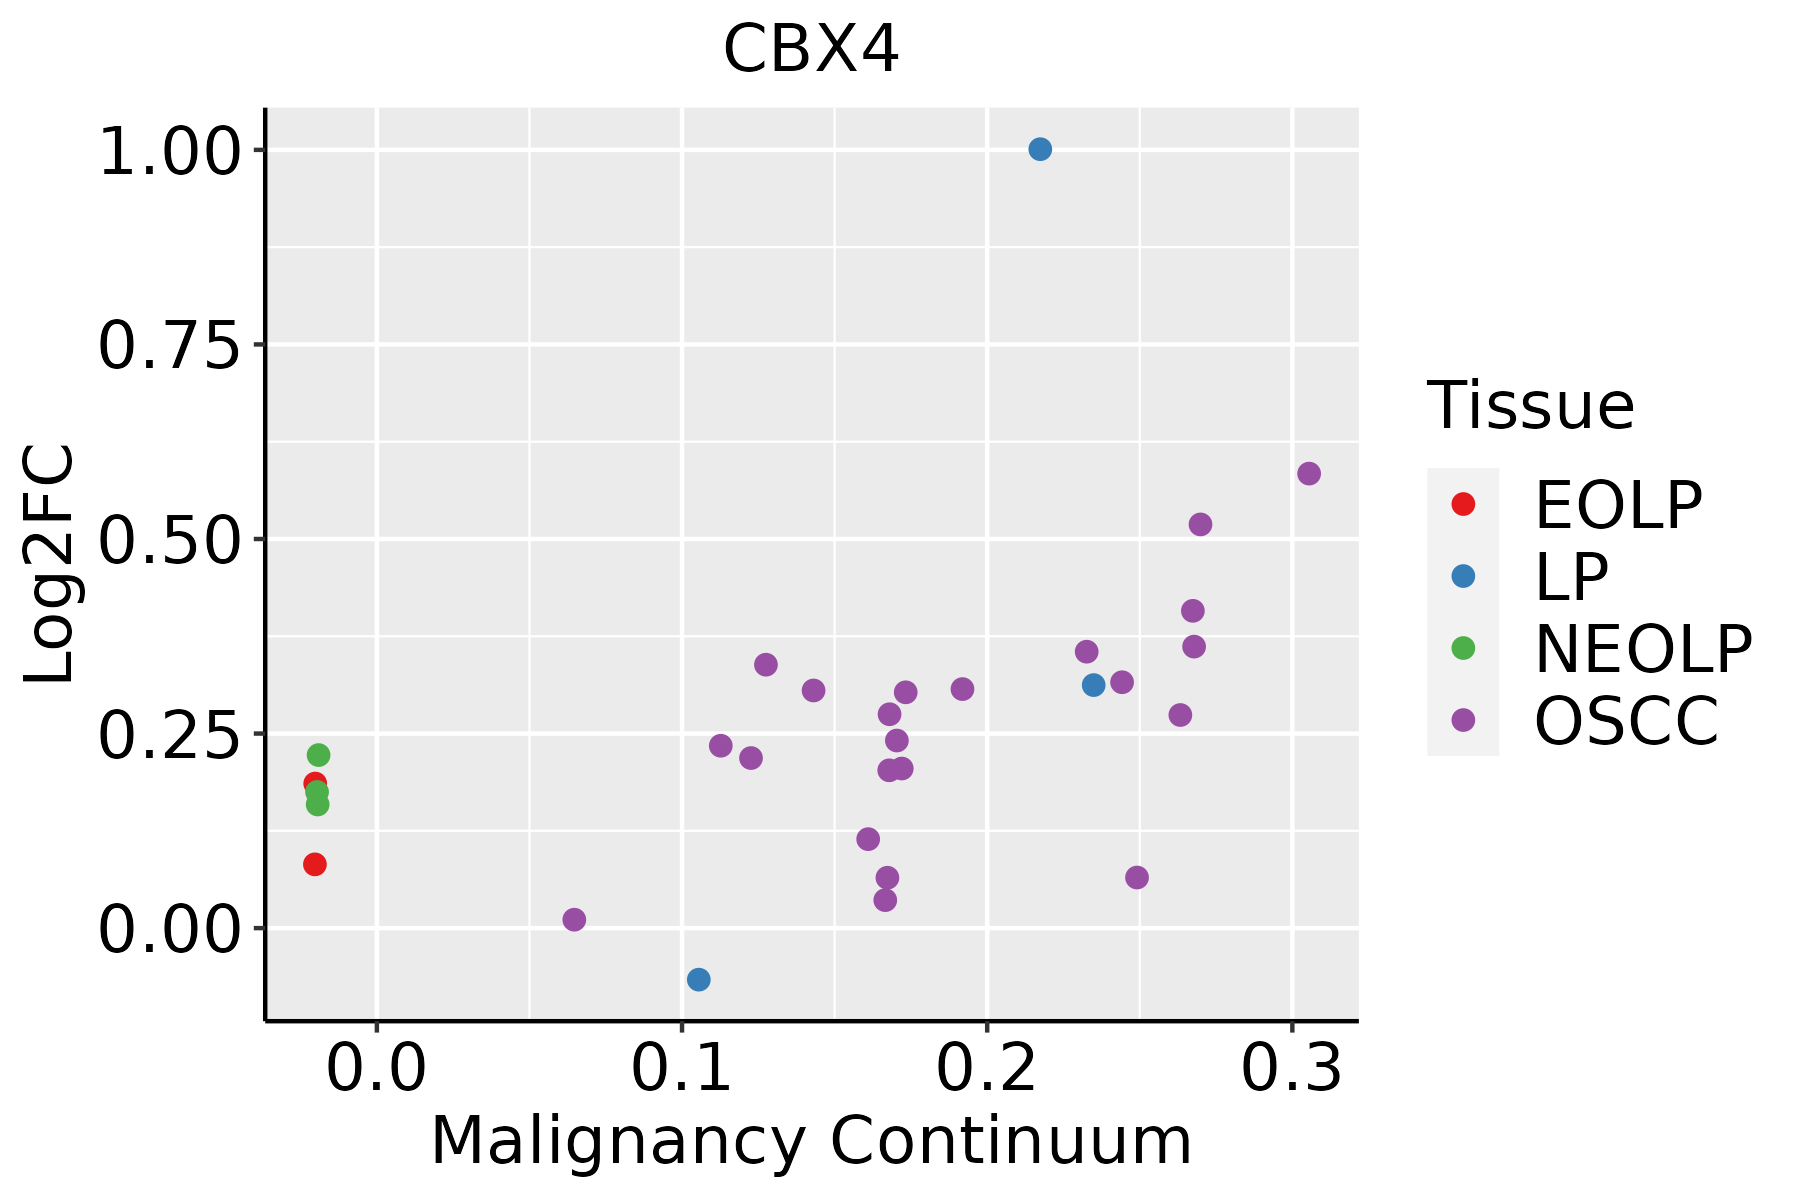 | EOLP: Erosive Oral lichen planus |
| LP: leukoplakia | ||
| NEOLP: Non-erosive oral lichen planus | ||
| OSCC: Oral squamous cell carcinoma | ||
| Prostate |  | BPH: Benign Prostatic Hyperplasia |
| ∗log2FC in expression of this searched gene in stem-like cells from each diseased tissue sample relative to stem-like cells in normal samples in each tissue plotted against the malignancy continuum. Samples are colored based on if they are from different disease stage. |
Top |
Malignant transformation related pathway analysis |
| Find out the enriched GO biological processes and KEGG pathways involved in transition from healthy to precancer to cancer |
| Tissue | Disease Stage | Enriched GO biological Processes |
| Colorectum | AD |  |
| Colorectum | SER |  |
| Colorectum | MSS |  |
| Colorectum | MSI-H |  |
| Colorectum | FAP |  |
| ∗Top 15 enriched GO BP terms are showed in the bar plot of each disease state in each tissue. Each row represents a significant GO biological process which is colored according to the -log10(p.adjust). |
| Page: 1 2 3 4 5 6 7 8 9 |
| GO ID | Tissue | Disease Stage | Description | Gene Ratio | Bg Ratio | pvalue | p.adjust | Count |
| GO:0006325 | Colorectum | AD | chromatin organization | 119/3918 | 409/18723 | 4.85e-05 | 8.33e-04 | 119 |
| GO:00063252 | Colorectum | MSS | chromatin organization | 107/3467 | 409/18723 | 7.22e-05 | 1.21e-03 | 107 |
| GO:00182057 | Esophagus | HGIN | peptidyl-lysine modification | 88/2587 | 376/18723 | 2.99e-07 | 1.39e-05 | 88 |
| GO:000632516 | Esophagus | HGIN | chromatin organization | 92/2587 | 409/18723 | 1.05e-06 | 4.16e-05 | 92 |
| GO:00169254 | Esophagus | HGIN | protein sumoylation | 18/2587 | 53/18723 | 1.64e-04 | 3.19e-03 | 18 |
| GO:001820514 | Esophagus | ESCC | peptidyl-lysine modification | 259/8552 | 376/18723 | 3.90e-20 | 5.26e-18 | 259 |
| GO:000632517 | Esophagus | ESCC | chromatin organization | 240/8552 | 409/18723 | 6.52e-08 | 1.14e-06 | 240 |
| GO:001692512 | Esophagus | ESCC | protein sumoylation | 41/8552 | 53/18723 | 2.49e-06 | 2.86e-05 | 41 |
| GO:00182051 | Liver | Cirrhotic | peptidyl-lysine modification | 134/4634 | 376/18723 | 1.29e-06 | 2.59e-05 | 134 |
| GO:00182052 | Liver | HCC | peptidyl-lysine modification | 230/7958 | 376/18723 | 1.51e-13 | 8.32e-12 | 230 |
| GO:000632511 | Liver | HCC | chromatin organization | 206/7958 | 409/18723 | 7.23e-04 | 4.41e-03 | 206 |
| GO:0016925 | Liver | HCC | protein sumoylation | 34/7958 | 53/18723 | 1.20e-03 | 6.68e-03 | 34 |
| GO:00182056 | Oral cavity | OSCC | peptidyl-lysine modification | 216/7305 | 376/18723 | 2.32e-13 | 1.16e-11 | 216 |
| GO:00169253 | Oral cavity | OSCC | protein sumoylation | 33/7305 | 53/18723 | 5.11e-04 | 2.98e-03 | 33 |
| GO:000632510 | Oral cavity | OSCC | chromatin organization | 190/7305 | 409/18723 | 1.17e-03 | 5.97e-03 | 190 |
| GO:001820513 | Oral cavity | LP | peptidyl-lysine modification | 136/4623 | 376/18723 | 3.64e-07 | 1.06e-05 | 136 |
| GO:001692511 | Oral cavity | LP | protein sumoylation | 24/4623 | 53/18723 | 8.55e-04 | 7.45e-03 | 24 |
| GO:000632515 | Oral cavity | EOLP | chromatin organization | 84/2218 | 409/18723 | 2.68e-07 | 8.16e-06 | 84 |
| GO:001820521 | Oral cavity | EOLP | peptidyl-lysine modification | 72/2218 | 376/18723 | 2.38e-05 | 3.56e-04 | 72 |
| GO:000632521 | Oral cavity | NEOLP | chromatin organization | 70/2005 | 409/18723 | 4.97e-05 | 6.83e-04 | 70 |
| Page: 1 2 |
| Pathway ID | Tissue | Disease Stage | Description | Gene Ratio | Bg Ratio | pvalue | p.adjust | qvalue | Count |
| Page: 1 |
Top |
Cell-cell communication analysis |
| Identification of potential cell-cell interactions between two cell types and their ligand-receptor pairs for different disease states |
| Ligand | Receptor | LRpair | Pathway | Tissue | Disease Stage |
| Page: 1 |
Top |
Single-cell gene regulatory network inference analysis |
| Find out the significant the regulons (TFs) and the target genes of each regulon across cell types for different disease states |
| TF | Cell Type | Tissue | Disease Stage | Target Gene | RSS | Regulon Activity |
| ∗The dot plots of a searched regulon are shown for all cell subpopulations in each disease state of each tissue based on the regulon specific score inferred using pySCENIC and by calculating the average expression. |
| Page: 1 |
Top |
Somatic mutation of malignant transformation related genes |
| Annotation of somatic variants for genes involved in malignant transformation |
| Hugo Symbol | Variant Class | Variant Classification | dbSNP RS | HGVSc | HGVSp | HGVSp Short | SWISSPROT | BIOTYPE | SIFT | PolyPhen | Tumor Sample Barcode | Tissue | Histology | Sex | Age | Stage | Therapy Types | Drugs | Outcome |
| CBX4 | SNV | Missense_Mutation | c.952N>C | p.Glu318Gln | p.E318Q | O00257 | protein_coding | tolerated(0.07) | possibly_damaging(0.749) | TCGA-AC-A23H-01 | Breast | breast invasive carcinoma | Female | >=65 | I/II | Unknown | Unknown | PD | |
| CBX4 | SNV | Missense_Mutation | c.530N>G | p.His177Arg | p.H177R | O00257 | protein_coding | tolerated(0.23) | benign(0.079) | TCGA-AO-A128-01 | Breast | breast invasive carcinoma | Female | <65 | I/II | Chemotherapy | doxorubicin | SD | |
| CBX4 | SNV | Missense_Mutation | rs760922762 | c.1000N>A | p.Gly334Arg | p.G334R | O00257 | protein_coding | tolerated(0.24) | benign(0) | TCGA-C5-A1ME-01 | Cervix | cervical & endocervical cancer | Female | <65 | I/II | Unknown | Unknown | SD |
| CBX4 | SNV | Missense_Mutation | c.1456G>A | p.Glu486Lys | p.E486K | O00257 | protein_coding | tolerated(0.12) | benign(0.068) | TCGA-DS-A0VN-01 | Cervix | cervical & endocervical cancer | Female | <65 | I/II | Chemotherapy | cisplatin | SD | |
| CBX4 | SNV | Missense_Mutation | c.127N>A | p.Glu43Lys | p.E43K | O00257 | protein_coding | deleterious(0) | probably_damaging(0.996) | TCGA-SS-A7HO-01 | Colorectum | colon adenocarcinoma | Female | <65 | I/II | Chemotherapy | oxaliplatin | PD | |
| CBX4 | deletion | Frame_Shift_Del | novel | c.862delN | p.Glu288ArgfsTer117 | p.E288Rfs*117 | O00257 | protein_coding | TCGA-AA-A022-01 | Colorectum | colon adenocarcinoma | Female | >=65 | I/II | Unknown | Unknown | SD | ||
| CBX4 | insertion | Frame_Shift_Ins | rs772839792 | c.690dupC | p.Asn231GlnfsTer81 | p.N231Qfs*81 | O00257 | protein_coding | TCGA-G4-6588-01 | Colorectum | colon adenocarcinoma | Female | <65 | I/II | Unknown | Unknown | SD | ||
| CBX4 | SNV | Missense_Mutation | novel | c.420G>T | p.Lys140Asn | p.K140N | O00257 | protein_coding | deleterious(0.01) | possibly_damaging(0.535) | TCGA-AJ-A23O-01 | Endometrium | uterine corpus endometrioid carcinoma | Female | >=65 | I/II | Unknown | Unknown | SD |
| CBX4 | SNV | Missense_Mutation | c.733N>A | p.Gly245Arg | p.G245R | O00257 | protein_coding | deleterious(0) | probably_damaging(0.927) | TCGA-AP-A051-01 | Endometrium | uterine corpus endometrioid carcinoma | Female | >=65 | I/II | Unknown | Unknown | SD | |
| CBX4 | SNV | Missense_Mutation | c.890G>A | p.Arg297Gln | p.R297Q | O00257 | protein_coding | deleterious(0.02) | benign(0.01) | TCGA-AP-A0LM-01 | Endometrium | uterine corpus endometrioid carcinoma | Female | <65 | III/IV | Chemotherapy | cisplatin | SD |
| Page: 1 2 3 4 |
Top |
Related drugs of malignant transformation related genes |
| Identification of chemicals and drugs interact with genes involved in malignant transfromation |
| (DGIdb 4.0) |
| Entrez ID | Symbol | Category | Interaction Types | Drug Claim Name | Drug Name | PMIDs |
| Page: 1 |

Copyright 2023-Present -The University of Texas Health Science Center at Houston |