Schematic overview of the cellular and molecular mechanisms involved in the cancer progression, including the proposed cellular and molecular mechanisms in cancer cells trajectory. AT1: alveolar type 1 cells; AT2: alveolar type 2 cells; AAH: atypical adenomatous hyperplasia; AIS: adenocarcinoma in situ; MIA: minimally invasive adenocarcinoma; IA: invasive adenocarcinoma; EMT: epithelial-mesenchymal transition

Home

Download

Statistics

Help

Contact

Center for Computational Systems Medicine
leaf

Gene summary

leaf

Malignant transformation analysis

leaf

Malignant transformation related pathway analysis

leaf

Cell-cell communication analysis

leaf

Single-cell gene regulatory network inference analysis

leaf

Somatic mutation of malignant transformation related genes

leaf

Related drugs of malignant transformation related genes

Gene: CAMTA1

Gene summary for CAMTA1

check button Gene summary.

Gene informationSpeciesHuman
Gene symbol

CAMTA1

Gene ID

23261

Gene namecalmodulin binding transcription activator 1
Gene AliasCANPMR
Cytomap1p36.31-p36.23
Gene Typeprotein-coding
GO ID

GO:0006139

UniProtAcc

Q9Y6Y1


Top

Malignant transformation analysis

check button Identification of the aberrant gene expression in precancerous and cancerous lesions by comparing the gene expression of stem-like cells in diseased tissues with normal stem cells
check button Malignant transformation involving gene list.
Entrez IDSymbolReplicatesSpeciesOrganTissueAdj P-valueLog2FCMalignancy
23261CAMTA1P28T-EHumanEsophagusESCC2.38e-328.22e-010.1149
23261CAMTA1P30T-EHumanEsophagusESCC6.83e-311.18e+000.137
23261CAMTA1P31T-EHumanEsophagusESCC8.01e-671.27e+000.1251
23261CAMTA1P32T-EHumanEsophagusESCC1.76e-521.25e+000.1666
23261CAMTA1P36T-EHumanEsophagusESCC7.05e-167.45e-010.1187
23261CAMTA1P37T-EHumanEsophagusESCC8.14e-411.25e+000.1371
23261CAMTA1P38T-EHumanEsophagusESCC2.90e-086.35e-010.127
23261CAMTA1P39T-EHumanEsophagusESCC1.11e-122.46e-010.0894
23261CAMTA1P40T-EHumanEsophagusESCC2.94e-201.03e+000.109
23261CAMTA1P42T-EHumanEsophagusESCC3.52e-177.28e-010.1175
23261CAMTA1P44T-EHumanEsophagusESCC1.05e-144.60e-010.1096
23261CAMTA1P47T-EHumanEsophagusESCC6.16e-204.27e-010.1067
23261CAMTA1P48T-EHumanEsophagusESCC2.73e-195.18e-010.0959
23261CAMTA1P49T-EHumanEsophagusESCC6.66e-202.16e+000.1768
23261CAMTA1P52T-EHumanEsophagusESCC8.69e-421.21e+000.1555
23261CAMTA1P54T-EHumanEsophagusESCC8.27e-391.30e+000.0975
23261CAMTA1P56T-EHumanEsophagusESCC3.65e-111.75e+000.1613
23261CAMTA1P57T-EHumanEsophagusESCC3.72e-267.34e-010.0926
23261CAMTA1P61T-EHumanEsophagusESCC1.14e-075.18e-010.099
23261CAMTA1P62T-EHumanEsophagusESCC2.22e-601.23e+000.1302
Page: 1 2 3 4 5 6 7 8 9 10 11 12 

check button Transcriptomic changes along malignancy continuum.
TissueExpression DynamicsAbbreviation
BreastThe image shows the transcriptomic changes along malignancy continuum.log2FC in expression of this searched gene in stem-like cells from each diseased tissue sample relative to stem-like cells in normal samples in each tissue plotted against the malignancy continuum. Samples are colored based on if they are from different disease stage.
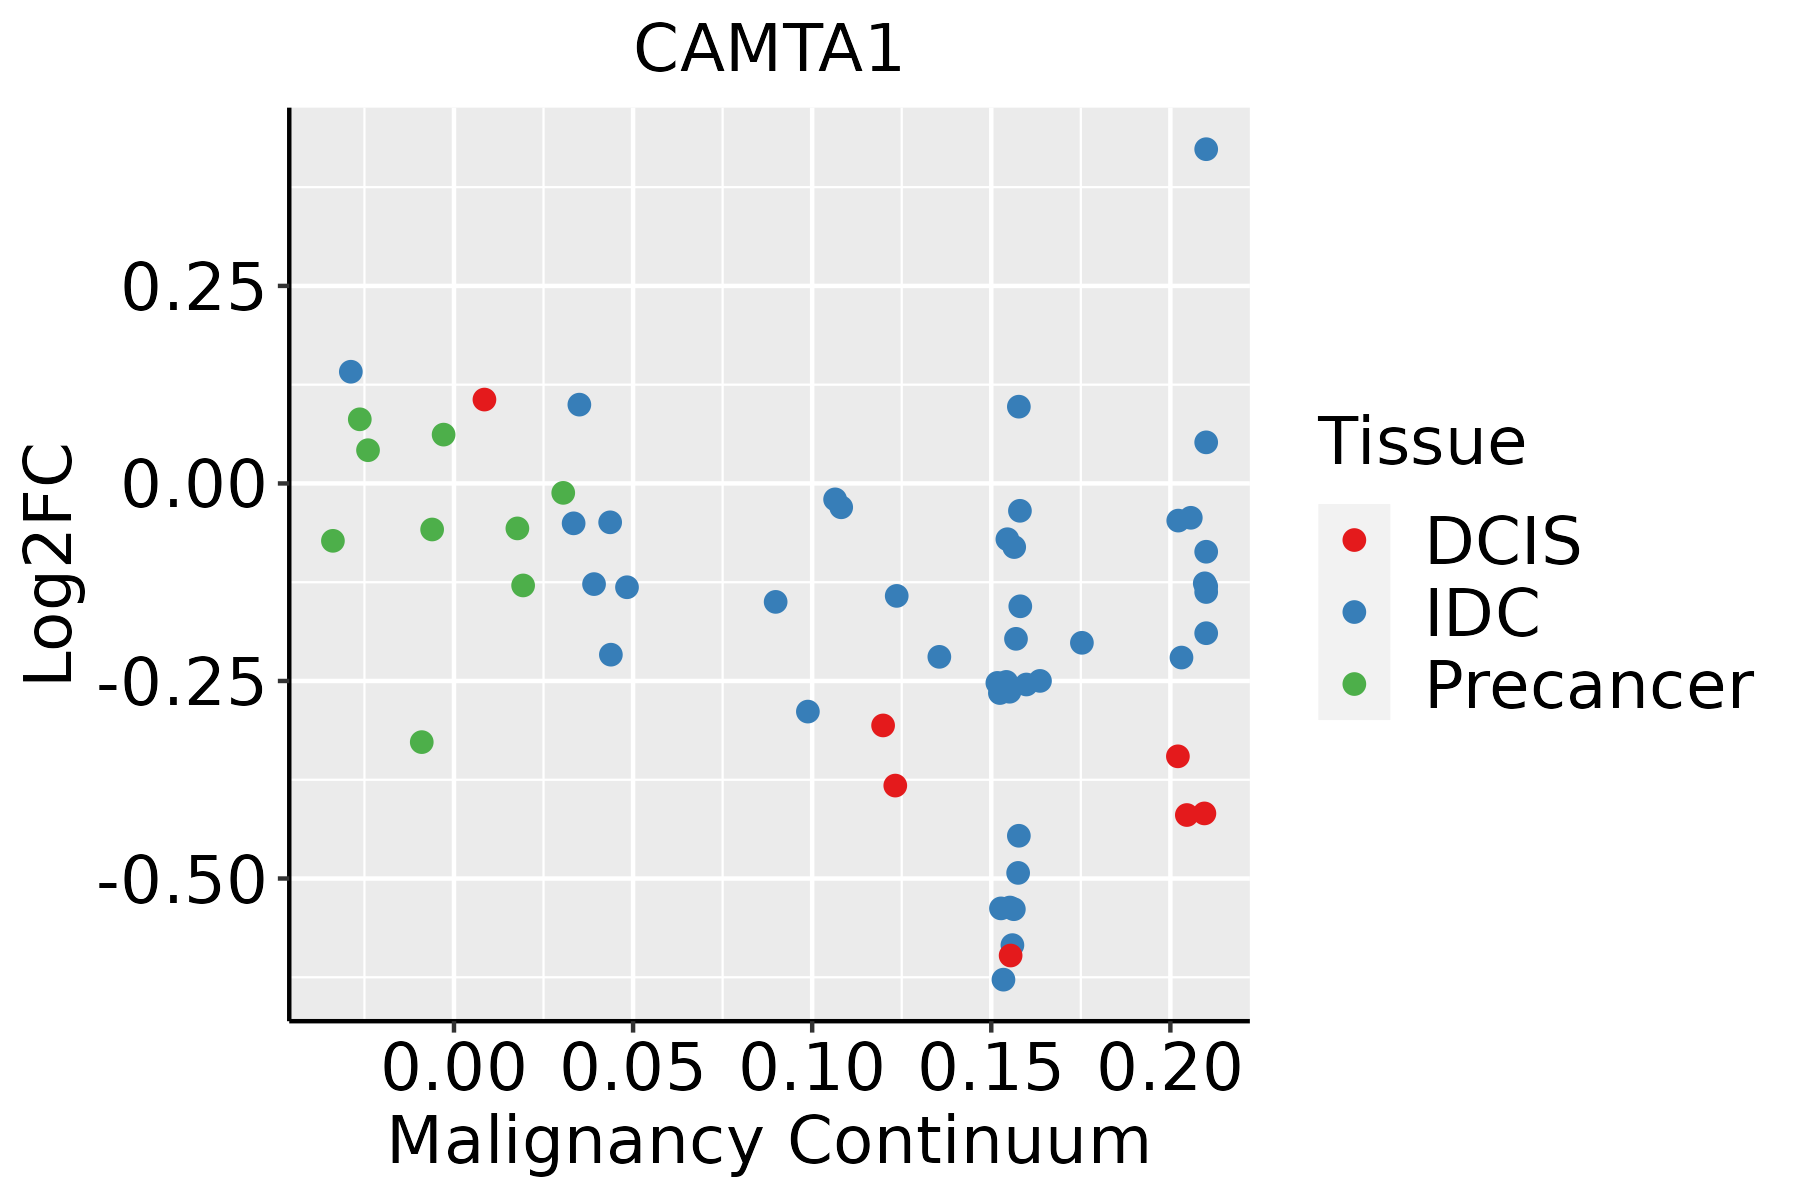
IDC: Invasive ductal carcinoma
DCIS: Ductal carcinoma in situ
Precancer(BRCA1-mut): Precancerous lesion from BRCA1 mutation carriers
Colorectum (GSE201348)The image shows the transcriptomic changes along malignancy continuum.log2FC in expression of this searched gene in stem-like cells from each diseased tissue sample relative to stem-like cells in normal samples in each tissue plotted against the malignancy continuum. Samples are colored based on if they are from different disease stage.FAP: Familial adenomatous polyposis
CRC: Colorectal cancer
Colorectum (HTA11)The image shows the transcriptomic changes along malignancy continuum.log2FC in expression of this searched gene in stem-like cells from each diseased tissue sample relative to stem-like cells in normal samples in each tissue plotted against the malignancy continuum. Samples are colored based on if they are from different disease stage.AD: Adenomas
SER: Sessile serrated lesions
MSI-H: Microsatellite-high colorectal cancer
MSS: Microsatellite stable colorectal cancer
EsophagusThe image shows the transcriptomic changes along malignancy continuum.log2FC in expression of this searched gene in stem-like cells from each diseased tissue sample relative to stem-like cells in normal samples in each tissue plotted against the malignancy continuum. Samples are colored based on if they are from different disease stage.
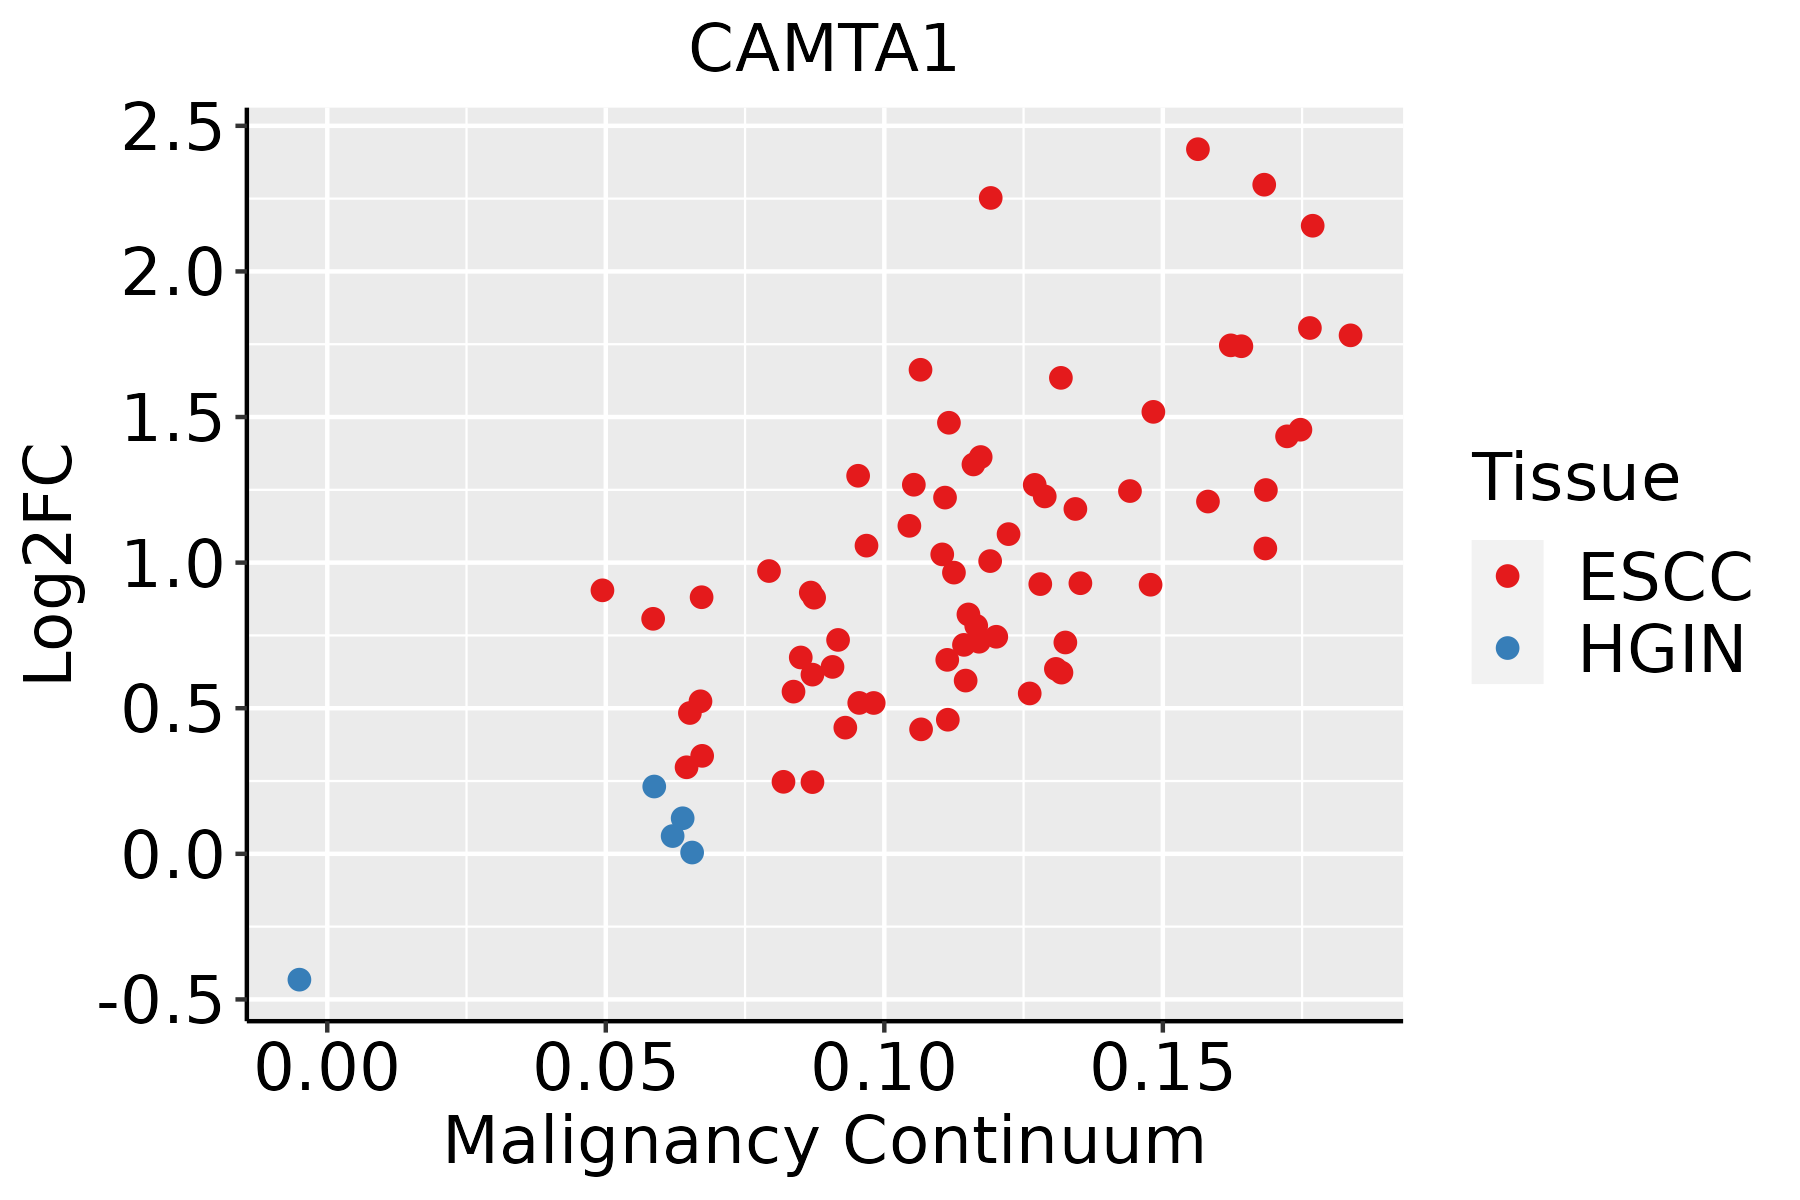
ESCC: Esophageal squamous cell carcinoma
HGIN: High-grade intraepithelial neoplasias
LGIN: Low-grade intraepithelial neoplasias
LiverThe image shows the transcriptomic changes along malignancy continuum.log2FC in expression of this searched gene in stem-like cells from each diseased tissue sample relative to stem-like cells in normal samples in each tissue plotted against the malignancy continuum. Samples are colored based on if they are from different disease stage.
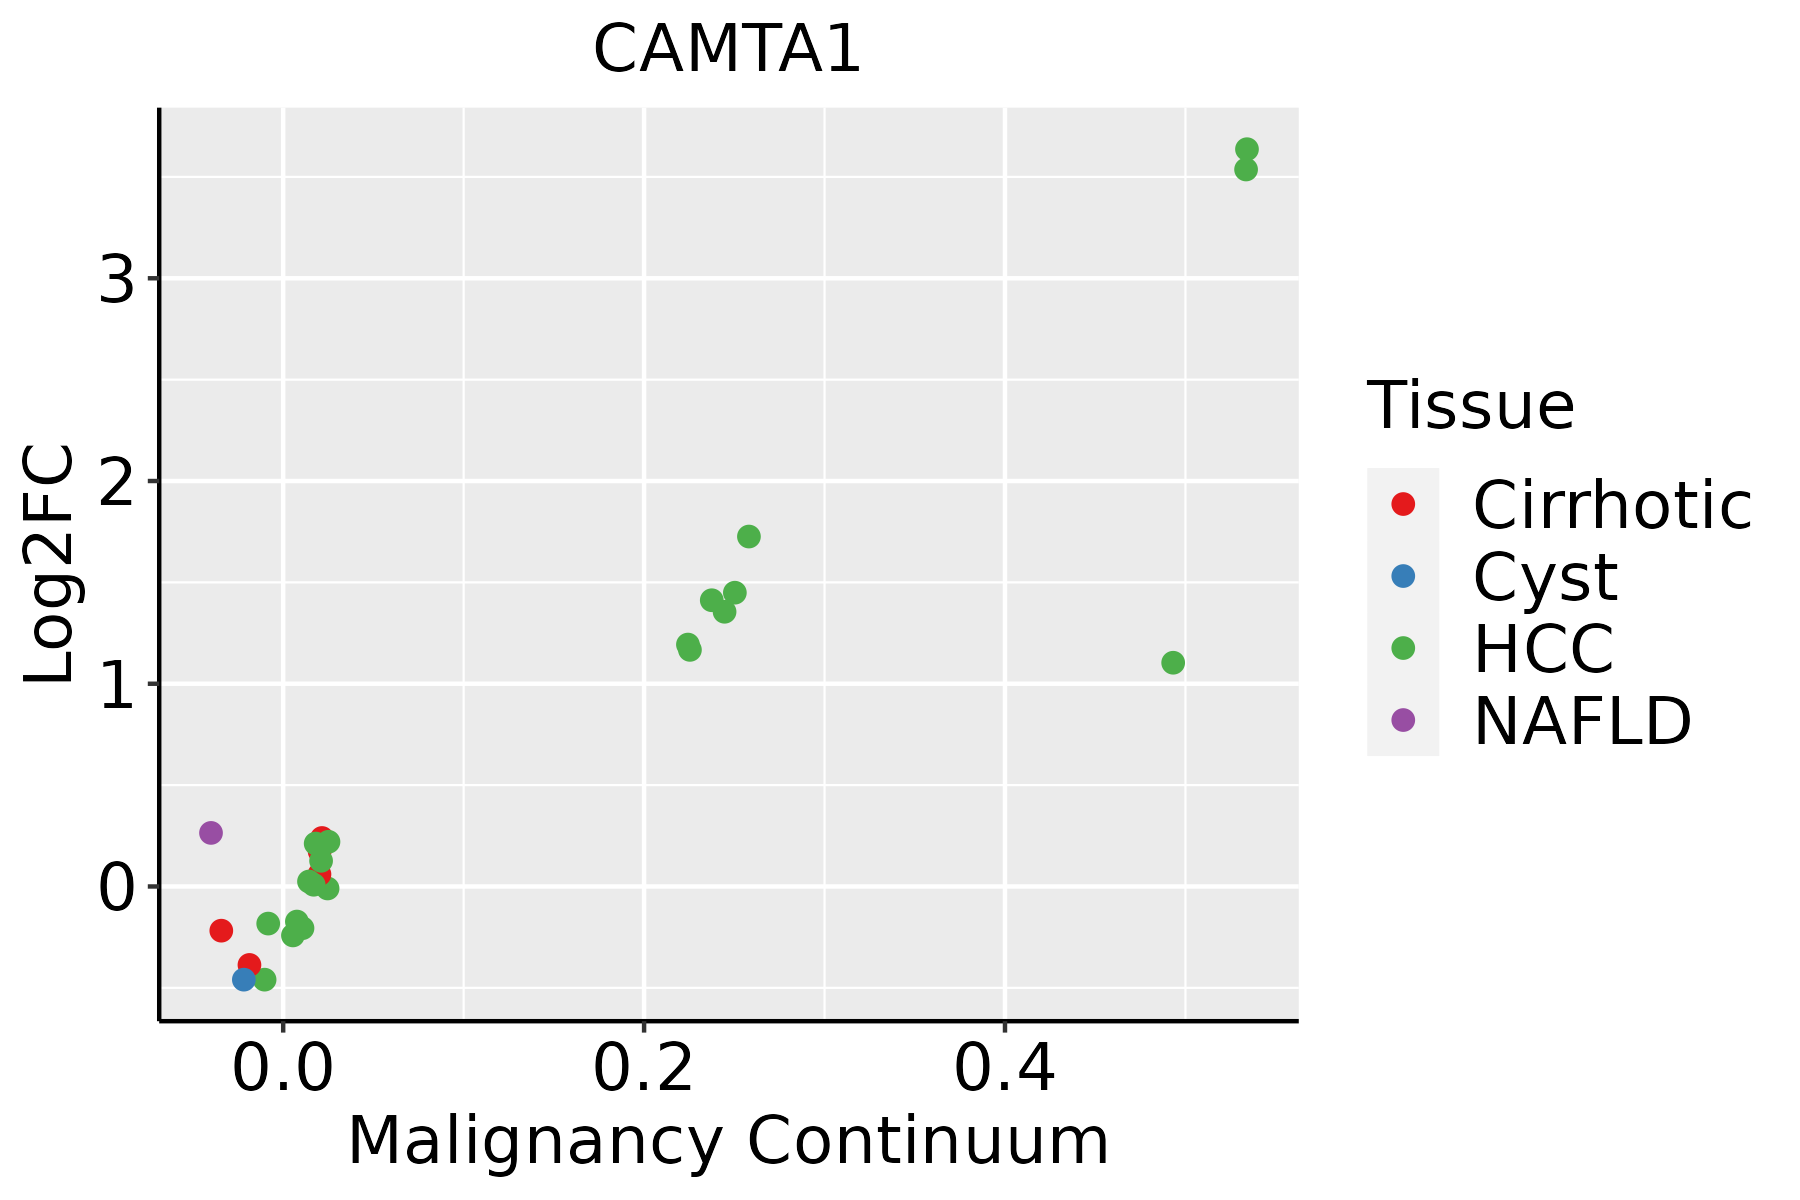
HCC: Hepatocellular carcinoma
NAFLD: Non-alcoholic fatty liver disease
LungThe image shows the transcriptomic changes along malignancy continuum.log2FC in expression of this searched gene in stem-like cells from each diseased tissue sample relative to stem-like cells in normal samples in each tissue plotted against the malignancy continuum. Samples are colored based on if they are from different disease stage.AAH: Atypical adenomatous hyperplasia
AIS: Adenocarcinoma in situ
IAC: Invasive lung adenocarcinoma
MIA: Minimally invasive adenocarcinoma
Oral CavityThe image shows the transcriptomic changes along malignancy continuum.log2FC in expression of this searched gene in stem-like cells from each diseased tissue sample relative to stem-like cells in normal samples in each tissue plotted against the malignancy continuum. Samples are colored based on if they are from different disease stage.EOLP: Erosive Oral lichen planus
LP: leukoplakia
NEOLP: Non-erosive oral lichen planus
OSCC: Oral squamous cell carcinoma
ProstateThe image shows the transcriptomic changes along malignancy continuum.log2FC in expression of this searched gene in stem-like cells from each diseased tissue sample relative to stem-like cells in normal samples in each tissue plotted against the malignancy continuum. Samples are colored based on if they are from different disease stage.
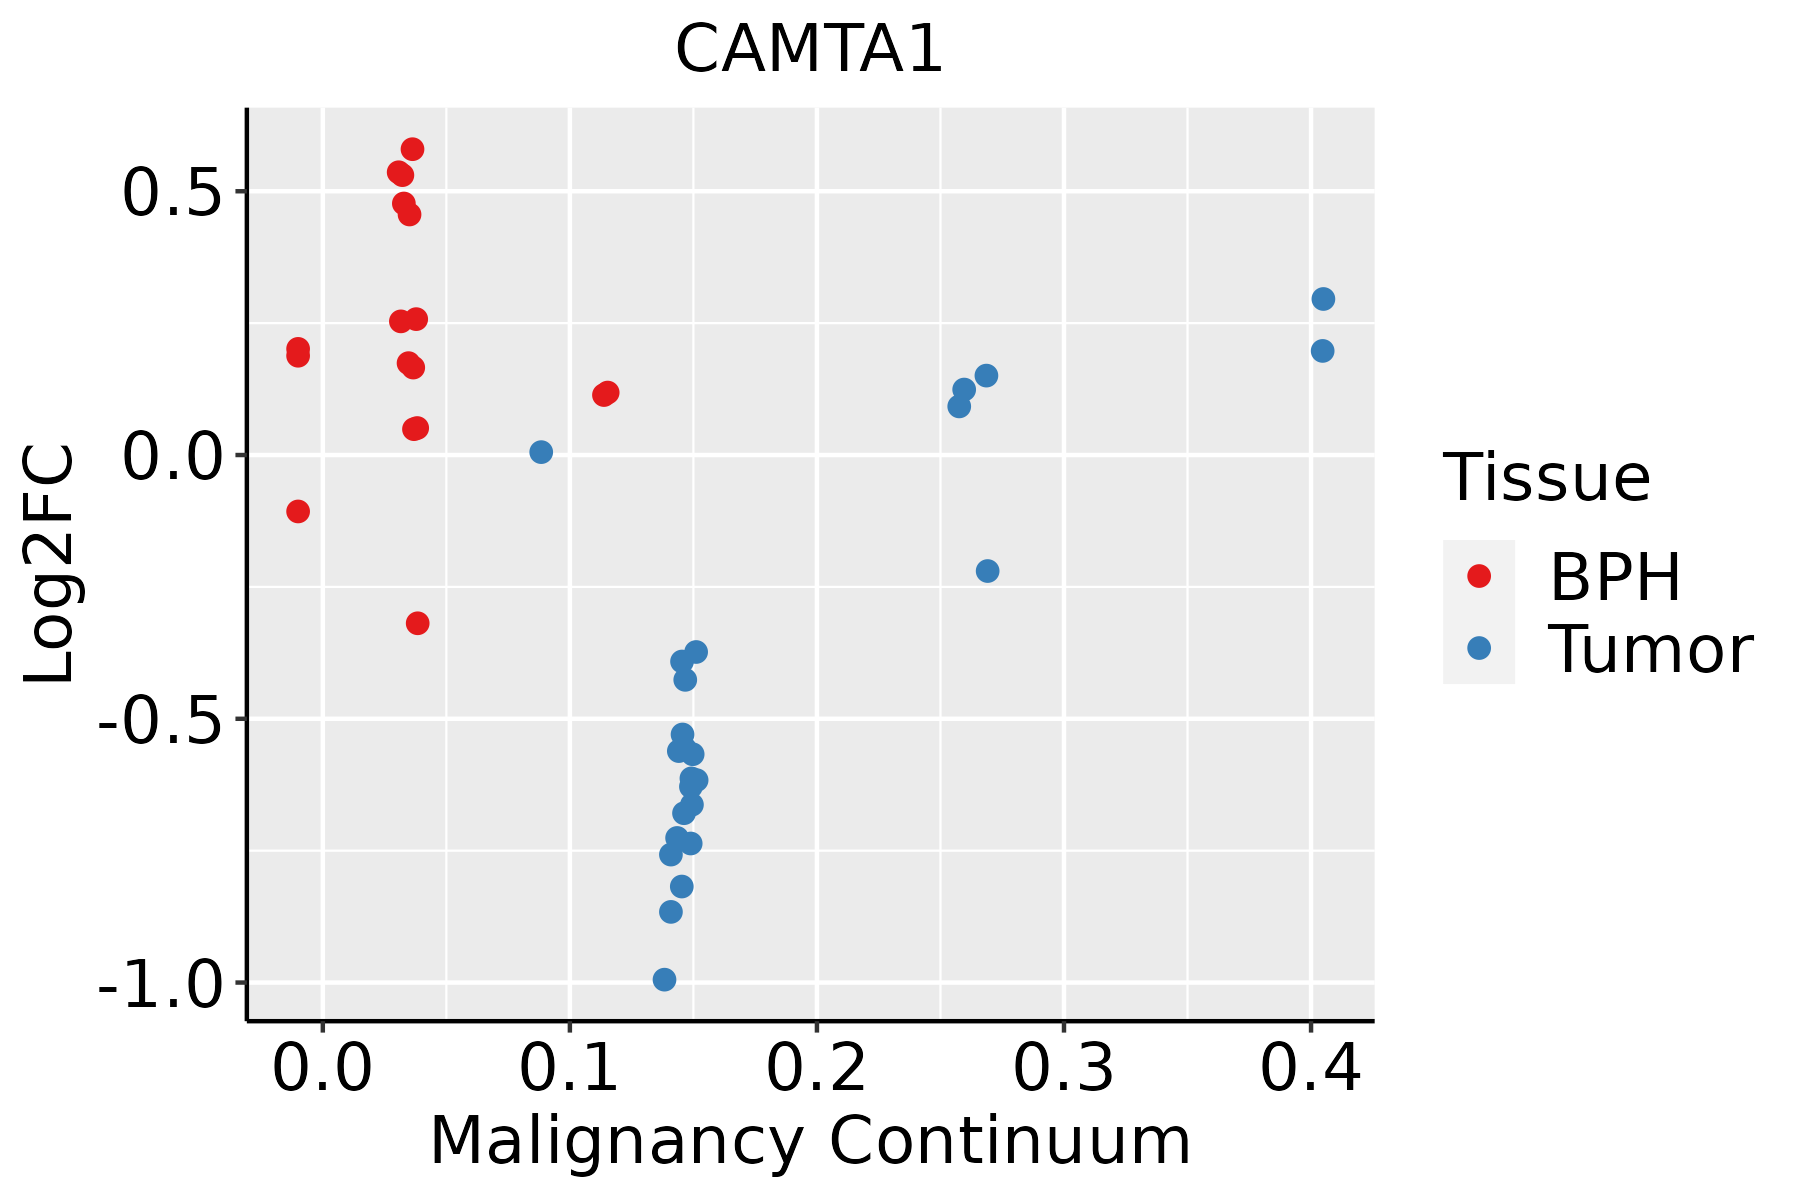
BPH: Benign Prostatic Hyperplasia
SkinThe image shows the transcriptomic changes along malignancy continuum.log2FC in expression of this searched gene in stem-like cells from each diseased tissue sample relative to stem-like cells in normal samples in each tissue plotted against the malignancy continuum. Samples are colored based on if they are from different disease stage.
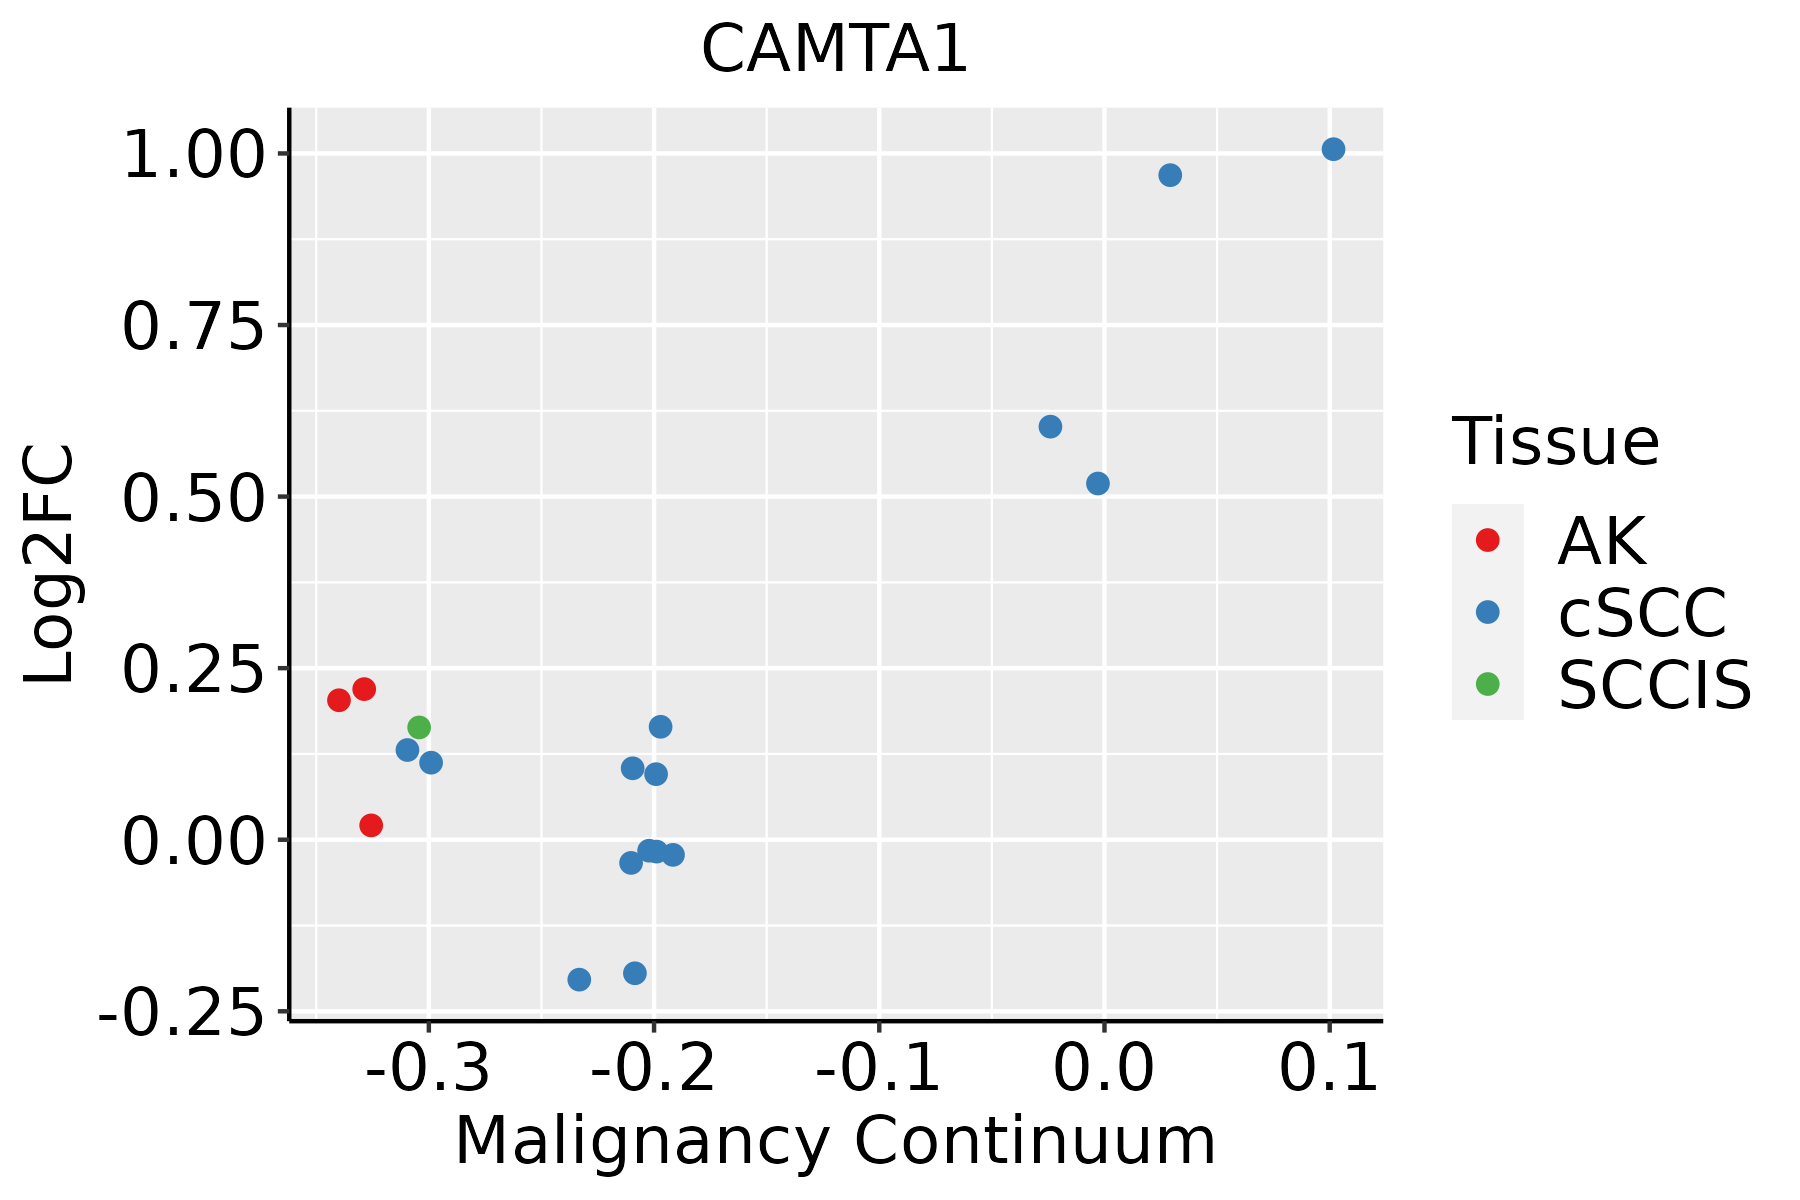
AK: Actinic keratosis
cSCC: Cutaneous squamous cell carcinoma
SCCIS:squamous cell carcinoma in situ
ThyroidThe image shows the transcriptomic changes along malignancy continuum.log2FC in expression of this searched gene in stem-like cells from each diseased tissue sample relative to stem-like cells in normal samples in each tissue plotted against the malignancy continuum. Samples are colored based on if they are from different disease stage.
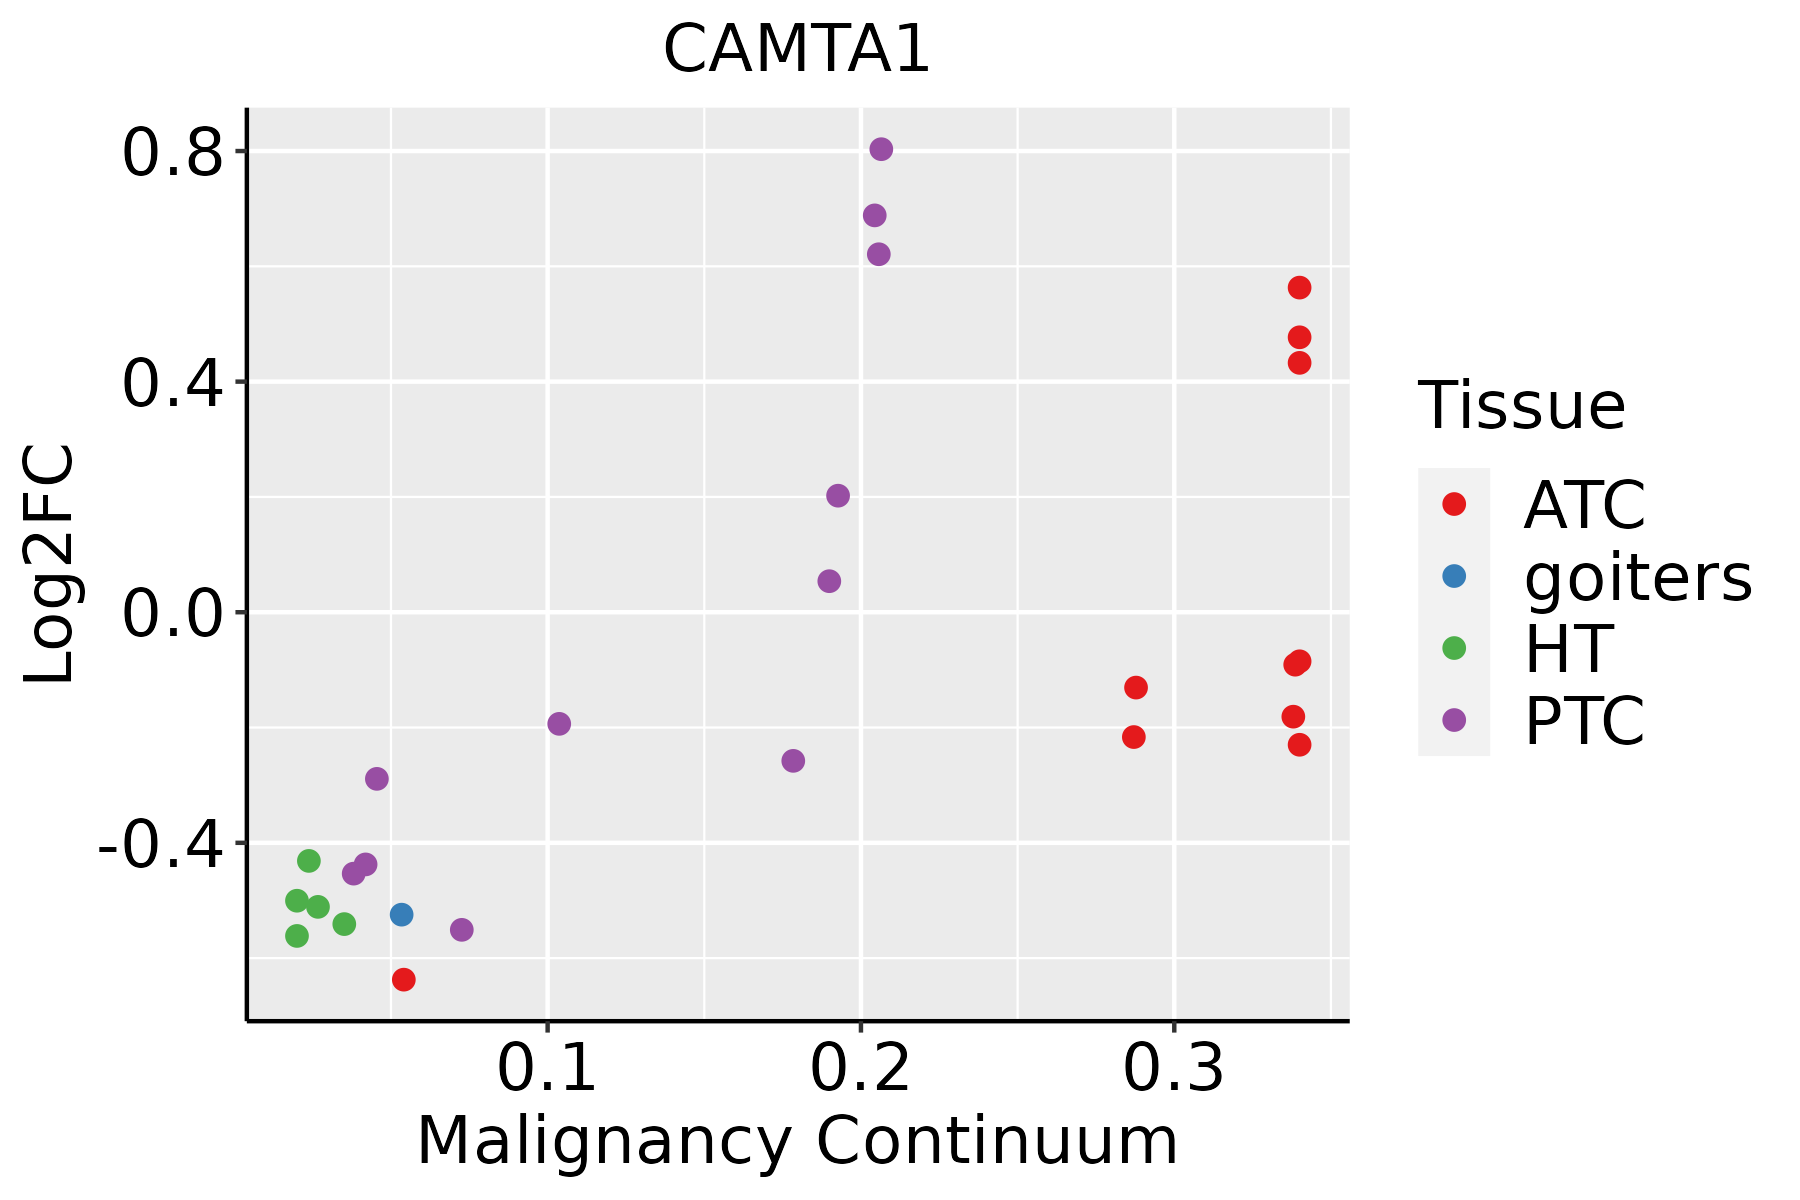
ATC: Anaplastic thyroid cancer
HT: Hashimoto's thyroiditis
PTC: Papillary thyroid cancer
∗log2FC in expression of this searched gene in stem-like cells from each diseased tissue sample relative to stem-like cells in normal samples in each tissue plotted against the malignancy continuum. Samples are colored based on if they are from different disease stage.

Top

Malignant transformation related pathway analysis

check buttonFind out the enriched GO biological processes and KEGG pathways involved in transition from healthy to precancer to cancer
check button Figure of enriched GO biological processes.
TissueDisease StageEnriched GO biological Processes
ColorectumADGO analysis - Figure of enriched GO biological processes: Top 15 enriched GO BP terms are showed in the bar plot of each disease state in each tissue. Each row represents a significant GO biological process which is colored according to the -log10(p.adjust).
ColorectumSERGO analysis - Figure of enriched GO biological processes: Top 15 enriched GO BP terms are showed in the bar plot of each disease state in each tissue. Each row represents a significant GO biological process which is colored according to the -log10(p.adjust).
ColorectumMSSGO analysis - Figure of enriched GO biological processes: Top 15 enriched GO BP terms are showed in the bar plot of each disease state in each tissue. Each row represents a significant GO biological process which is colored according to the -log10(p.adjust).
ColorectumMSI-HGO analysis - Figure of enriched GO biological processes: Top 15 enriched GO BP terms are showed in the bar plot of each disease state in each tissue. Each row represents a significant GO biological process which is colored according to the -log10(p.adjust).
ColorectumFAPGO analysis - Figure of enriched GO biological processes: Top 15 enriched GO BP terms are showed in the bar plot of each disease state in each tissue. Each row represents a significant GO biological process which is colored according to the -log10(p.adjust).
∗Top 15 enriched GO BP terms are showed in the bar plot of each disease state in each tissue. Each row represents a significant GO biological process which is colored according to the -log10(p.adjust).
Page: 1 2 3 4 5 6 7 8 9 

check button Enriched GO biological processes.
GO IDTissueDisease StageDescriptionGene RatioBg Ratiopvaluep.adjustCount
GO:00353049BreastPrecancerregulation of protein dephosphorylation14/108090/187236.16e-047.72e-0314
GO:003530414BreastIDCregulation of protein dephosphorylation18/143490/187231.39e-042.48e-0318
GO:003530423BreastDCISregulation of protein dephosphorylation18/139090/187239.33e-051.71e-0318
GO:00353039BreastDCISregulation of dephosphorylation18/1390128/187236.44e-034.58e-0218
GO:00508481BreastDCISregulation of calcium-mediated signaling12/139073/187237.17e-034.85e-0212
GO:0016311ColorectumADdephosphorylation123/3918417/187231.84e-053.82e-04123
GO:0006470ColorectumADprotein dephosphorylation88/3918281/187232.56e-054.89e-0488
GO:0035303ColorectumADregulation of dephosphorylation46/3918128/187236.20e-051.04e-0346
GO:0035304ColorectumADregulation of protein dephosphorylation33/391890/187234.23e-044.77e-0333
GO:0035306ColorectumADpositive regulation of dephosphorylation22/391859/187232.86e-032.14e-0222
GO:00353032ColorectumMSSregulation of dephosphorylation41/3467128/187231.64e-042.33e-0341
GO:00353042ColorectumMSSregulation of protein dephosphorylation30/346790/187235.58e-046.19e-0330
GO:00064702ColorectumMSSprotein dephosphorylation73/3467281/187231.15e-031.12e-0273
GO:00163112ColorectumMSSdephosphorylation101/3467417/187231.98e-031.70e-02101
GO:00163113ColorectumFAPdephosphorylation95/2622417/187237.07e-073.32e-0595
GO:00064704ColorectumFAPprotein dephosphorylation69/2622281/187231.47e-066.39e-0569
GO:00353034ColorectumFAPregulation of dephosphorylation36/2622128/187232.22e-055.28e-0436
GO:00353044ColorectumFAPregulation of protein dephosphorylation24/262290/187231.12e-031.08e-0224
GO:0048016ColorectumFAPinositol phosphate-mediated signaling16/262255/187232.78e-032.15e-0216
GO:00353061ColorectumFAPpositive regulation of dephosphorylation16/262259/187235.95e-033.75e-0216
Page: 1 2 3 4 5 6 

check button Enriched KEGG pathways.
Pathway IDTissueDisease StageDescriptionGene RatioBg Ratiopvaluep.adjustqvalueCount
Page: 1 

Top

Cell-cell communication analysis

check buttonIdentification of potential cell-cell interactions between two cell types and their ligand-receptor pairs for different disease states
LigandReceptorLRpairPathwayTissueDisease Stage
Page: 1 

Top

Single-cell gene regulatory network inference analysis

check buttonFind out the significant the regulons (TFs) and the target genes of each regulon across cell types for different disease states
TFCell TypeTissueDisease StageTarget GeneRSSRegulon Activity
∗The dot plots of a searched regulon are shown for all cell subpopulations in each disease state of each tissue based on the regulon specific score inferred using pySCENIC and by calculating the average expression.
Page: 1 

Top

Somatic mutation of malignant transformation related genes

check buttonAnnotation of somatic variants for genes involved in malignant transformation
Hugo SymbolVariant ClassVariant ClassificationdbSNP RSHGVScHGVSpHGVSp ShortSWISSPROTBIOTYPESIFTPolyPhenTumor Sample BarcodeTissueHistologySexAgeStageTherapy TypesDrugsOutcome
CAMTA1SNVMissense_Mutationc.4546N>Gp.Leu1516Valp.L1516VQ9Y6Y1protein_codingdeleterious(0)probably_damaging(0.984)TCGA-5L-AAT1-01Breastbreast invasive carcinomaFemale<65III/IVHormone TherapyletrozolSD
CAMTA1SNVMissense_Mutationc.2635N>Cp.Glu879Glnp.E879QQ9Y6Y1protein_codingdeleterious(0)probably_damaging(0.996)TCGA-A8-A0A7-01Breastbreast invasive carcinomaFemale<65I/IIUnknownUnknownSD
CAMTA1SNVMissense_Mutationnovelc.148A>Cp.Lys50Glnp.K50QQ9Y6Y1protein_codingdeleterious(0)probably_damaging(0.915)TCGA-AN-A046-01Breastbreast invasive carcinomaFemale>=65I/IIUnknownUnknownSD
CAMTA1SNVMissense_Mutationnovelc.1369N>Tp.Pro457Serp.P457SQ9Y6Y1protein_codingtolerated_low_confidence(0.35)benign(0.003)TCGA-B6-A3ZX-01Breastbreast invasive carcinomaFemale<65III/IVChemotherapycyclophosphamidePD
CAMTA1SNVMissense_Mutationc.860C>Gp.Ser287Trpp.S287WQ9Y6Y1protein_codingdeleterious(0)probably_damaging(0.996)TCGA-BH-A0HK-01Breastbreast invasive carcinomaFemale>=65I/IIHormone TherapyarimidexSD
CAMTA1SNVMissense_Mutationnovelc.4383C>Gp.Asn1461Lysp.N1461KQ9Y6Y1protein_codingtolerated(0.05)benign(0.025)TCGA-BH-A18V-01Breastbreast invasive carcinomaFemale<65I/IIUnknownUnknownSD
CAMTA1SNVMissense_Mutationc.3028N>Ap.Gly1010Serp.G1010SQ9Y6Y1protein_codingtolerated(0.4)benign(0.014)TCGA-C8-A12V-01Breastbreast invasive carcinomaFemale<65I/IIUnknownUnknownSD
CAMTA1SNVMissense_Mutationc.403G>Cp.Glu135Glnp.E135QQ9Y6Y1protein_codingdeleterious(0)probably_damaging(0.996)TCGA-C8-A26Y-01Breastbreast invasive carcinomaFemale>=65I/IIUnknownUnknownSD
CAMTA1SNVMissense_Mutationrs771378439c.1246G>Ap.Ala416Thrp.A416TQ9Y6Y1protein_codingtolerated_low_confidence(0.13)benign(0.001)TCGA-LL-A7T0-01Breastbreast invasive carcinomaFemale>=65I/IIUnknownUnknownSD
CAMTA1insertionFrame_Shift_Insnovelc.1291_1292insAGAAAAGAAAAACCATCAGAGTTATAATp.Leu431GlnfsTer17p.L431Qfs*17Q9Y6Y1protein_codingTCGA-A2-A0EQ-01Breastbreast invasive carcinomaFemale<65I/IIChemotherapyadriamycinSD
Page: 1 2 3 4 5 6 7 8 9 10 11 12 13 14 15 16 17 18 19 20 21 22 23 

Top

Related drugs of malignant transformation related genes

check buttonIdentification of chemicals and drugs interact with genes involved in malignant transfromation
(DGIdb 4.0)
Entrez IDSymbolCategoryInteraction TypesDrug Claim NameDrug NamePMIDs
Page: 1