
|
|||||
|
 | |
| |
| |
| |
| |
| |
|
Gene: C19orf24 |
Gene summary for C19ORF24 |
| Gene information | Species | Human | Gene symbol | C19orf24 | Gene ID | 55009 |
| Gene name | family with sequence similarity 174 member C | |
| Gene Alias | C19orf24 | |
| Cytomap | 19p13.3 | |
| Gene Type | protein-coding | GO ID | GO:0005575 | UniProtAcc | Q9BVV8 |
Top |
Malignant transformation analysis |
| Identification of the aberrant gene expression in precancerous and cancerous lesions by comparing the gene expression of stem-like cells in diseased tissues with normal stem cells |
| Entrez ID | Symbol | Replicates | Species | Organ | Tissue | Adj P-value | Log2FC | Malignancy |
| 55009 | C19orf24 | C57 | Human | Oral cavity | OSCC | 1.35e-23 | 9.47e-01 | 0.1679 |
| 55009 | C19orf24 | C06 | Human | Oral cavity | OSCC | 2.23e-16 | 1.99e+00 | 0.2699 |
| 55009 | C19orf24 | C07 | Human | Oral cavity | OSCC | 7.42e-13 | 2.04e+00 | 0.2491 |
| 55009 | C19orf24 | C08 | Human | Oral cavity | OSCC | 1.95e-86 | 1.59e+00 | 0.1919 |
| 55009 | C19orf24 | C09 | Human | Oral cavity | OSCC | 2.22e-20 | 7.27e-01 | 0.1431 |
| 55009 | C19orf24 | LN22 | Human | Oral cavity | OSCC | 5.02e-13 | 1.43e+00 | 0.1733 |
| 55009 | C19orf24 | LN38 | Human | Oral cavity | OSCC | 6.56e-14 | 1.79e+00 | 0.168 |
| 55009 | C19orf24 | LN46 | Human | Oral cavity | OSCC | 9.15e-22 | 1.05e+00 | 0.1666 |
| 55009 | C19orf24 | LP15 | Human | Oral cavity | LP | 2.54e-17 | 1.83e+00 | 0.2174 |
| 55009 | C19orf24 | LP17 | Human | Oral cavity | LP | 8.24e-15 | 1.63e+00 | 0.2349 |
| 55009 | C19orf24 | EOLP-1 | Human | Oral cavity | EOLP | 3.50e-02 | -1.36e-01 | -0.0202 |
| 55009 | C19orf24 | NEOLP-2 | Human | Oral cavity | NEOLP | 3.50e-02 | -1.36e-01 | -0.0196 |
| 55009 | C19orf24 | SYSMH1 | Human | Oral cavity | OSCC | 1.44e-51 | 1.14e+00 | 0.1127 |
| 55009 | C19orf24 | SYSMH2 | Human | Oral cavity | OSCC | 9.62e-44 | 1.34e+00 | 0.2326 |
| 55009 | C19orf24 | SYSMH3 | Human | Oral cavity | OSCC | 1.19e-45 | 1.42e+00 | 0.2442 |
| 55009 | C19orf24 | SYSMH4 | Human | Oral cavity | OSCC | 2.65e-15 | 3.75e-01 | 0.1226 |
| 55009 | C19orf24 | SYSMH5 | Human | Oral cavity | OSCC | 7.50e-18 | 5.58e-01 | 0.0647 |
| 55009 | C19orf24 | SYSMH6 | Human | Oral cavity | OSCC | 2.74e-19 | 6.29e-01 | 0.1275 |
| 55009 | C19orf24 | Dong_P1 | Human | Prostate | Tumor | 2.85e-79 | 6.64e-01 | 0.035 |
| 55009 | C19orf24 | Dong_P3 | Human | Prostate | Tumor | 1.25e-42 | 5.00e-01 | 0.0278 |
| Page: 1 2 3 4 5 6 7 |
| Tissue | Expression Dynamics | Abbreviation |
| Esophagus | 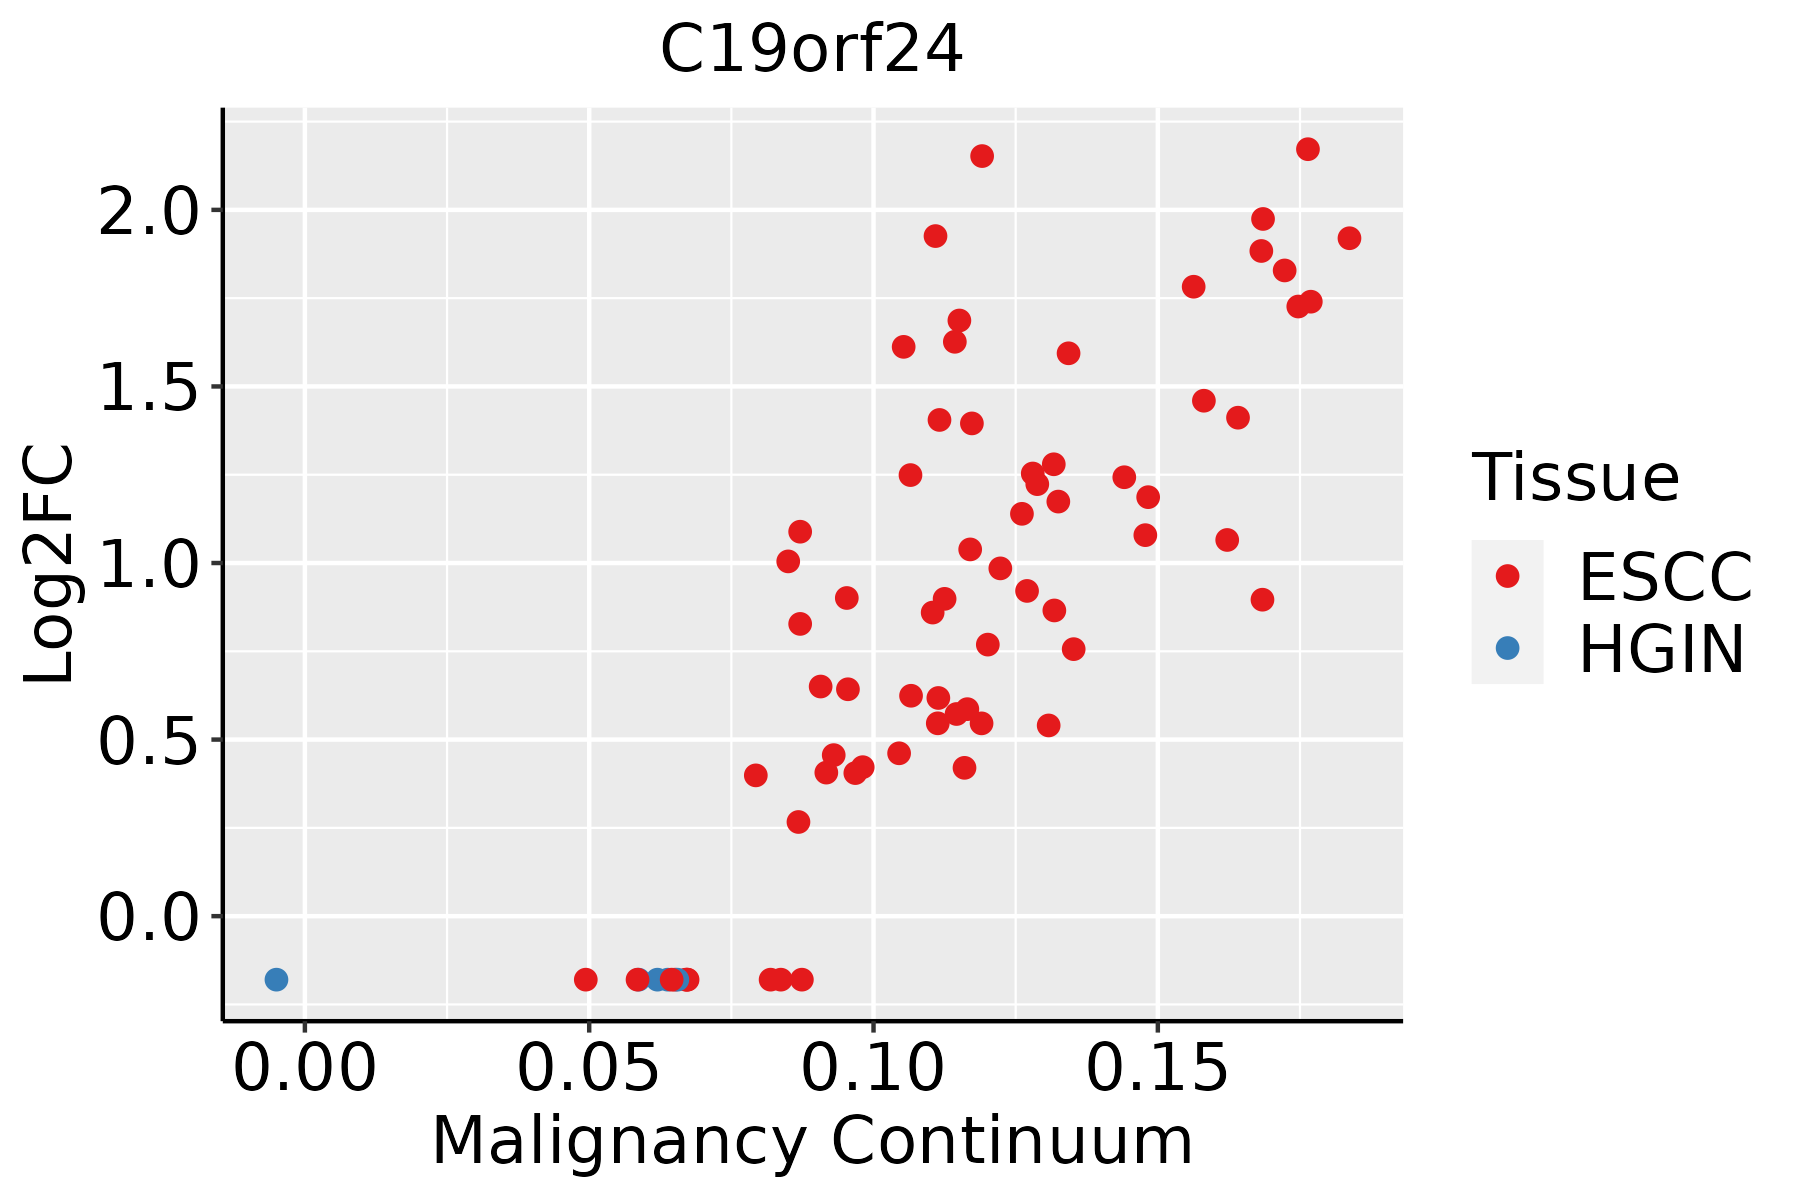 | ESCC: Esophageal squamous cell carcinoma |
| HGIN: High-grade intraepithelial neoplasias | ||
| LGIN: Low-grade intraepithelial neoplasias | ||
| Liver | 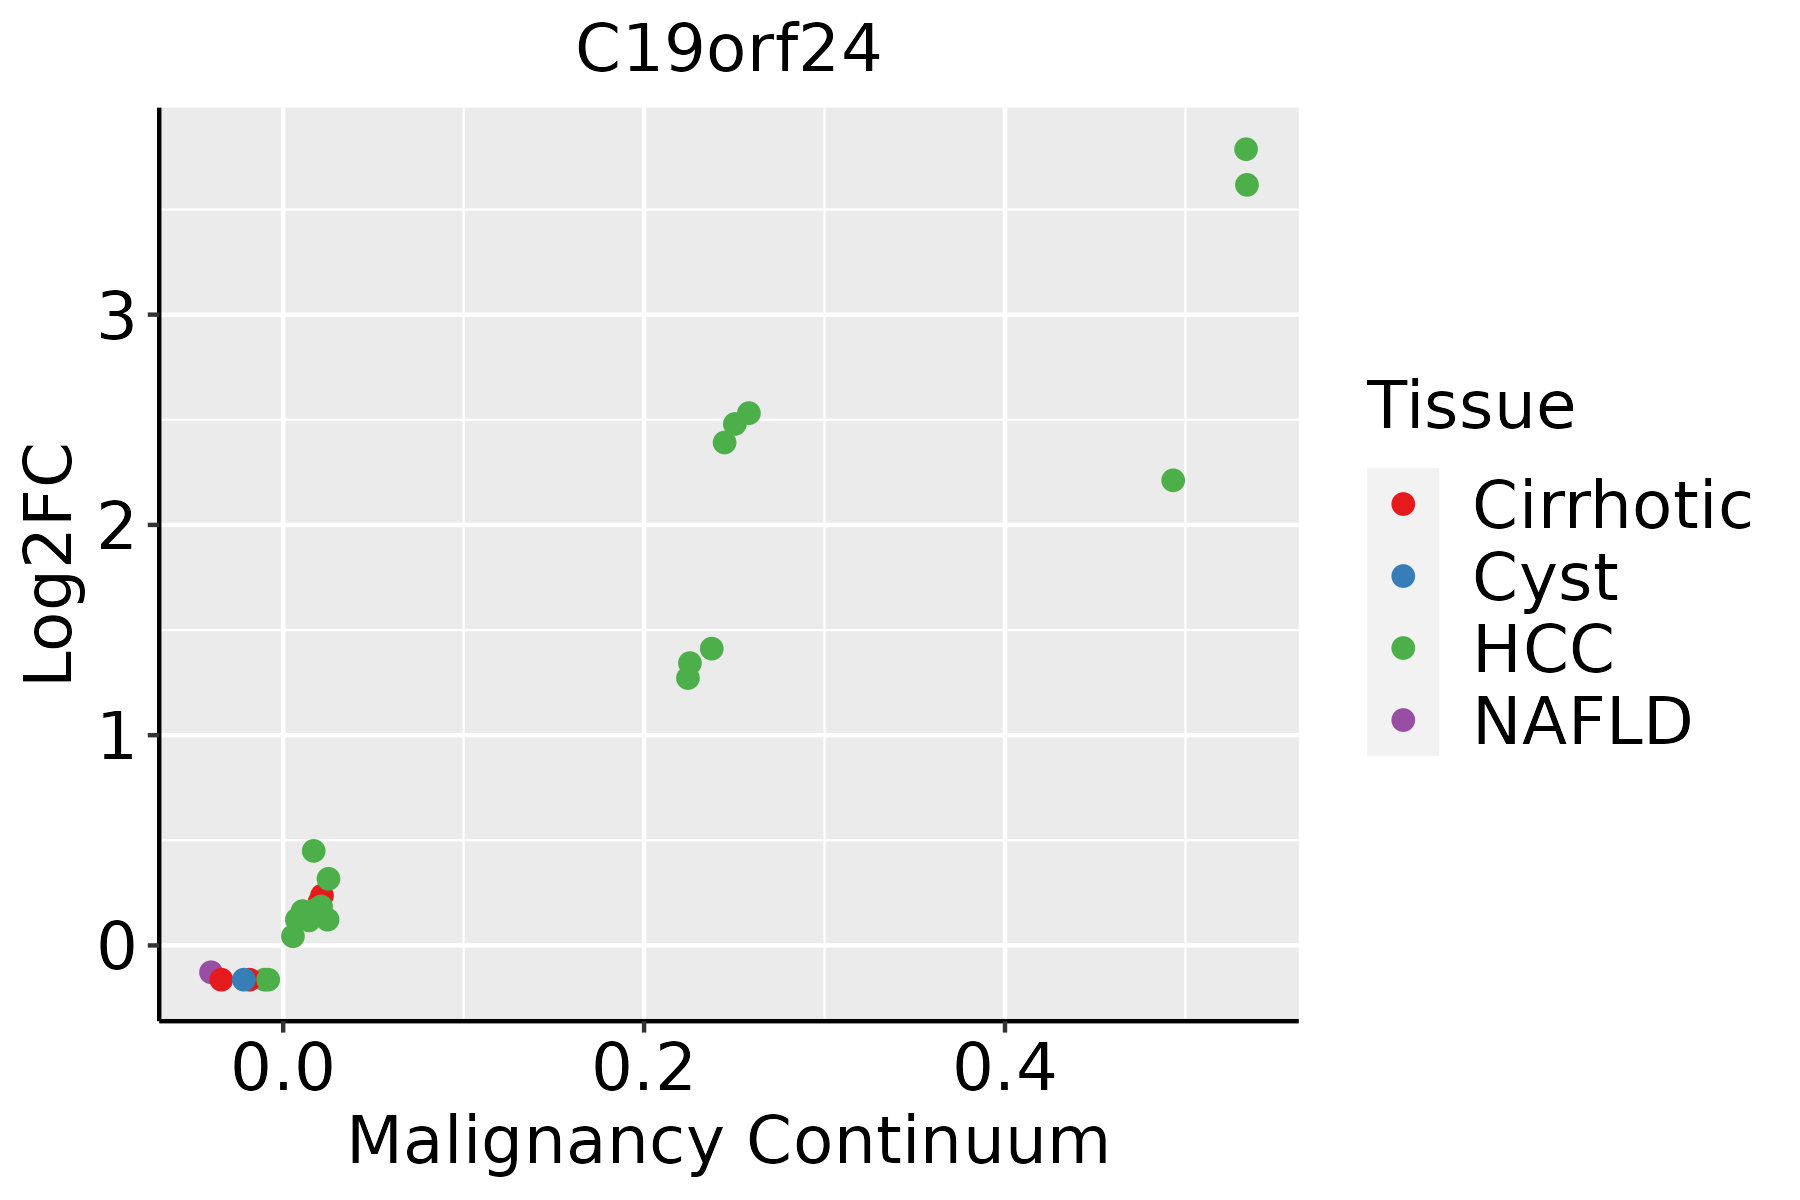 | HCC: Hepatocellular carcinoma |
| NAFLD: Non-alcoholic fatty liver disease | ||
| Oral Cavity |  | EOLP: Erosive Oral lichen planus |
| LP: leukoplakia | ||
| NEOLP: Non-erosive oral lichen planus | ||
| OSCC: Oral squamous cell carcinoma | ||
| Prostate | 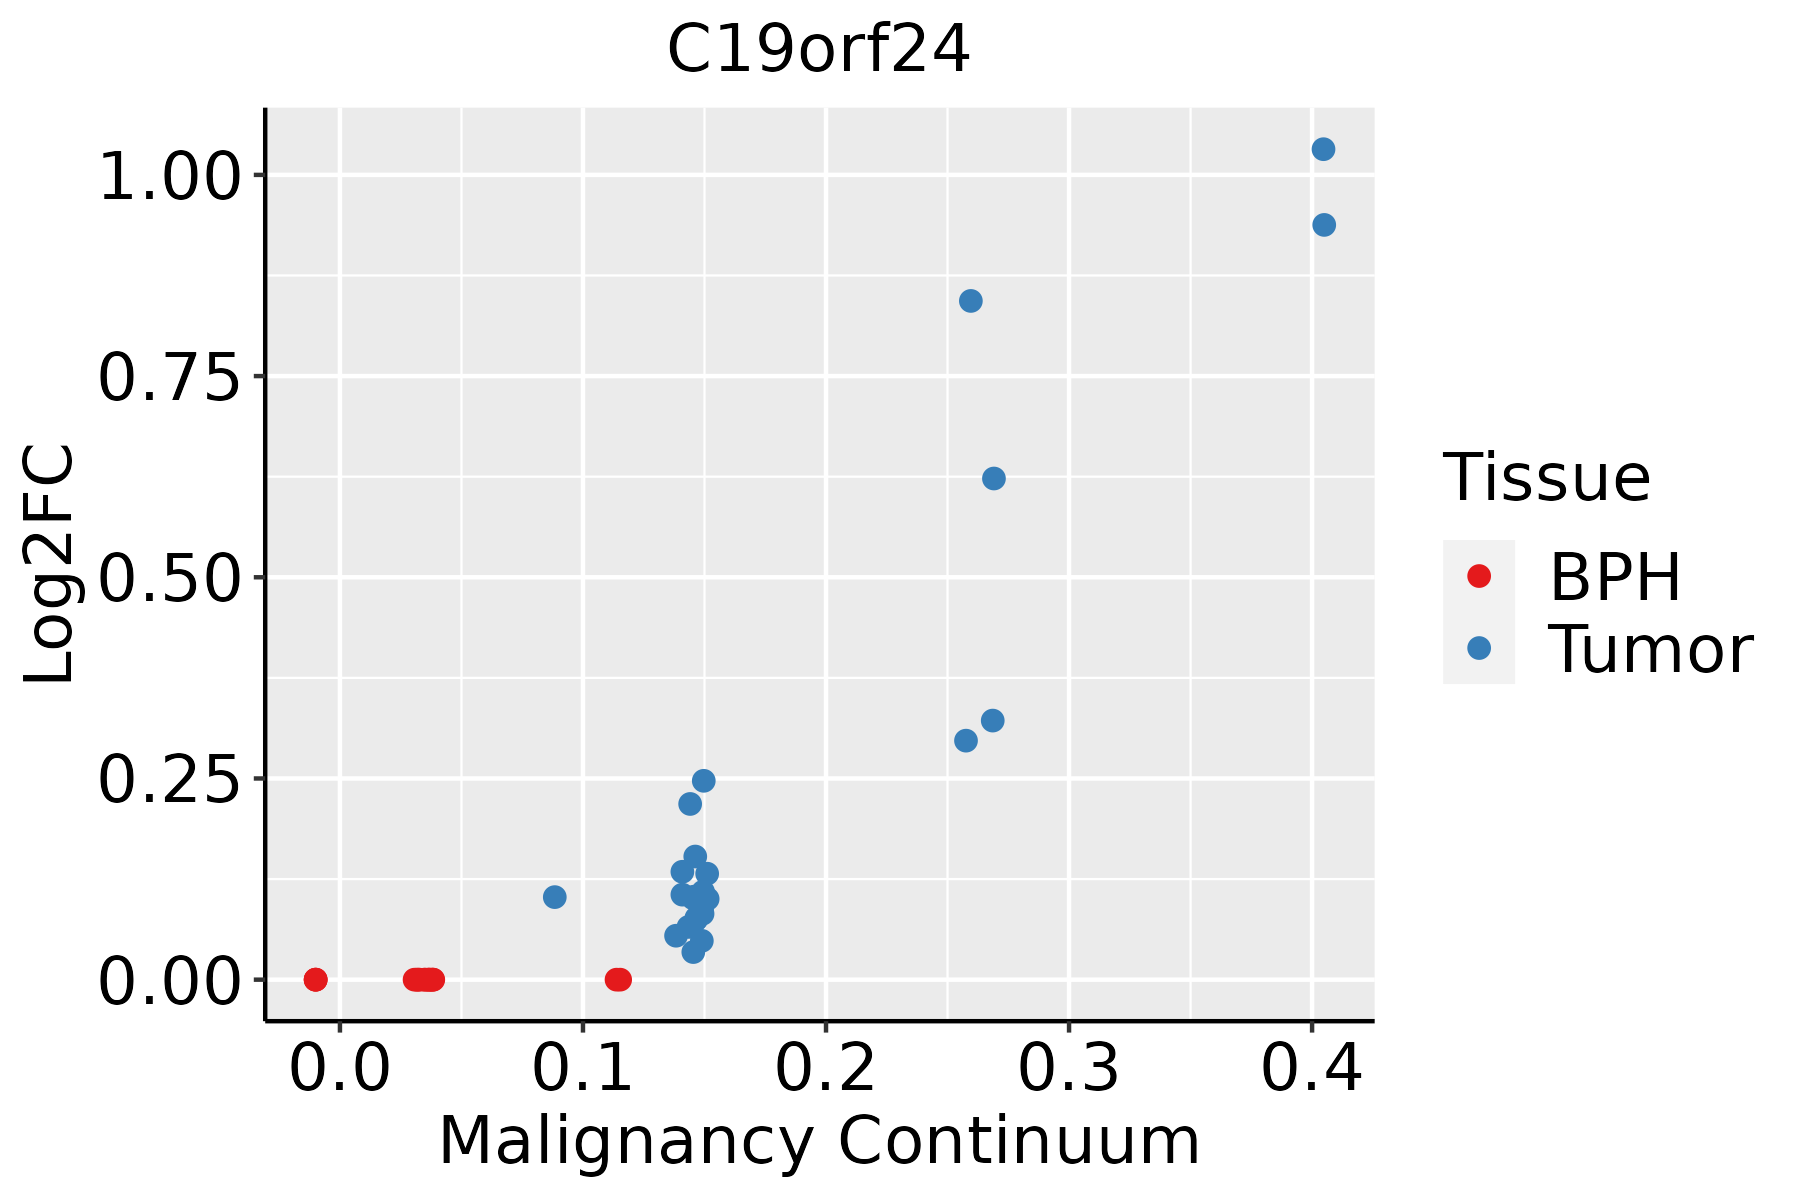 | BPH: Benign Prostatic Hyperplasia |
| Skin | 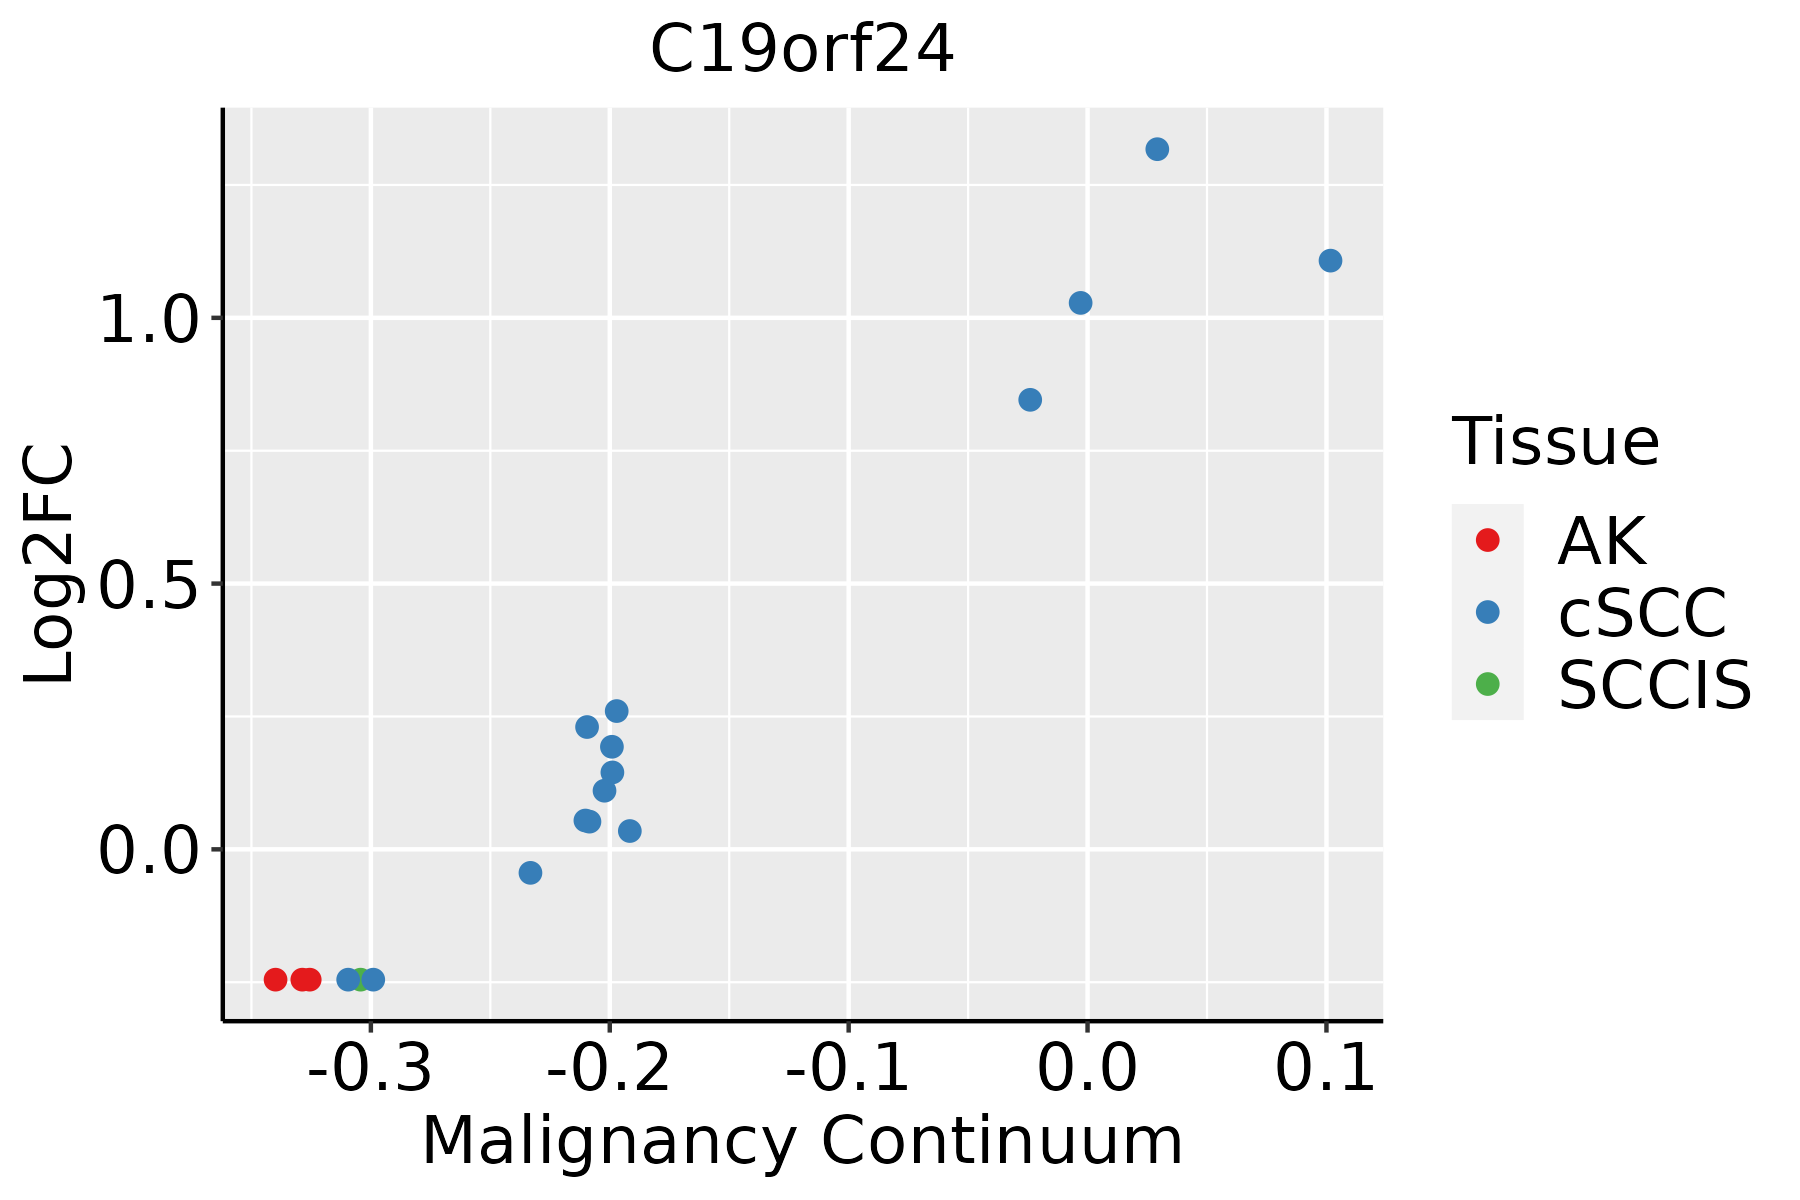 | AK: Actinic keratosis |
| cSCC: Cutaneous squamous cell carcinoma | ||
| SCCIS:squamous cell carcinoma in situ | ||
| Thyroid | 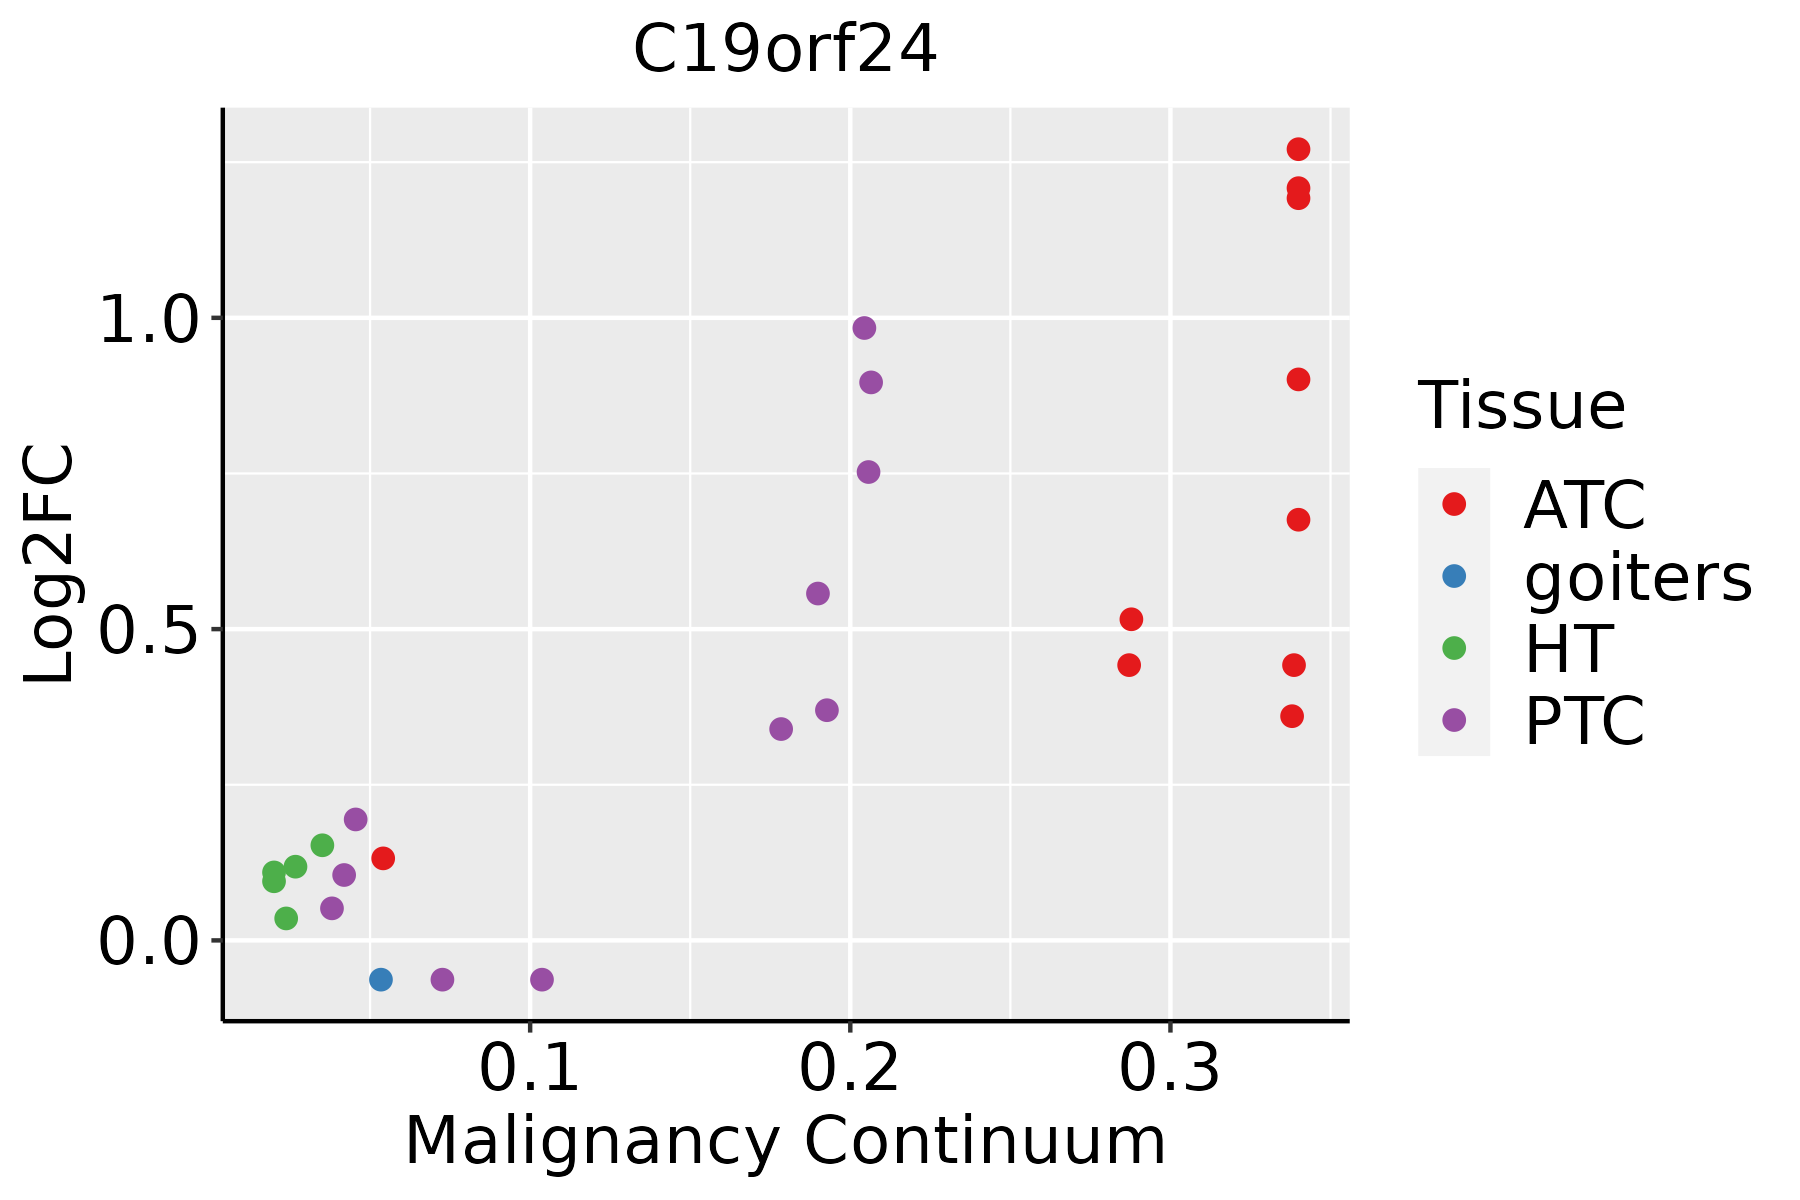 | ATC: Anaplastic thyroid cancer |
| HT: Hashimoto's thyroiditis | ||
| PTC: Papillary thyroid cancer |
| ∗log2FC in expression of this searched gene in stem-like cells from each diseased tissue sample relative to stem-like cells in normal samples in each tissue plotted against the malignancy continuum. Samples are colored based on if they are from different disease stage. |
Top |
Malignant transformation related pathway analysis |
| Find out the enriched GO biological processes and KEGG pathways involved in transition from healthy to precancer to cancer |
| Tissue | Disease Stage | Enriched GO biological Processes |
| Colorectum | AD |  |
| Colorectum | SER |  |
| Colorectum | MSS |  |
| Colorectum | MSI-H |  |
| Colorectum | FAP |  |
| ∗Top 15 enriched GO BP terms are showed in the bar plot of each disease state in each tissue. Each row represents a significant GO biological process which is colored according to the -log10(p.adjust). |
| Page: 1 2 3 4 5 6 7 8 9 |
| GO ID | Tissue | Disease Stage | Description | Gene Ratio | Bg Ratio | pvalue | p.adjust | Count |
| Page: 1 |
| Pathway ID | Tissue | Disease Stage | Description | Gene Ratio | Bg Ratio | pvalue | p.adjust | qvalue | Count |
| Page: 1 |
Top |
Cell-cell communication analysis |
| Identification of potential cell-cell interactions between two cell types and their ligand-receptor pairs for different disease states |
| Ligand | Receptor | LRpair | Pathway | Tissue | Disease Stage |
| Page: 1 |
Top |
Single-cell gene regulatory network inference analysis |
| Find out the significant the regulons (TFs) and the target genes of each regulon across cell types for different disease states |
| TF | Cell Type | Tissue | Disease Stage | Target Gene | RSS | Regulon Activity |
| ∗The dot plots of a searched regulon are shown for all cell subpopulations in each disease state of each tissue based on the regulon specific score inferred using pySCENIC and by calculating the average expression. |
| Page: 1 |
Top |
Somatic mutation of malignant transformation related genes |
| Annotation of somatic variants for genes involved in malignant transformation |
| Hugo Symbol | Variant Class | Variant Classification | dbSNP RS | HGVSc | HGVSp | HGVSp Short | SWISSPROT | BIOTYPE | SIFT | PolyPhen | Tumor Sample Barcode | Tissue | Histology | Sex | Age | Stage | Therapy Types | Drugs | Outcome |
| C19orf24 | SNV | Missense_Mutation | c.185C>A | p.Pro62Gln | p.P62Q | Q9BVV8 | protein_coding | tolerated(0.11) | possibly_damaging(0.574) | TCGA-4N-A93T-01 | Colorectum | colon adenocarcinoma | Male | >=65 | III/IV | Chemotherapy | xeloda | SD | |
| C19orf24 | deletion | In_Frame_Del | rs761097595 | c.219_221delNNN | p.Phe74del | p.F74del | Q9BVV8 | protein_coding | TCGA-A6-6780-01 | Colorectum | colon adenocarcinoma | Male | >=65 | I/II | Unknown | Unknown | SD | ||
| C19orf24 | SNV | Missense_Mutation | novel | c.305N>A | p.Arg102Gln | p.R102Q | Q9BVV8 | protein_coding | deleterious(0.01) | benign(0.416) | TCGA-AP-A1DV-01 | Endometrium | uterine corpus endometrioid carcinoma | Female | <65 | I/II | Unknown | Unknown | SD |
| C19orf24 | SNV | Missense_Mutation | novel | c.361N>A | p.Asp121Asn | p.D121N | Q9BVV8 | protein_coding | deleterious(0.04) | benign(0.2) | TCGA-AP-A1E0-01 | Endometrium | uterine corpus endometrioid carcinoma | Female | <65 | III/IV | Chemotherapy | paclitaxel | SD |
| C19orf24 | deletion | In_Frame_Del | novel | c.244_246delGGC | p.Gly82del | p.G82del | Q9BVV8 | protein_coding | TCGA-G3-A3CK-01 | Liver | liver hepatocellular carcinoma | Male | <65 | I/II | Unknown | Unknown | SD |
| Page: 1 |
Top |
Related drugs of malignant transformation related genes |
| Identification of chemicals and drugs interact with genes involved in malignant transfromation |
| (DGIdb 4.0) |
| Entrez ID | Symbol | Category | Interaction Types | Drug Claim Name | Drug Name | PMIDs |
| Page: 1 |

Copyright 2023-Present -The University of Texas Health Science Center at Houston |