
|
|||||
|
 | |
| |
| |
| |
| |
| |
|
Gene: C17orf49 |
Gene summary for C17ORF49 |
| Gene information | Species | Human | Gene symbol | C17orf49 | Gene ID | 124944 |
| Gene name | chromosome 17 open reading frame 49 | |
| Gene Alias | BAP18 | |
| Cytomap | 17p13.1 | |
| Gene Type | protein-coding | GO ID | GO:0006325 | UniProtAcc | Q8IXM2 |
Top |
Malignant transformation analysis |
| Identification of the aberrant gene expression in precancerous and cancerous lesions by comparing the gene expression of stem-like cells in diseased tissues with normal stem cells |
| Entrez ID | Symbol | Replicates | Species | Organ | Tissue | Adj P-value | Log2FC | Malignancy |
| 124944 | C17orf49 | C09 | Human | Oral cavity | OSCC | 1.77e-02 | 1.03e-01 | 0.1431 |
| 124944 | C17orf49 | EOLP-1 | Human | Oral cavity | EOLP | 8.55e-06 | 2.86e-01 | -0.0202 |
| 124944 | C17orf49 | EOLP-2 | Human | Oral cavity | EOLP | 1.14e-04 | 3.06e-01 | -0.0203 |
| 124944 | C17orf49 | NEOLP-3 | Human | Oral cavity | NEOLP | 8.25e-04 | 1.75e-01 | -0.0191 |
| 124944 | C17orf49 | SYSMH2 | Human | Oral cavity | OSCC | 2.72e-03 | 1.25e-01 | 0.2326 |
| 124944 | C17orf49 | Pat01-B | Human | Stomach | GC | 3.23e-05 | 1.67e-01 | 0.5754 |
| 124944 | C17orf49 | Pat02-B | Human | Stomach | GC | 8.35e-30 | 4.00e-01 | 0.0368 |
| 124944 | C17orf49 | Pat03-B | Human | Stomach | GC | 5.77e-09 | 2.19e-01 | 0.3693 |
| 124944 | C17orf49 | Pat04-B | Human | Stomach | GC | 1.15e-15 | 3.32e-01 | -0.1483 |
| 124944 | C17orf49 | Pat05-B | Human | Stomach | GC | 1.84e-08 | 2.73e-01 | -0.0353 |
| 124944 | C17orf49 | Pat06-B | Human | Stomach | GC | 4.01e-20 | 3.47e-01 | -0.1961 |
| 124944 | C17orf49 | Pat07-B | Human | Stomach | GC | 5.16e-06 | 2.69e-01 | 0.0935 |
| 124944 | C17orf49 | Pat08-B | Human | Stomach | GC | 2.79e-05 | 3.17e-01 | 0.0182 |
| 124944 | C17orf49 | Pat09-B | Human | Stomach | GC | 6.25e-15 | 3.50e-01 | -0.0359 |
| 124944 | C17orf49 | Pat10-B | Human | Stomach | GC | 1.17e-03 | 2.40e-01 | 0.084 |
| 124944 | C17orf49 | Pat11-B | Human | Stomach | GC | 1.13e-15 | 3.77e-01 | -0.182 |
| 124944 | C17orf49 | Pat12-B | Human | Stomach | GC | 2.55e-23 | 4.07e-01 | 0.0325 |
| 124944 | C17orf49 | Pat13-B | Human | Stomach | GC | 6.98e-06 | 2.08e-01 | 0.0555 |
| 124944 | C17orf49 | Pat15-B | Human | Stomach | GC | 4.04e-14 | 3.04e-01 | -0.0778 |
| 124944 | C17orf49 | Pat16-B | Human | Stomach | GC | 3.73e-12 | 2.51e-01 | 0.1918 |
| Page: 1 2 3 4 5 6 |
| Tissue | Expression Dynamics | Abbreviation |
| Esophagus | 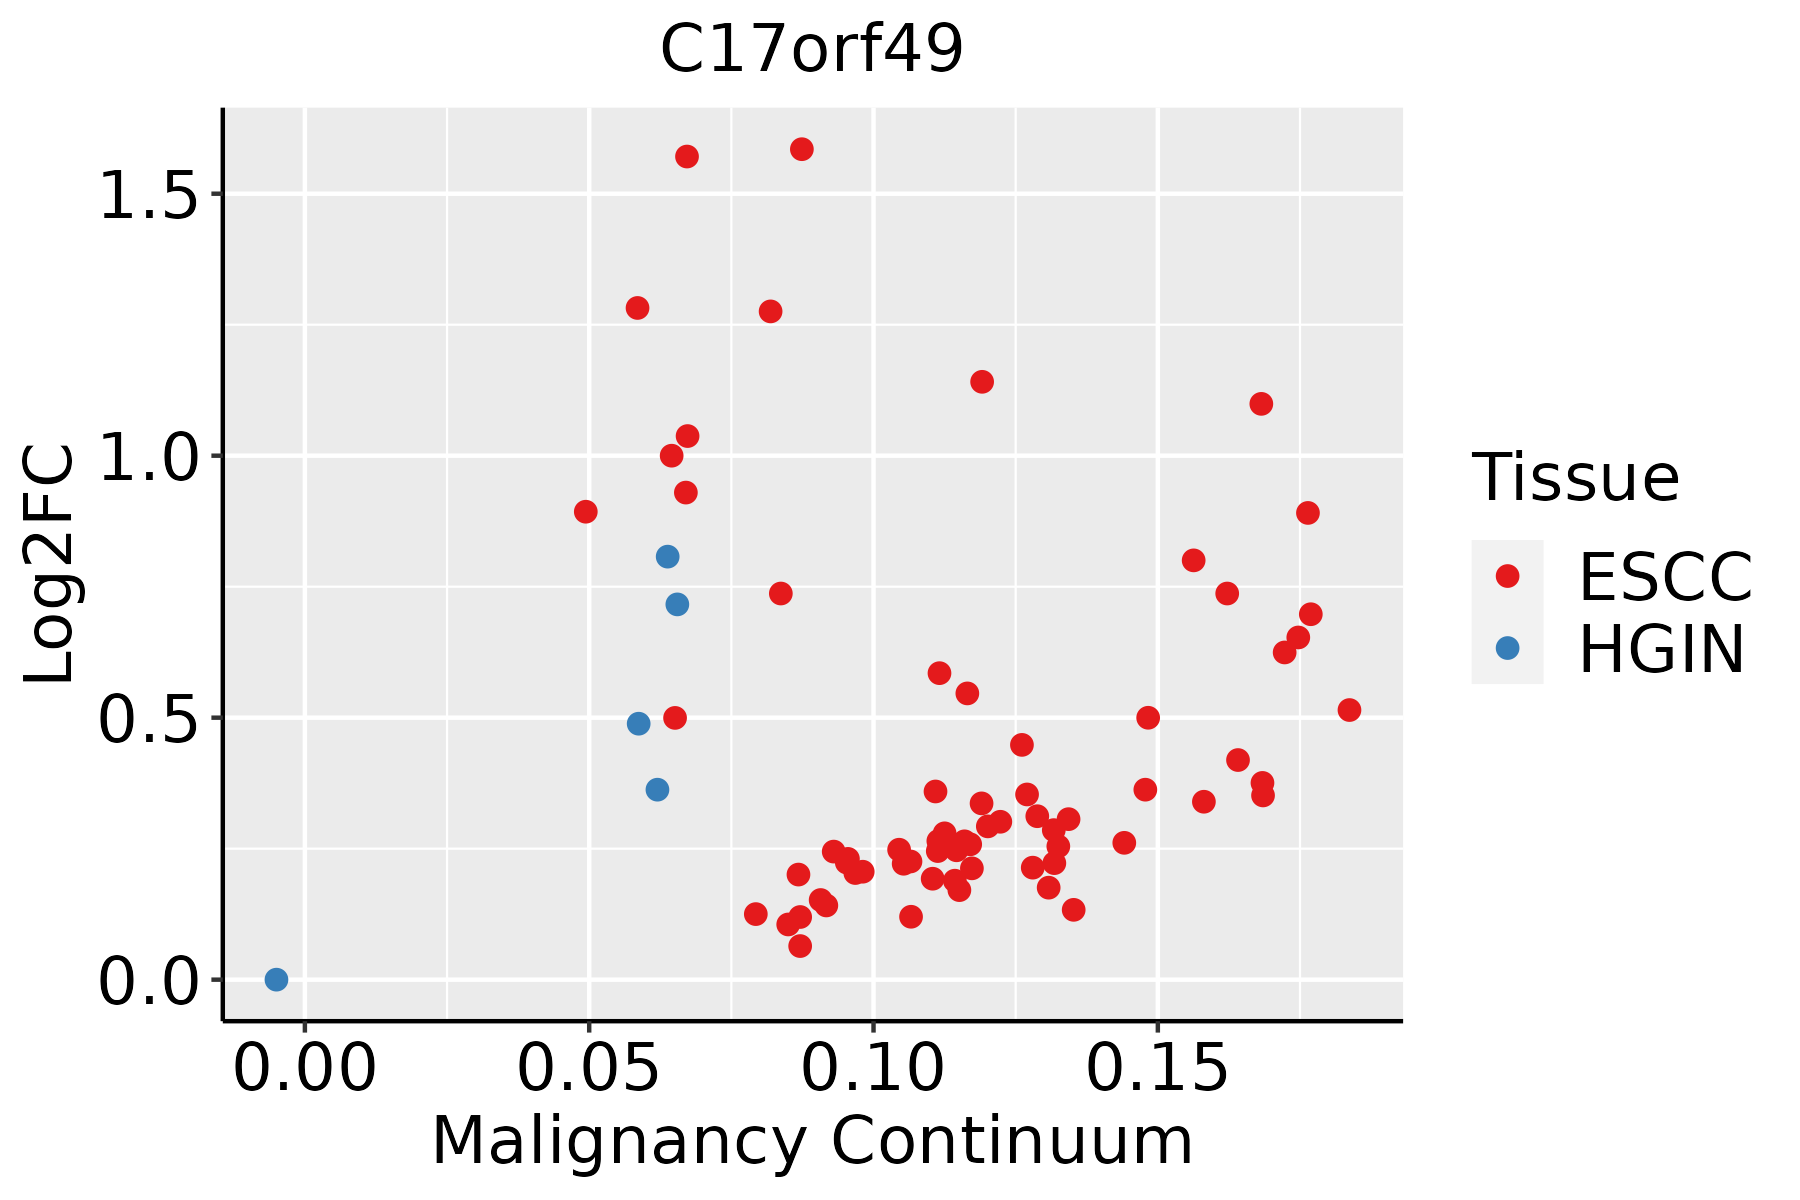 | ESCC: Esophageal squamous cell carcinoma |
| HGIN: High-grade intraepithelial neoplasias | ||
| LGIN: Low-grade intraepithelial neoplasias | ||
| GC | 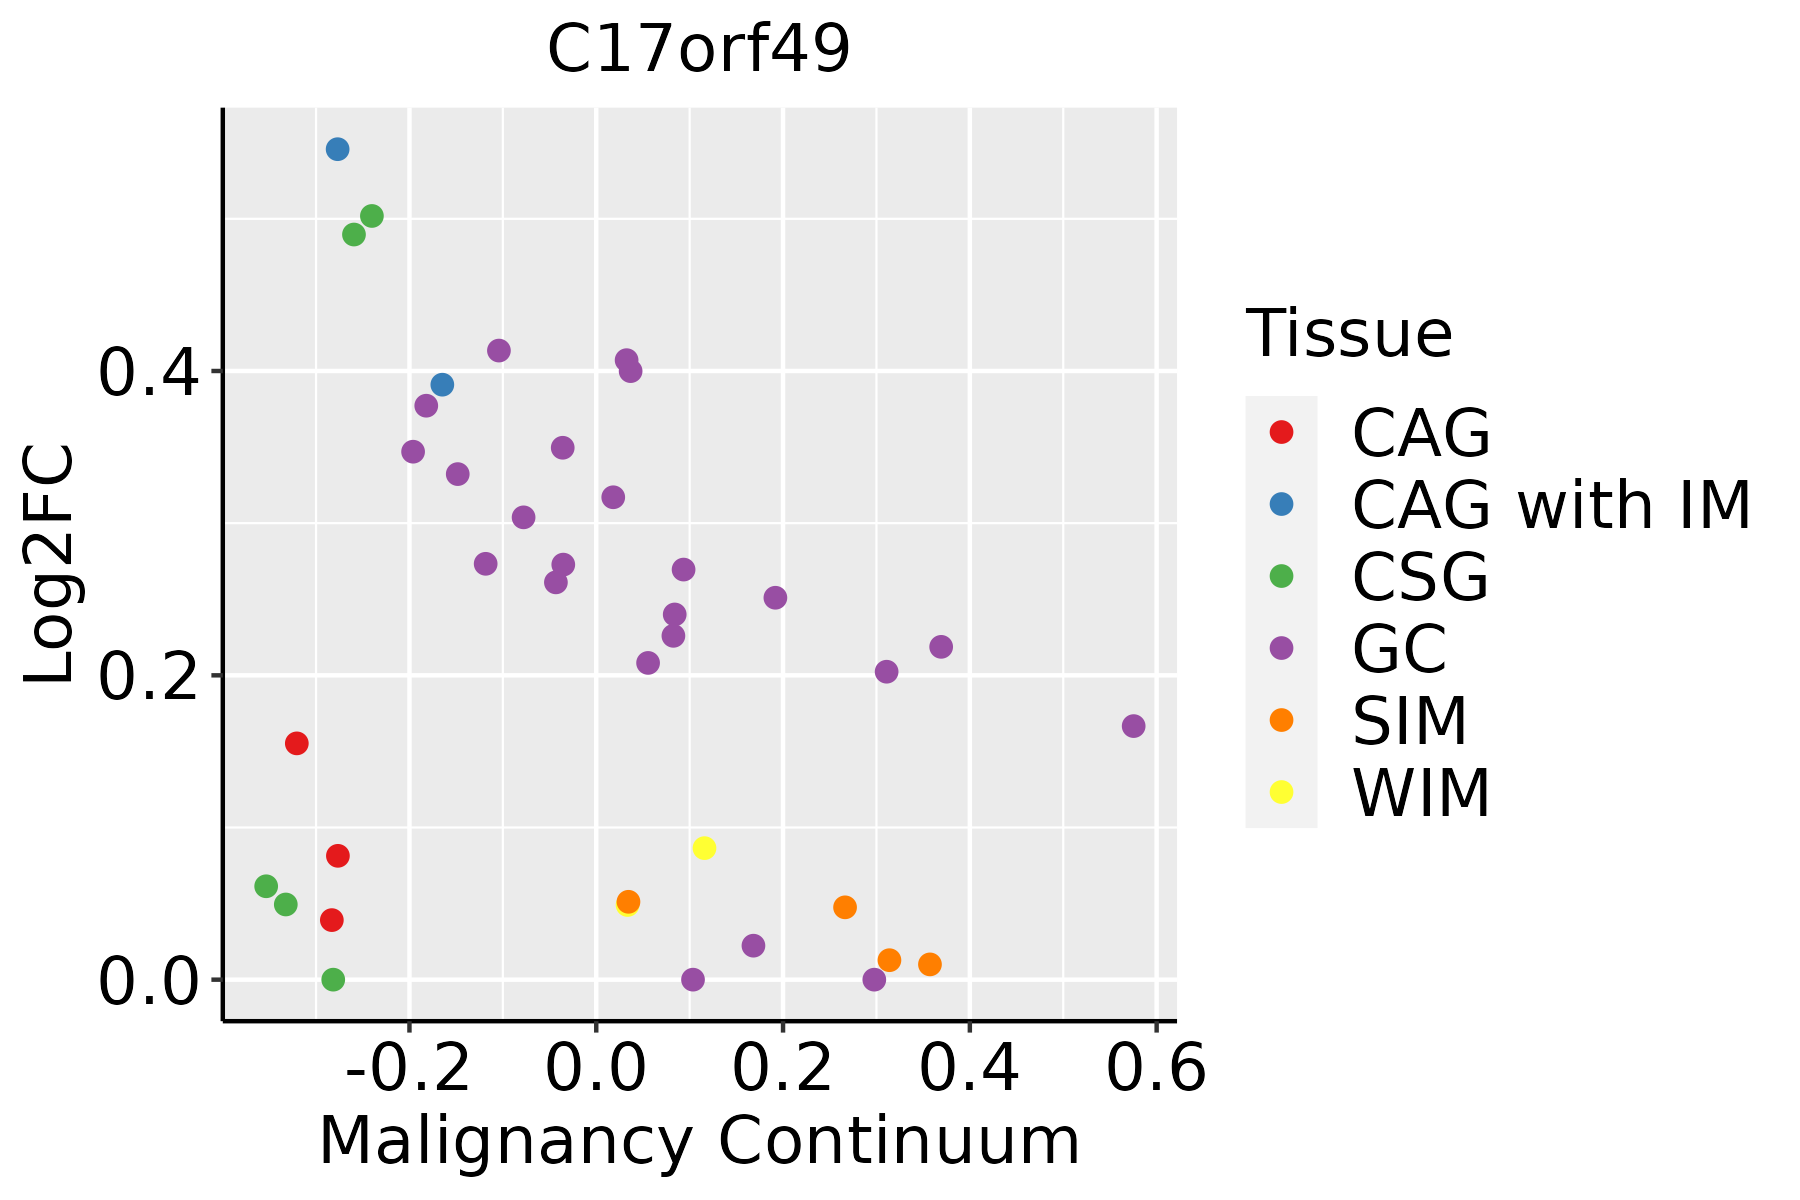 | CAG: Chronic atrophic gastritis |
| CAG with IM: Chronic atrophic gastritis with intestinal metaplasia | ||
| CSG: Chronic superficial gastritis | ||
| GC: Gastric cancer | ||
| SIM: Severe intestinal metaplasia | ||
| WIM: Wild intestinal metaplasia | ||
| Liver | 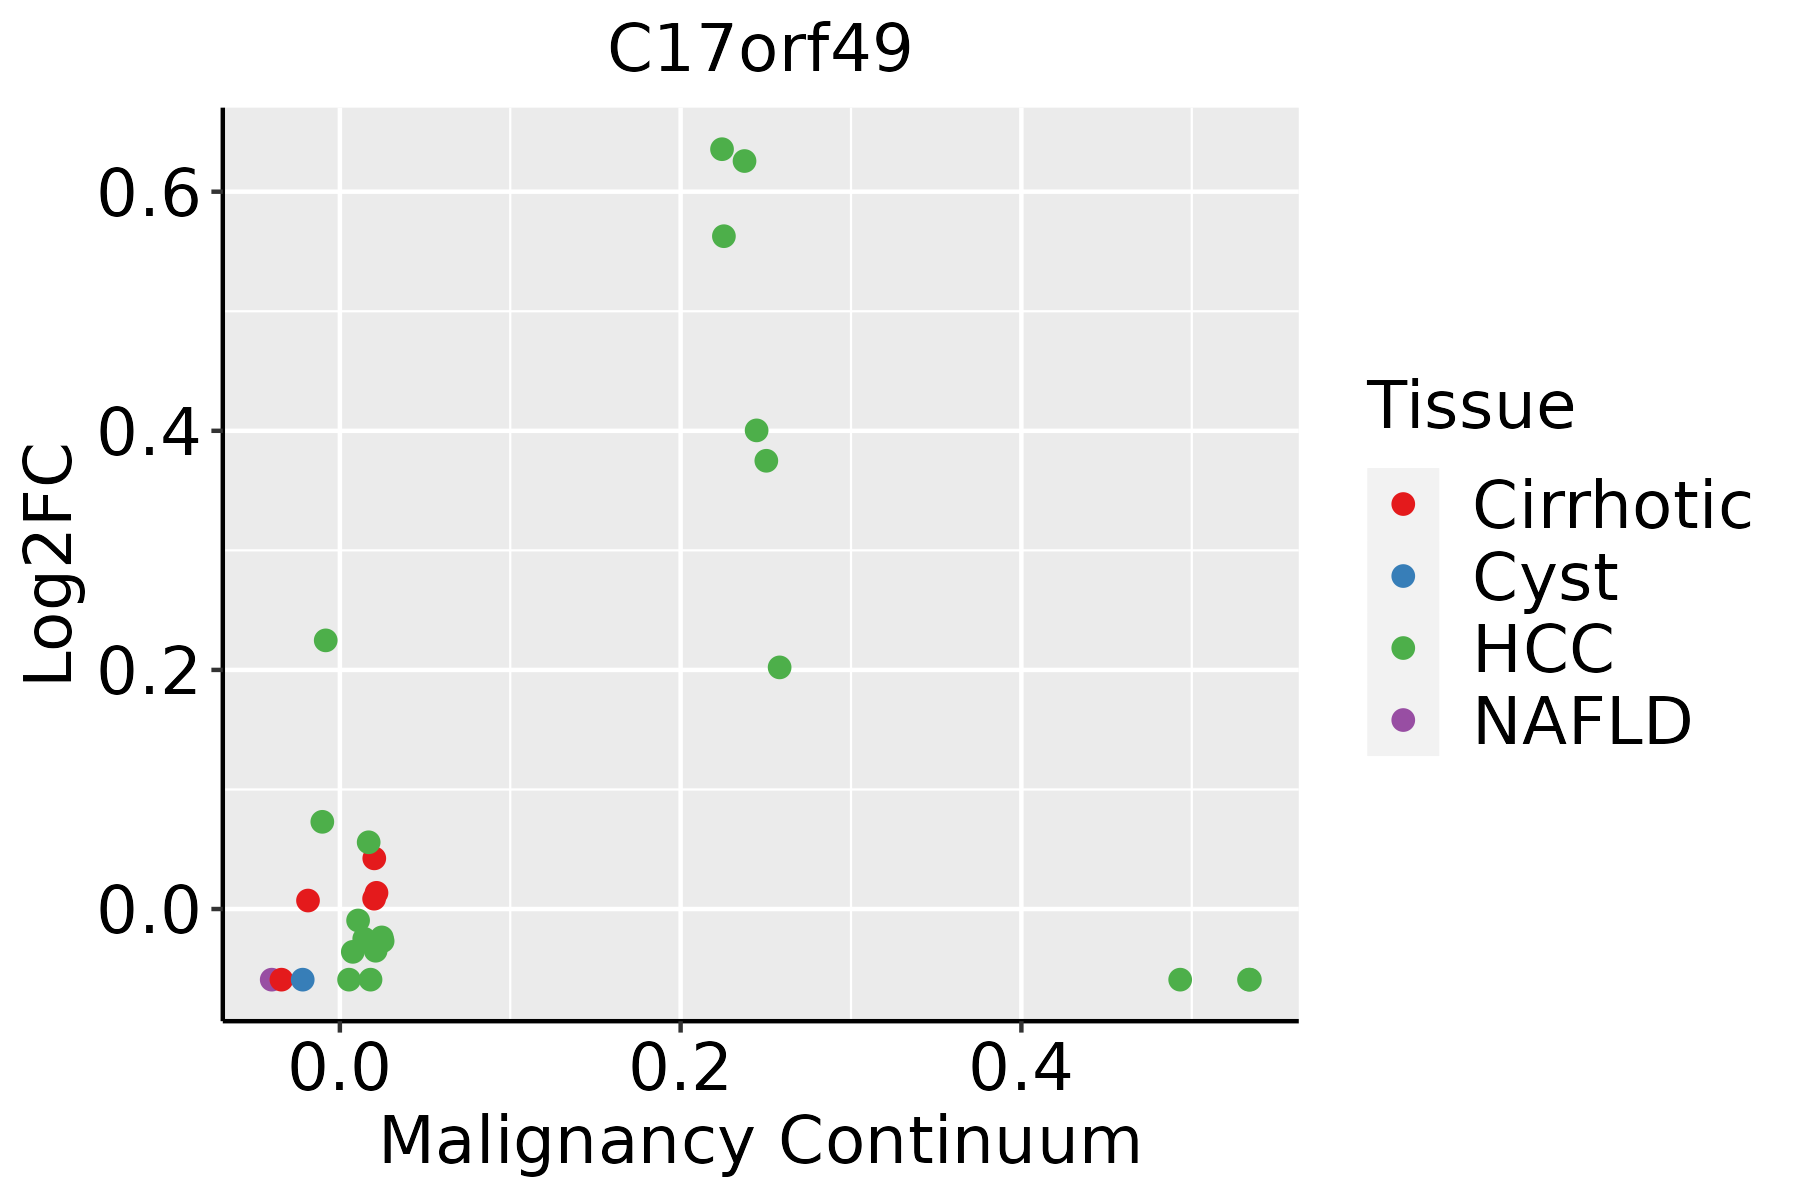 | HCC: Hepatocellular carcinoma |
| NAFLD: Non-alcoholic fatty liver disease | ||
| Oral Cavity |  | EOLP: Erosive Oral lichen planus |
| LP: leukoplakia | ||
| NEOLP: Non-erosive oral lichen planus | ||
| OSCC: Oral squamous cell carcinoma |
| ∗log2FC in expression of this searched gene in stem-like cells from each diseased tissue sample relative to stem-like cells in normal samples in each tissue plotted against the malignancy continuum. Samples are colored based on if they are from different disease stage. |
Top |
Malignant transformation related pathway analysis |
| Find out the enriched GO biological processes and KEGG pathways involved in transition from healthy to precancer to cancer |
| Tissue | Disease Stage | Enriched GO biological Processes |
| Colorectum | AD |  |
| Colorectum | SER |  |
| Colorectum | MSS |  |
| Colorectum | MSI-H |  |
| Colorectum | FAP |  |
| ∗Top 15 enriched GO BP terms are showed in the bar plot of each disease state in each tissue. Each row represents a significant GO biological process which is colored according to the -log10(p.adjust). |
| Page: 1 2 3 4 5 6 7 8 9 |
| GO ID | Tissue | Disease Stage | Description | Gene Ratio | Bg Ratio | pvalue | p.adjust | Count |
| GO:000632516 | Esophagus | HGIN | chromatin organization | 92/2587 | 409/18723 | 1.05e-06 | 4.16e-05 | 92 |
| GO:000632517 | Esophagus | ESCC | chromatin organization | 240/8552 | 409/18723 | 6.52e-08 | 1.14e-06 | 240 |
| GO:000632511 | Liver | HCC | chromatin organization | 206/7958 | 409/18723 | 7.23e-04 | 4.41e-03 | 206 |
| GO:000632510 | Oral cavity | OSCC | chromatin organization | 190/7305 | 409/18723 | 1.17e-03 | 5.97e-03 | 190 |
| GO:000632515 | Oral cavity | EOLP | chromatin organization | 84/2218 | 409/18723 | 2.68e-07 | 8.16e-06 | 84 |
| GO:000632521 | Oral cavity | NEOLP | chromatin organization | 70/2005 | 409/18723 | 4.97e-05 | 6.83e-04 | 70 |
| Page: 1 |
| Pathway ID | Tissue | Disease Stage | Description | Gene Ratio | Bg Ratio | pvalue | p.adjust | qvalue | Count |
| Page: 1 |
Top |
Cell-cell communication analysis |
| Identification of potential cell-cell interactions between two cell types and their ligand-receptor pairs for different disease states |
| Ligand | Receptor | LRpair | Pathway | Tissue | Disease Stage |
| Page: 1 |
Top |
Single-cell gene regulatory network inference analysis |
| Find out the significant the regulons (TFs) and the target genes of each regulon across cell types for different disease states |
| TF | Cell Type | Tissue | Disease Stage | Target Gene | RSS | Regulon Activity |
| ∗The dot plots of a searched regulon are shown for all cell subpopulations in each disease state of each tissue based on the regulon specific score inferred using pySCENIC and by calculating the average expression. |
| Page: 1 |
Top |
Somatic mutation of malignant transformation related genes |
| Annotation of somatic variants for genes involved in malignant transformation |
| Hugo Symbol | Variant Class | Variant Classification | dbSNP RS | HGVSc | HGVSp | HGVSp Short | SWISSPROT | BIOTYPE | SIFT | PolyPhen | Tumor Sample Barcode | Tissue | Histology | Sex | Age | Stage | Therapy Types | Drugs | Outcome |
| C17orf49 | SNV | Missense_Mutation | c.466N>C | p.Glu156Gln | p.E156Q | Q8IXM2 | protein_coding | deleterious(0.03) | possibly_damaging(0.701) | TCGA-AC-A23H-01 | Breast | breast invasive carcinoma | Female | >=65 | I/II | Unknown | Unknown | PD | |
| C17orf49 | SNV | Missense_Mutation | c.134N>T | p.Thr45Met | p.T45M | Q8IXM2 | protein_coding | deleterious(0.02) | probably_damaging(0.997) | TCGA-AD-5900-01 | Colorectum | colon adenocarcinoma | Male | >=65 | I/II | Unknown | Unknown | SD | |
| C17orf49 | SNV | Missense_Mutation | novel | c.262N>G | p.Ser88Ala | p.S88A | Q8IXM2 | protein_coding | tolerated(1) | benign(0.047) | TCGA-AZ-4315-01 | Colorectum | colon adenocarcinoma | Male | <65 | I/II | Unknown | Unknown | SD |
| C17orf49 | SNV | Missense_Mutation | novel | c.215N>T | p.Thr72Ile | p.T72I | Q8IXM2 | protein_coding | deleterious(0) | probably_damaging(0.996) | TCGA-A5-A0G2-01 | Endometrium | uterine corpus endometrioid carcinoma | Female | <65 | III/IV | Unknown | Unknown | SD |
| C17orf49 | SNV | Missense_Mutation | novel | c.341N>T | p.Ala114Val | p.A114V | Q8IXM2 | protein_coding | tolerated(0.43) | benign(0.003) | TCGA-A5-A0G2-01 | Endometrium | uterine corpus endometrioid carcinoma | Female | <65 | III/IV | Unknown | Unknown | SD |
| C17orf49 | SNV | Missense_Mutation | novel | c.360N>A | p.Ser120Arg | p.S120R | Q8IXM2 | protein_coding | deleterious(0.04) | benign(0.219) | TCGA-A5-A1OF-01 | Endometrium | uterine corpus endometrioid carcinoma | Female | <65 | I/II | Unknown | Unknown | SD |
| C17orf49 | SNV | Missense_Mutation | c.119N>T | p.Ala40Val | p.A40V | Q8IXM2 | protein_coding | deleterious(0.02) | probably_damaging(0.994) | TCGA-AX-A2HD-01 | Endometrium | uterine corpus endometrioid carcinoma | Female | >=65 | III/IV | Unknown | Unknown | SD | |
| C17orf49 | SNV | Missense_Mutation | rs201799608 | c.244N>T | p.Arg82Cys | p.R82C | Q8IXM2 | protein_coding | deleterious(0) | probably_damaging(0.989) | TCGA-AX-A2HD-01 | Endometrium | uterine corpus endometrioid carcinoma | Female | >=65 | III/IV | Unknown | Unknown | SD |
| C17orf49 | SNV | Missense_Mutation | c.478N>A | p.Glu160Lys | p.E160K | Q8IXM2 | protein_coding | deleterious(0.01) | possibly_damaging(0.636) | TCGA-B5-A11E-01 | Endometrium | uterine corpus endometrioid carcinoma | Female | <65 | I/II | Unknown | Unknown | SD | |
| C17orf49 | SNV | Missense_Mutation | rs764031582 | c.544N>G | p.Met182Val | p.M182V | Q8IXM2 | protein_coding | tolerated_low_confidence(0.12) | benign(0) | TCGA-BG-A0M4-01 | Endometrium | uterine corpus endometrioid carcinoma | Female | <65 | I/II | Chemotherapy | carboplatin | SD |
| Page: 1 2 |
Top |
Related drugs of malignant transformation related genes |
| Identification of chemicals and drugs interact with genes involved in malignant transfromation |
| (DGIdb 4.0) |
| Entrez ID | Symbol | Category | Interaction Types | Drug Claim Name | Drug Name | PMIDs |
| Page: 1 |

Copyright 2023-Present -The University of Texas Health Science Center at Houston |