
|
|||||
|
 | |
| |
| |
| |
| |
| |
|
Gene: BTF3L4 |
Gene summary for BTF3L4 |
| Gene information | Species | Human | Gene symbol | BTF3L4 | Gene ID | 91408 |
| Gene name | basic transcription factor 3 like 4 | |
| Gene Alias | BTF3L4 | |
| Cytomap | 1p32.3 | |
| Gene Type | protein-coding | GO ID | GO:0003674 | UniProtAcc | Q96K17 |
Top |
Malignant transformation analysis |
| Identification of the aberrant gene expression in precancerous and cancerous lesions by comparing the gene expression of stem-like cells in diseased tissues with normal stem cells |
| Entrez ID | Symbol | Replicates | Species | Organ | Tissue | Adj P-value | Log2FC | Malignancy |
| 91408 | BTF3L4 | P83T-E | Human | Esophagus | ESCC | 2.65e-49 | 1.56e+00 | 0.1738 |
| 91408 | BTF3L4 | P84T-E | Human | Esophagus | ESCC | 1.54e-16 | 1.07e+00 | 0.0933 |
| 91408 | BTF3L4 | P89T-E | Human | Esophagus | ESCC | 1.36e-24 | 1.57e+00 | 0.1752 |
| 91408 | BTF3L4 | P91T-E | Human | Esophagus | ESCC | 5.81e-22 | 2.39e+00 | 0.1828 |
| 91408 | BTF3L4 | P104T-E | Human | Esophagus | ESCC | 2.00e-02 | 6.38e-01 | 0.0931 |
| 91408 | BTF3L4 | P107T-E | Human | Esophagus | ESCC | 1.86e-77 | 2.04e+00 | 0.171 |
| 91408 | BTF3L4 | P126T-E | Human | Esophagus | ESCC | 4.75e-13 | 1.65e+00 | 0.1125 |
| 91408 | BTF3L4 | P127T-E | Human | Esophagus | ESCC | 3.69e-62 | 1.11e+00 | 0.0826 |
| 91408 | BTF3L4 | P128T-E | Human | Esophagus | ESCC | 2.14e-54 | 2.26e+00 | 0.1241 |
| 91408 | BTF3L4 | P130T-E | Human | Esophagus | ESCC | 2.62e-84 | 2.06e+00 | 0.1676 |
| 91408 | BTF3L4 | S43 | Human | Liver | Cirrhotic | 1.56e-13 | -3.71e-01 | -0.0187 |
| 91408 | BTF3L4 | HCC1_Meng | Human | Liver | HCC | 9.34e-64 | 3.60e-01 | 0.0246 |
| 91408 | BTF3L4 | HCC2_Meng | Human | Liver | HCC | 1.04e-34 | 6.90e-02 | 0.0107 |
| 91408 | BTF3L4 | cirrhotic2 | Human | Liver | Cirrhotic | 5.22e-04 | 6.54e-02 | 0.0201 |
| 91408 | BTF3L4 | cirrhotic3 | Human | Liver | Cirrhotic | 1.53e-04 | -5.22e-03 | 0.0215 |
| 91408 | BTF3L4 | HCC1 | Human | Liver | HCC | 5.51e-03 | 1.53e+00 | 0.5336 |
| 91408 | BTF3L4 | HCC2 | Human | Liver | HCC | 3.71e-06 | 3.36e+00 | 0.5341 |
| 91408 | BTF3L4 | Pt13.b | Human | Liver | HCC | 9.53e-14 | 5.65e-02 | 0.0251 |
| 91408 | BTF3L4 | Pt14.b | Human | Liver | HCC | 5.69e-03 | 6.63e-02 | 0.018 |
| 91408 | BTF3L4 | S014 | Human | Liver | HCC | 8.95e-23 | 1.34e+00 | 0.2254 |
| Page: 1 2 3 4 5 6 7 8 |
| Tissue | Expression Dynamics | Abbreviation |
| Breast |  | IDC: Invasive ductal carcinoma |
| DCIS: Ductal carcinoma in situ | ||
| Precancer(BRCA1-mut): Precancerous lesion from BRCA1 mutation carriers | ||
| Esophagus |  | ESCC: Esophageal squamous cell carcinoma |
| HGIN: High-grade intraepithelial neoplasias | ||
| LGIN: Low-grade intraepithelial neoplasias | ||
| Liver | 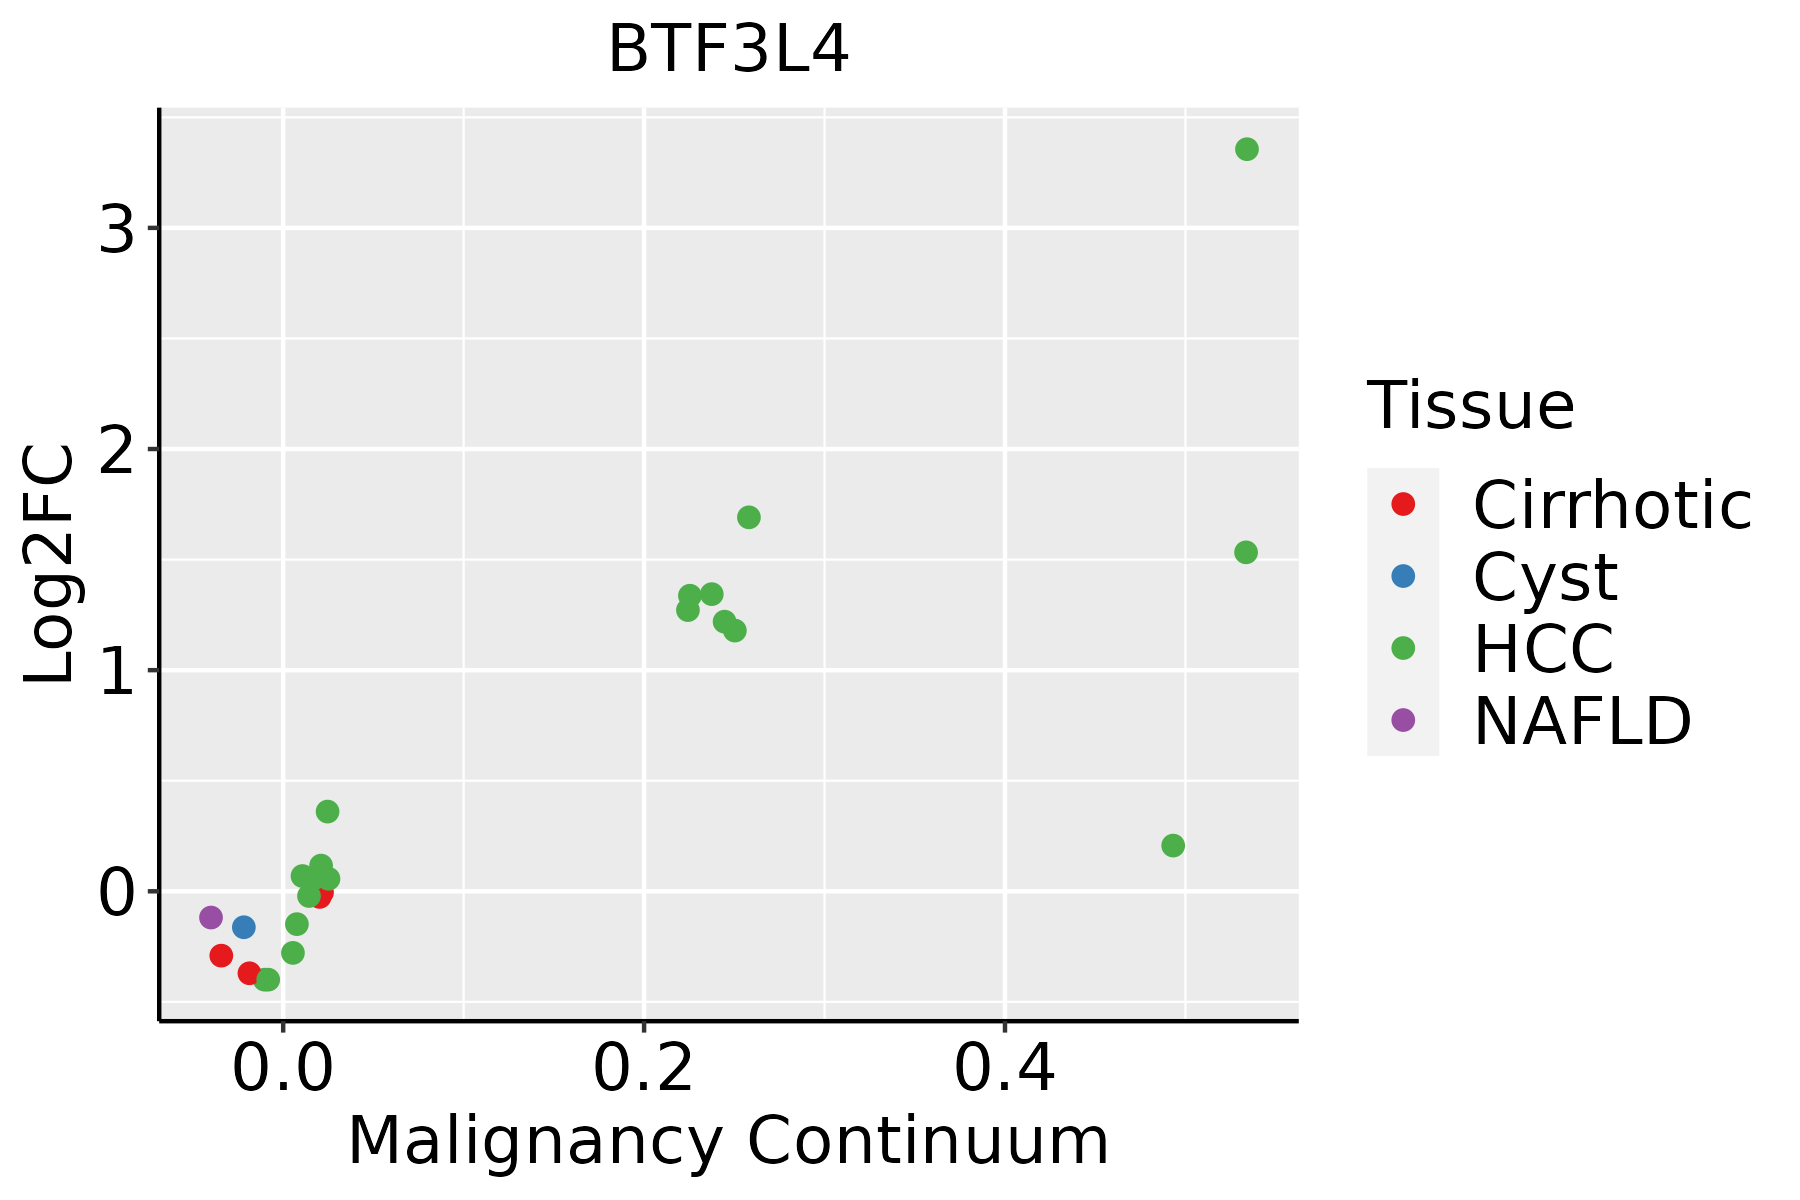 | HCC: Hepatocellular carcinoma |
| NAFLD: Non-alcoholic fatty liver disease | ||
| Oral Cavity | 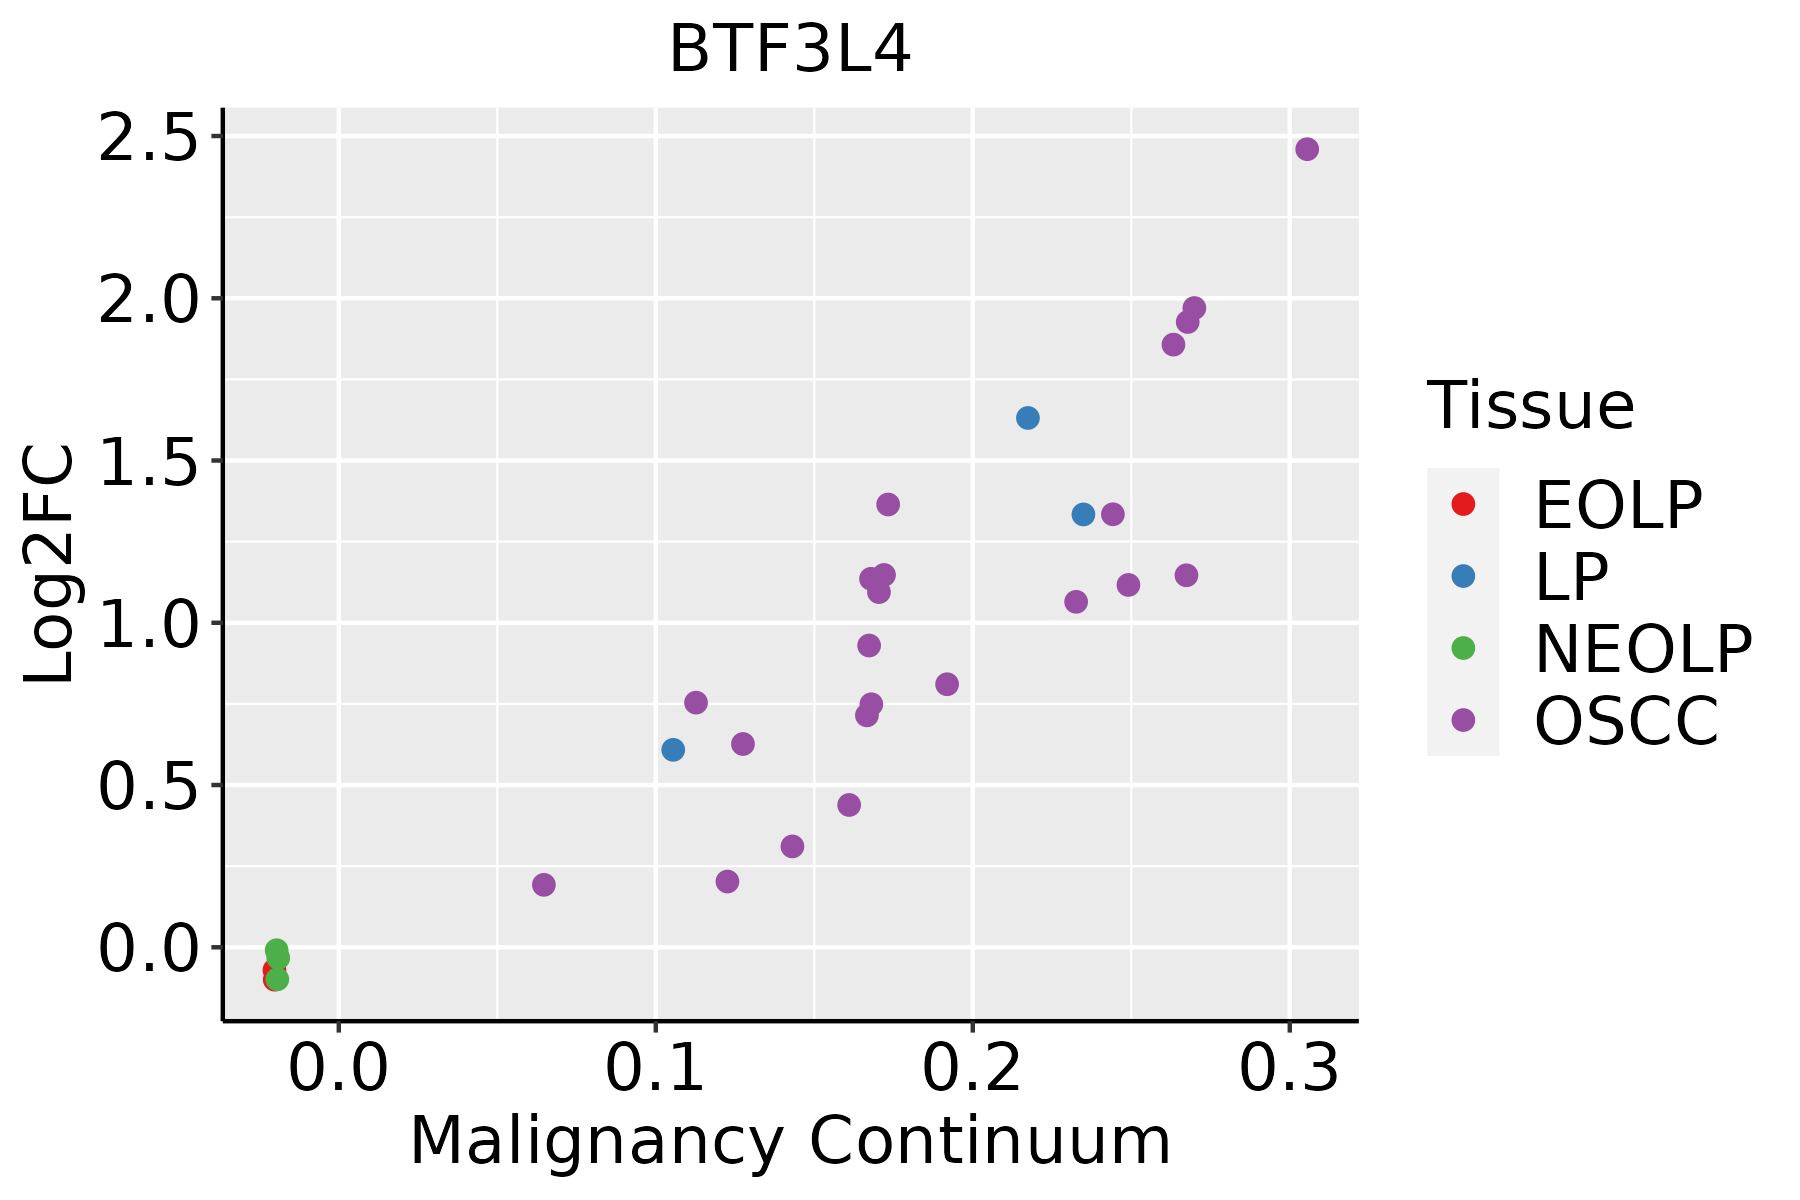 | EOLP: Erosive Oral lichen planus |
| LP: leukoplakia | ||
| NEOLP: Non-erosive oral lichen planus | ||
| OSCC: Oral squamous cell carcinoma | ||
| Skin |  | AK: Actinic keratosis |
| cSCC: Cutaneous squamous cell carcinoma | ||
| SCCIS:squamous cell carcinoma in situ | ||
| Thyroid | 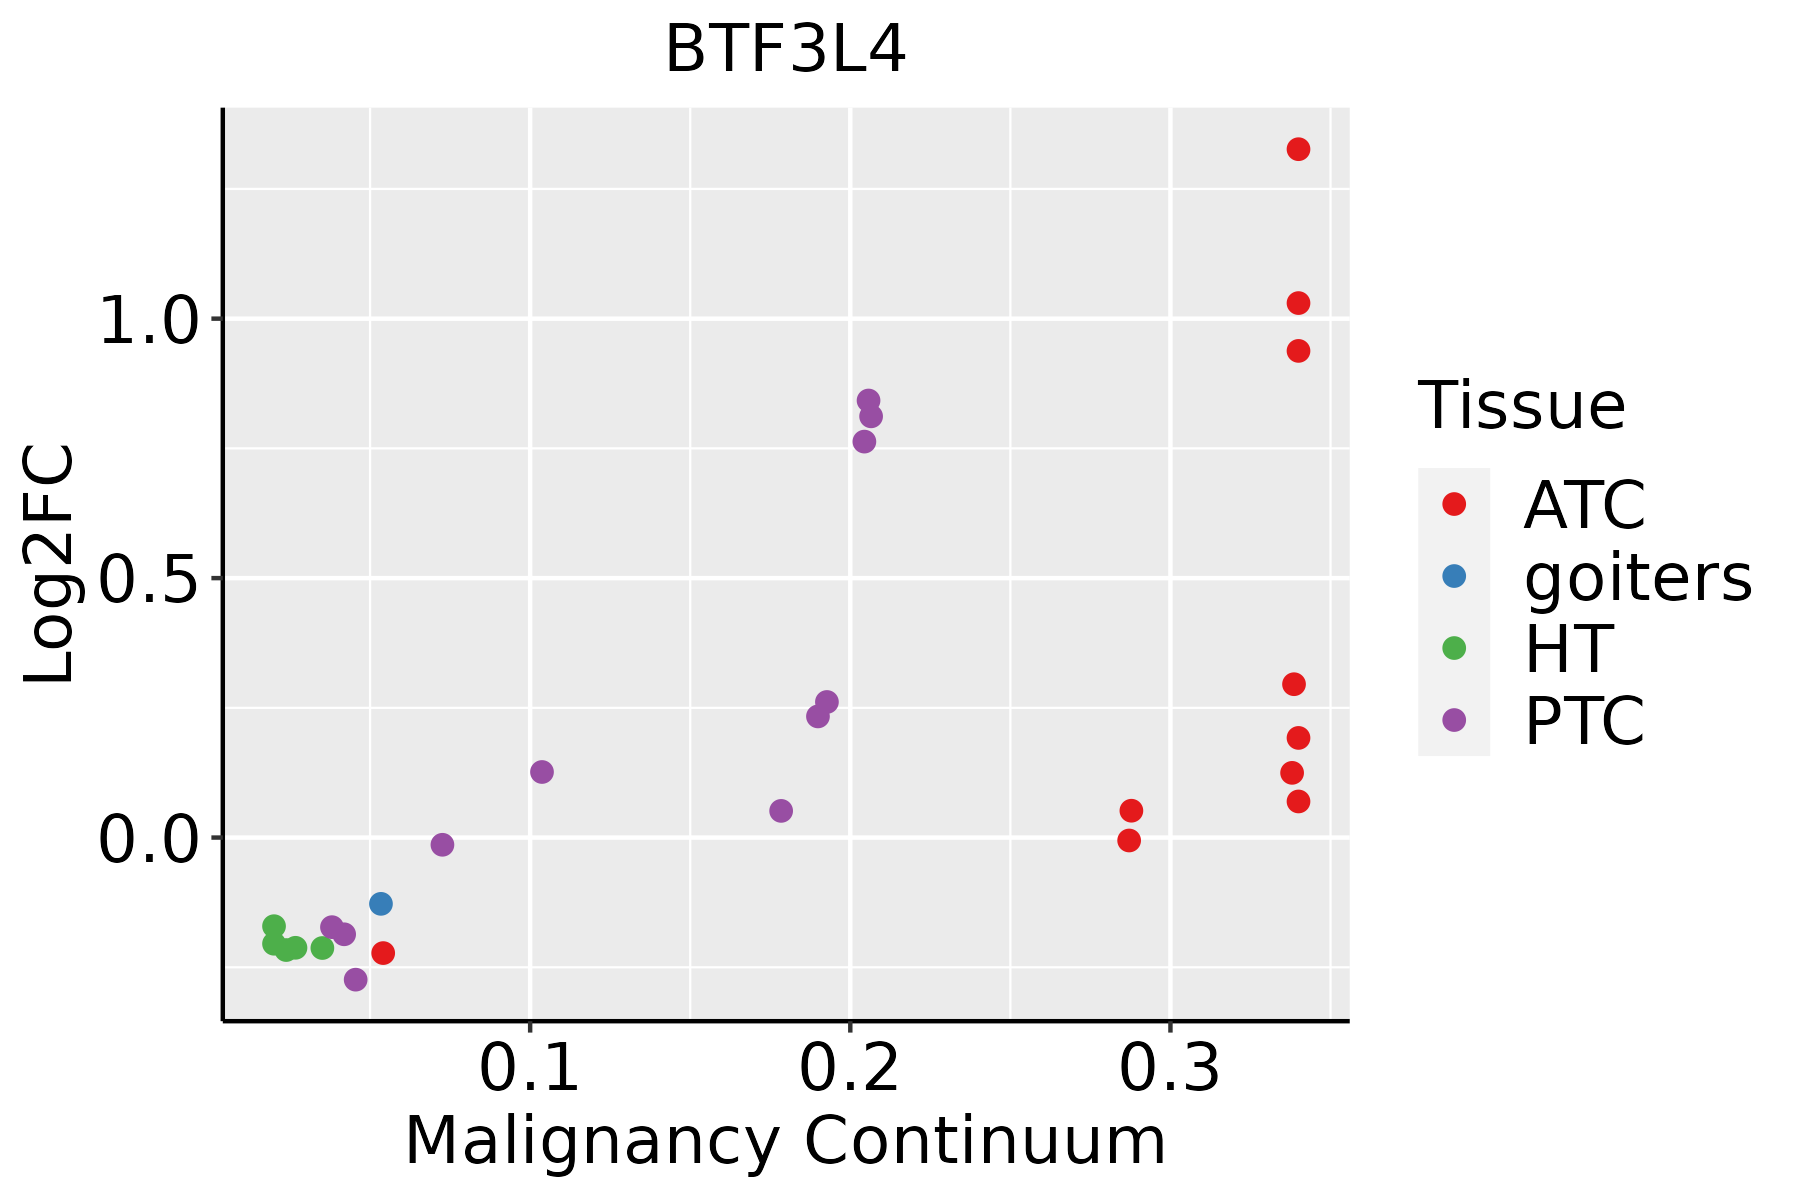 | ATC: Anaplastic thyroid cancer |
| HT: Hashimoto's thyroiditis | ||
| PTC: Papillary thyroid cancer |
| ∗log2FC in expression of this searched gene in stem-like cells from each diseased tissue sample relative to stem-like cells in normal samples in each tissue plotted against the malignancy continuum. Samples are colored based on if they are from different disease stage. |
Top |
Malignant transformation related pathway analysis |
| Find out the enriched GO biological processes and KEGG pathways involved in transition from healthy to precancer to cancer |
| Tissue | Disease Stage | Enriched GO biological Processes |
| Colorectum | AD |  |
| Colorectum | SER |  |
| Colorectum | MSS |  |
| Colorectum | MSI-H |  |
| Colorectum | FAP |  |
| ∗Top 15 enriched GO BP terms are showed in the bar plot of each disease state in each tissue. Each row represents a significant GO biological process which is colored according to the -log10(p.adjust). |
| Page: 1 2 3 4 5 6 7 8 9 |
| GO ID | Tissue | Disease Stage | Description | Gene Ratio | Bg Ratio | pvalue | p.adjust | Count |
| Page: 1 |
| Pathway ID | Tissue | Disease Stage | Description | Gene Ratio | Bg Ratio | pvalue | p.adjust | qvalue | Count |
| Page: 1 |
Top |
Cell-cell communication analysis |
| Identification of potential cell-cell interactions between two cell types and their ligand-receptor pairs for different disease states |
| Ligand | Receptor | LRpair | Pathway | Tissue | Disease Stage |
| Page: 1 |
Top |
Single-cell gene regulatory network inference analysis |
| Find out the significant the regulons (TFs) and the target genes of each regulon across cell types for different disease states |
| TF | Cell Type | Tissue | Disease Stage | Target Gene | RSS | Regulon Activity |
| ∗The dot plots of a searched regulon are shown for all cell subpopulations in each disease state of each tissue based on the regulon specific score inferred using pySCENIC and by calculating the average expression. |
| Page: 1 |
Top |
Somatic mutation of malignant transformation related genes |
| Annotation of somatic variants for genes involved in malignant transformation |
| Hugo Symbol | Variant Class | Variant Classification | dbSNP RS | HGVSc | HGVSp | HGVSp Short | SWISSPROT | BIOTYPE | SIFT | PolyPhen | Tumor Sample Barcode | Tissue | Histology | Sex | Age | Stage | Therapy Types | Drugs | Outcome |
| BTF3L4 | insertion | Frame_Shift_Ins | novel | c.128_129insA | p.Leu46ThrfsTer5 | p.L46Tfs*5 | Q96K17 | protein_coding | TCGA-E9-A1RG-01 | Breast | breast invasive carcinoma | Female | <65 | III/IV | Hormone Therapy | tamoxiphen | SD | ||
| BTF3L4 | SNV | Missense_Mutation | novel | c.75N>T | p.Lys25Asn | p.K25N | Q96K17 | protein_coding | deleterious(0) | possibly_damaging(0.873) | TCGA-A5-A0G2-01 | Endometrium | uterine corpus endometrioid carcinoma | Female | <65 | III/IV | Unknown | Unknown | SD |
| BTF3L4 | SNV | Missense_Mutation | novel | c.341N>T | p.Arg114Met | p.R114M | Q96K17 | protein_coding | deleterious(0) | benign(0.438) | TCGA-A5-A0G2-01 | Endometrium | uterine corpus endometrioid carcinoma | Female | <65 | III/IV | Unknown | Unknown | SD |
| BTF3L4 | SNV | Missense_Mutation | novel | c.45N>G | p.Ile15Met | p.I15M | Q96K17 | protein_coding | deleterious(0.01) | possibly_damaging(0.863) | TCGA-AP-A1DK-01 | Endometrium | uterine corpus endometrioid carcinoma | Female | <65 | I/II | Unknown | Unknown | SD |
| BTF3L4 | SNV | Missense_Mutation | novel | c.40N>T | p.Arg14Trp | p.R14W | Q96K17 | protein_coding | deleterious(0.02) | benign(0.035) | TCGA-AX-A1C4-01 | Endometrium | uterine corpus endometrioid carcinoma | Female | <65 | I/II | Unknown | Unknown | SD |
| BTF3L4 | SNV | Missense_Mutation | c.101C>G | p.Ala34Gly | p.A34G | Q96K17 | protein_coding | tolerated(0.17) | benign(0.018) | TCGA-D1-A0ZS-01 | Endometrium | uterine corpus endometrioid carcinoma | Female | <65 | I/II | Unknown | Unknown | SD | |
| BTF3L4 | SNV | Missense_Mutation | c.166N>C | p.Glu56Gln | p.E56Q | Q96K17 | protein_coding | deleterious(0.01) | possibly_damaging(0.855) | TCGA-86-8585-01 | Lung | lung adenocarcinoma | Male | <65 | I/II | Unknown | Unknown | SD |
| Page: 1 |
Top |
Related drugs of malignant transformation related genes |
| Identification of chemicals and drugs interact with genes involved in malignant transfromation |
| (DGIdb 4.0) |
| Entrez ID | Symbol | Category | Interaction Types | Drug Claim Name | Drug Name | PMIDs |
| Page: 1 |

Copyright 2023-Present -The University of Texas Health Science Center at Houston |