
|
|||||
|
 | |
| |
| |
| |
| |
| |
|
Gene: AZI2 |
Gene summary for AZI2 |
| Gene information | Species | Human | Gene symbol | AZI2 | Gene ID | 64343 |
| Gene name | 5-azacytidine induced 2 | |
| Gene Alias | AZ2 | |
| Cytomap | 3p24.1 | |
| Gene Type | protein-coding | GO ID | GO:0000278 | UniProtAcc | Q9H6S1 |
Top |
Malignant transformation analysis |
| Identification of the aberrant gene expression in precancerous and cancerous lesions by comparing the gene expression of stem-like cells in diseased tissues with normal stem cells |
| Entrez ID | Symbol | Replicates | Species | Organ | Tissue | Adj P-value | Log2FC | Malignancy |
| 64343 | AZI2 | C09 | Human | Oral cavity | OSCC | 3.52e-07 | 3.09e-01 | 0.1431 |
| 64343 | AZI2 | LN22 | Human | Oral cavity | OSCC | 2.68e-03 | 3.91e-01 | 0.1733 |
| 64343 | AZI2 | LN46 | Human | Oral cavity | OSCC | 6.02e-10 | 4.96e-01 | 0.1666 |
| 64343 | AZI2 | SYSMH1 | Human | Oral cavity | OSCC | 1.97e-06 | 1.53e-01 | 0.1127 |
| 64343 | AZI2 | SYSMH2 | Human | Oral cavity | OSCC | 4.76e-05 | 3.17e-01 | 0.2326 |
| 64343 | AZI2 | SYSMH3 | Human | Oral cavity | OSCC | 6.10e-09 | 3.86e-01 | 0.2442 |
| 64343 | AZI2 | SYSMH6 | Human | Oral cavity | OSCC | 3.71e-06 | 2.08e-01 | 0.1275 |
| 64343 | AZI2 | P4_S8_cSCC | Human | Skin | cSCC | 4.57e-02 | 5.92e-02 | -0.3095 |
| 64343 | AZI2 | P1_cSCC | Human | Skin | cSCC | 2.91e-18 | 7.55e-01 | 0.0292 |
| 64343 | AZI2 | P2_cSCC | Human | Skin | cSCC | 2.03e-09 | 3.75e-01 | -0.024 |
| 64343 | AZI2 | P4_cSCC | Human | Skin | cSCC | 6.83e-20 | 3.56e-01 | -0.00290000000000005 |
| 64343 | AZI2 | P10_cSCC | Human | Skin | cSCC | 6.09e-16 | 5.81e-01 | 0.1017 |
| 64343 | AZI2 | male-WTA | Human | Thyroid | PTC | 9.29e-23 | 6.43e-02 | 0.1037 |
| 64343 | AZI2 | PTC01 | Human | Thyroid | PTC | 2.29e-14 | 6.19e-02 | 0.1899 |
| 64343 | AZI2 | PTC03 | Human | Thyroid | PTC | 1.06e-06 | -2.22e-02 | 0.1784 |
| 64343 | AZI2 | PTC04 | Human | Thyroid | PTC | 1.88e-20 | 1.30e-01 | 0.1927 |
| 64343 | AZI2 | PTC05 | Human | Thyroid | PTC | 3.37e-08 | 2.48e-01 | 0.2065 |
| 64343 | AZI2 | PTC06 | Human | Thyroid | PTC | 6.63e-16 | 2.62e-01 | 0.2057 |
| 64343 | AZI2 | PTC07 | Human | Thyroid | PTC | 1.15e-26 | 2.07e-01 | 0.2044 |
| 64343 | AZI2 | ATC09 | Human | Thyroid | ATC | 5.92e-05 | 2.12e-01 | 0.2871 |
| Page: 1 2 3 4 5 6 |
| Tissue | Expression Dynamics | Abbreviation |
| Esophagus | 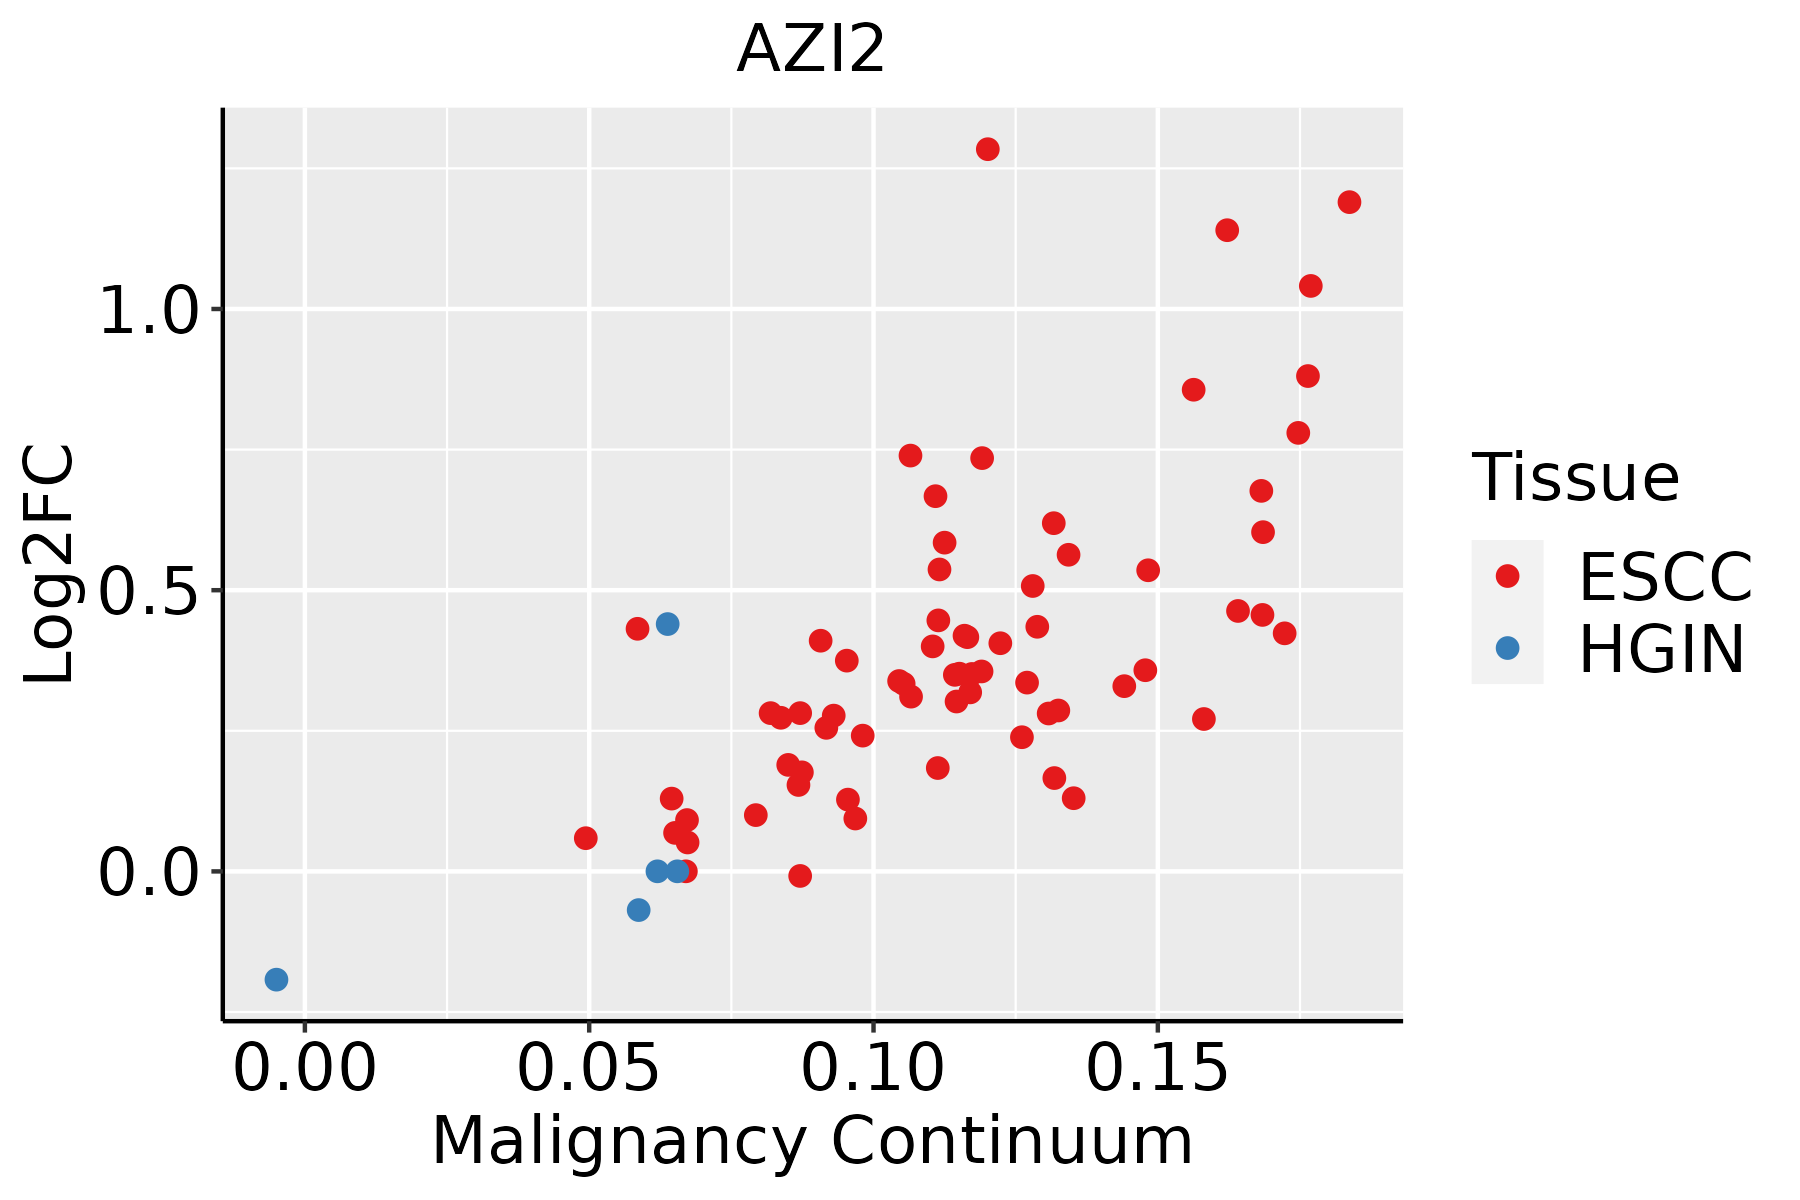 | ESCC: Esophageal squamous cell carcinoma |
| HGIN: High-grade intraepithelial neoplasias | ||
| LGIN: Low-grade intraepithelial neoplasias | ||
| Liver | 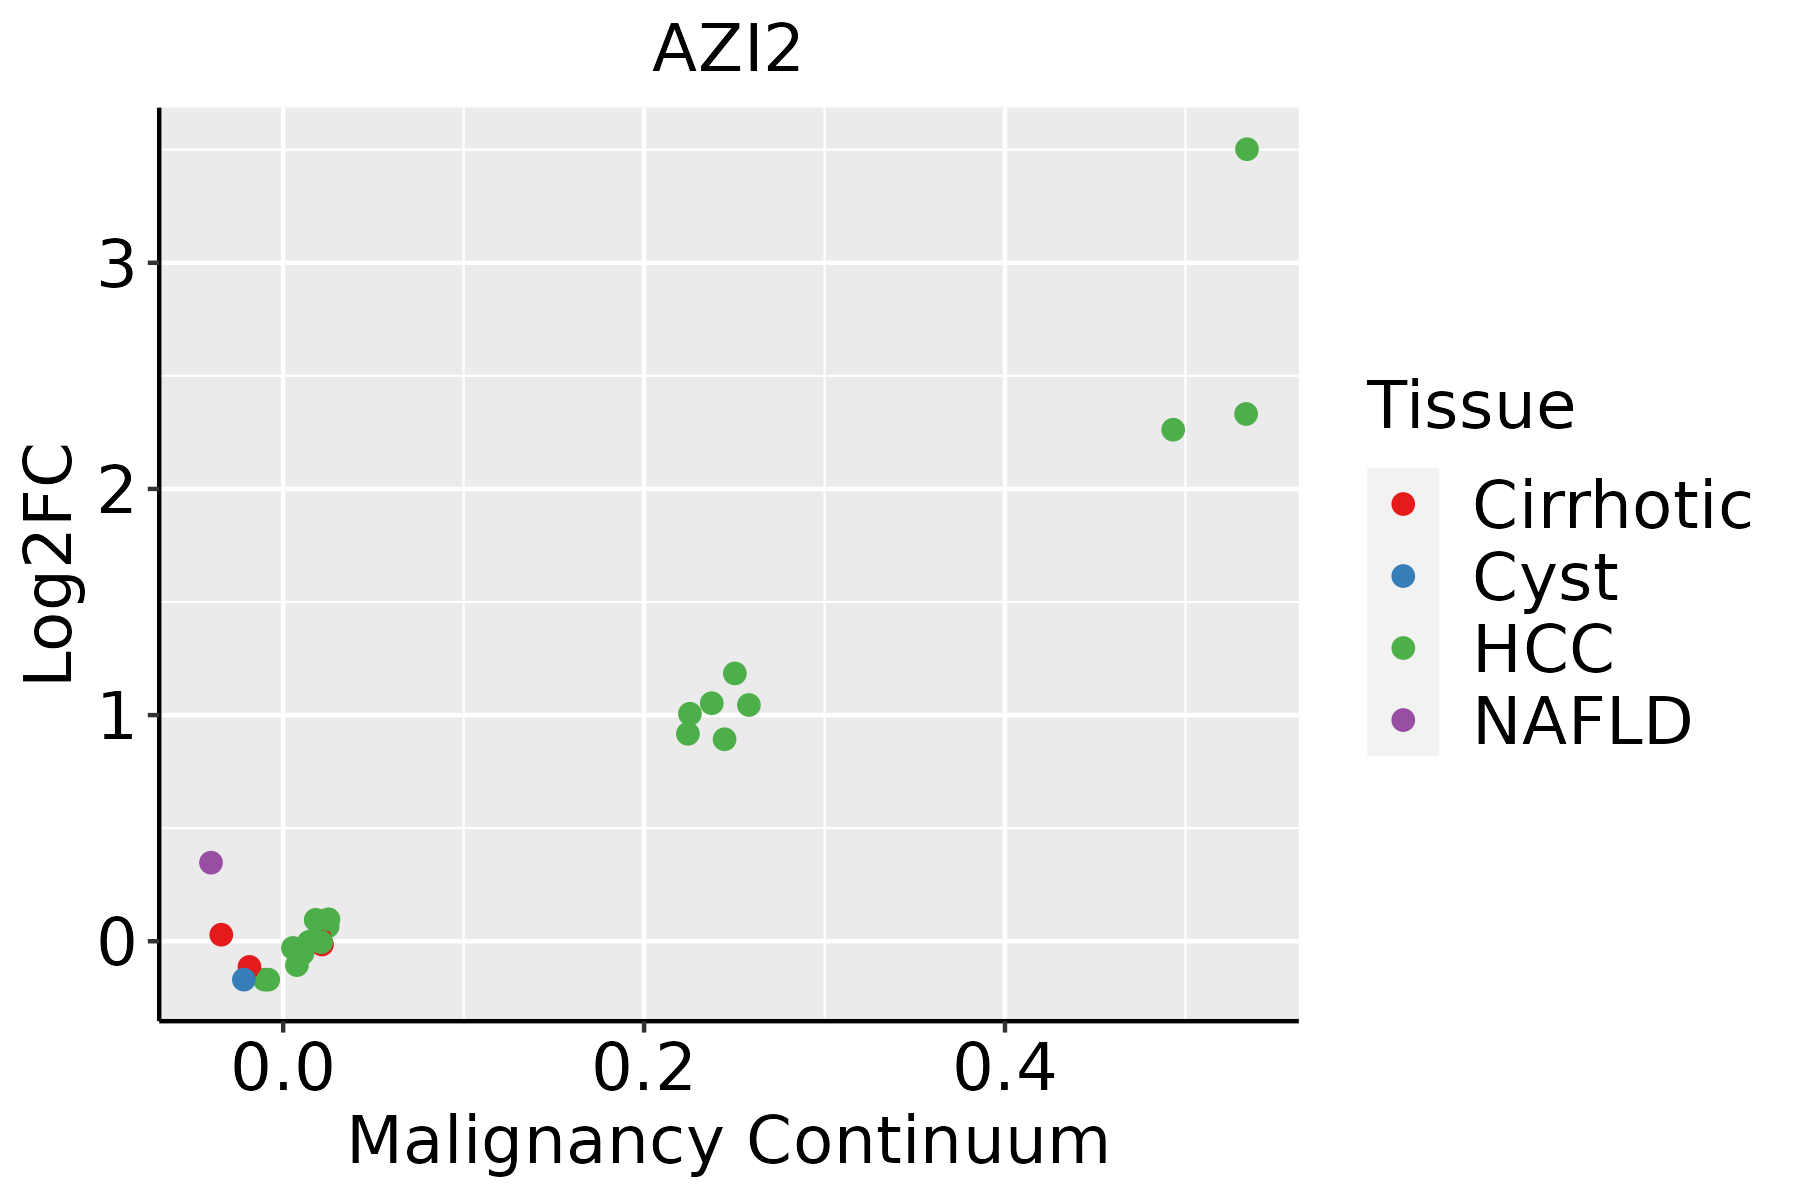 | HCC: Hepatocellular carcinoma |
| NAFLD: Non-alcoholic fatty liver disease | ||
| Oral Cavity |  | EOLP: Erosive Oral lichen planus |
| LP: leukoplakia | ||
| NEOLP: Non-erosive oral lichen planus | ||
| OSCC: Oral squamous cell carcinoma | ||
| Skin | 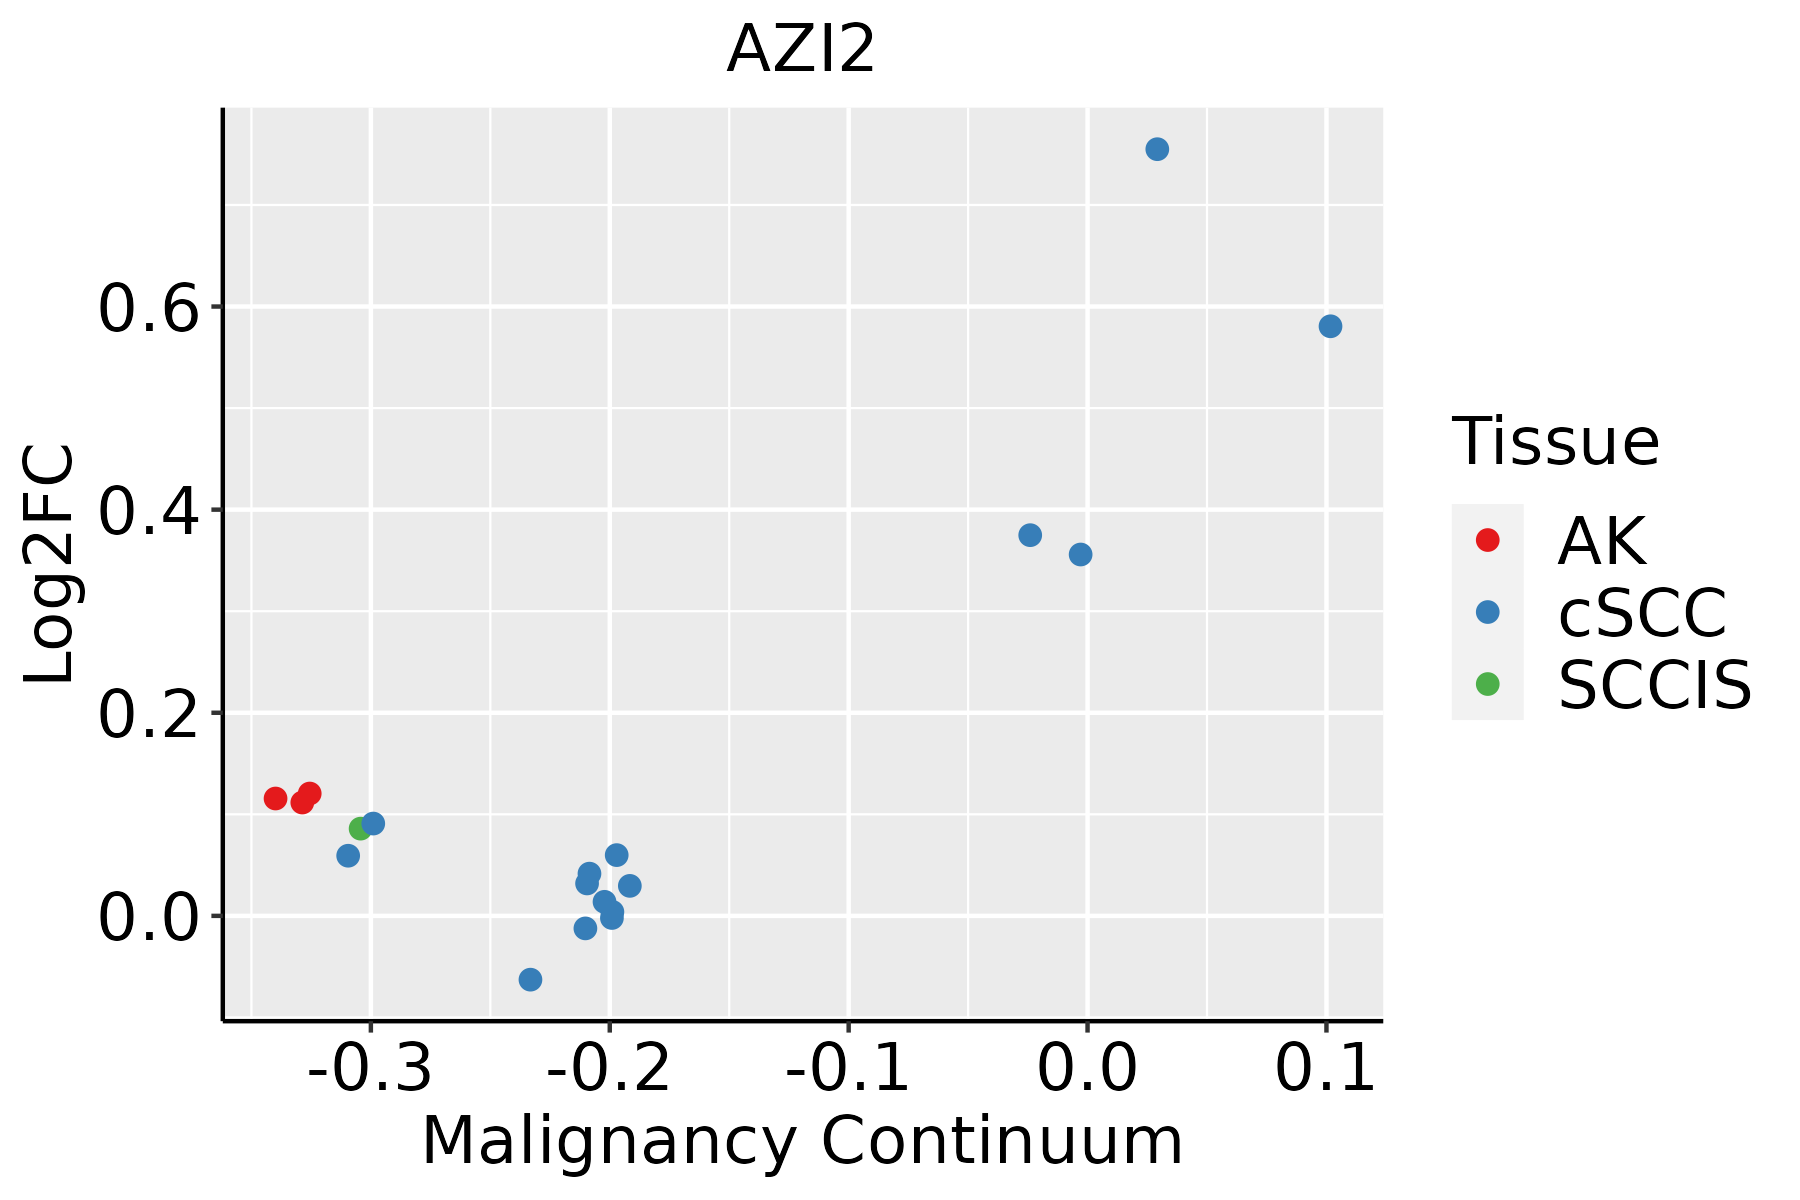 | AK: Actinic keratosis |
| cSCC: Cutaneous squamous cell carcinoma | ||
| SCCIS:squamous cell carcinoma in situ | ||
| Thyroid | 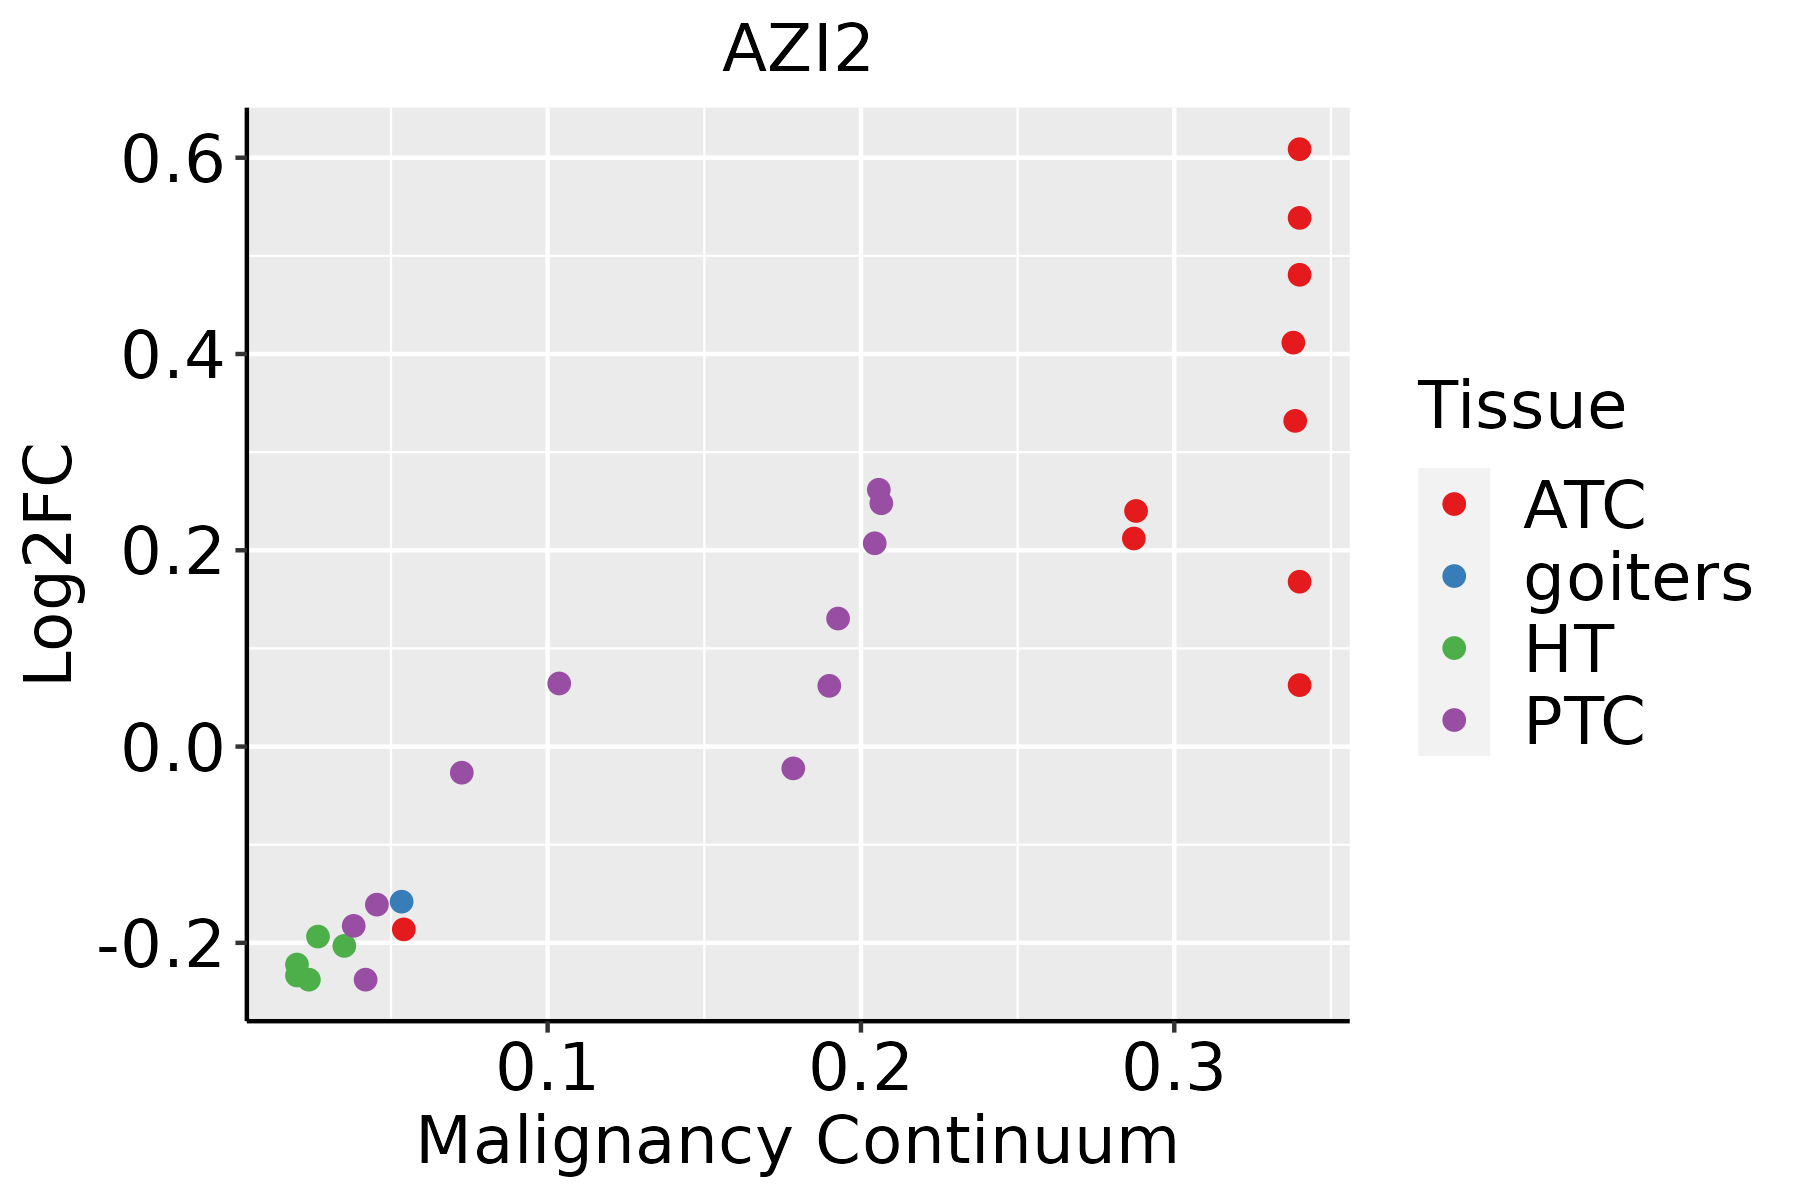 | ATC: Anaplastic thyroid cancer |
| HT: Hashimoto's thyroiditis | ||
| PTC: Papillary thyroid cancer |
| ∗log2FC in expression of this searched gene in stem-like cells from each diseased tissue sample relative to stem-like cells in normal samples in each tissue plotted against the malignancy continuum. Samples are colored based on if they are from different disease stage. |
Top |
Malignant transformation related pathway analysis |
| Find out the enriched GO biological processes and KEGG pathways involved in transition from healthy to precancer to cancer |
| Tissue | Disease Stage | Enriched GO biological Processes |
| Colorectum | AD |  |
| Colorectum | SER |  |
| Colorectum | MSS |  |
| Colorectum | MSI-H |  |
| Colorectum | FAP |  |
| ∗Top 15 enriched GO BP terms are showed in the bar plot of each disease state in each tissue. Each row represents a significant GO biological process which is colored according to the -log10(p.adjust). |
| Page: 1 2 3 4 5 6 7 8 9 |
| GO ID | Tissue | Disease Stage | Description | Gene Ratio | Bg Ratio | pvalue | p.adjust | Count |
| GO:000724919 | Esophagus | ESCC | I-kappaB kinase/NF-kappaB signaling | 183/8552 | 281/18723 | 3.02e-11 | 1.01e-09 | 183 |
| GO:004211018 | Esophagus | ESCC | T cell activation | 256/8552 | 487/18723 | 1.18e-03 | 5.87e-03 | 256 |
| GO:19031317 | Esophagus | ESCC | mononuclear cell differentiation | 226/8552 | 426/18723 | 1.20e-03 | 5.88e-03 | 226 |
| GO:00072494 | Liver | Cirrhotic | I-kappaB kinase/NF-kappaB signaling | 108/4634 | 281/18723 | 2.21e-07 | 5.64e-06 | 108 |
| GO:000724912 | Liver | HCC | I-kappaB kinase/NF-kappaB signaling | 156/7958 | 281/18723 | 6.66e-06 | 8.00e-05 | 156 |
| GO:000724910 | Oral cavity | OSCC | I-kappaB kinase/NF-kappaB signaling | 169/7305 | 281/18723 | 4.69e-13 | 2.25e-11 | 169 |
| GO:004211016 | Oral cavity | OSCC | T cell activation | 245/7305 | 487/18723 | 2.00e-07 | 3.22e-06 | 245 |
| GO:19031316 | Oral cavity | OSCC | mononuclear cell differentiation | 210/7305 | 426/18723 | 8.44e-06 | 9.02e-05 | 210 |
| GO:00706618 | Oral cavity | OSCC | leukocyte proliferation | 145/7305 | 318/18723 | 9.31e-03 | 3.33e-02 | 145 |
| GO:00466517 | Oral cavity | OSCC | lymphocyte proliferation | 131/7305 | 288/18723 | 1.41e-02 | 4.67e-02 | 131 |
| GO:000724925 | Skin | cSCC | I-kappaB kinase/NF-kappaB signaling | 116/4864 | 281/18723 | 1.33e-08 | 4.08e-07 | 116 |
| GO:000724926 | Thyroid | PTC | I-kappaB kinase/NF-kappaB signaling | 130/5968 | 281/18723 | 2.78e-07 | 4.80e-06 | 130 |
| GO:0007249111 | Thyroid | ATC | I-kappaB kinase/NF-kappaB signaling | 135/6293 | 281/18723 | 3.31e-07 | 4.91e-06 | 135 |
| Page: 1 |
| Pathway ID | Tissue | Disease Stage | Description | Gene Ratio | Bg Ratio | pvalue | p.adjust | qvalue | Count |
| hsa04622 | Oral cavity | OSCC | RIG-I-like receptor signaling pathway | 41/3704 | 71/8465 | 1.20e-02 | 2.63e-02 | 1.34e-02 | 41 |
| hsa046221 | Oral cavity | OSCC | RIG-I-like receptor signaling pathway | 41/3704 | 71/8465 | 1.20e-02 | 2.63e-02 | 1.34e-02 | 41 |
| Page: 1 |
Top |
Cell-cell communication analysis |
| Identification of potential cell-cell interactions between two cell types and their ligand-receptor pairs for different disease states |
| Ligand | Receptor | LRpair | Pathway | Tissue | Disease Stage |
| Page: 1 |
Top |
Single-cell gene regulatory network inference analysis |
| Find out the significant the regulons (TFs) and the target genes of each regulon across cell types for different disease states |
| TF | Cell Type | Tissue | Disease Stage | Target Gene | RSS | Regulon Activity |
| ∗The dot plots of a searched regulon are shown for all cell subpopulations in each disease state of each tissue based on the regulon specific score inferred using pySCENIC and by calculating the average expression. |
| Page: 1 |
Top |
Somatic mutation of malignant transformation related genes |
| Annotation of somatic variants for genes involved in malignant transformation |
| Hugo Symbol | Variant Class | Variant Classification | dbSNP RS | HGVSc | HGVSp | HGVSp Short | SWISSPROT | BIOTYPE | SIFT | PolyPhen | Tumor Sample Barcode | Tissue | Histology | Sex | Age | Stage | Therapy Types | Drugs | Outcome |
| AZI2 | SNV | Missense_Mutation | c.1060C>T | p.Pro354Ser | p.P354S | Q9H6S1 | protein_coding | deleterious(0.05) | probably_damaging(0.999) | TCGA-AN-A04D-01 | Breast | breast invasive carcinoma | Female | <65 | I/II | Unknown | Unknown | SD | |
| AZI2 | SNV | Missense_Mutation | c.144N>G | p.Ile48Met | p.I48M | Q9H6S1 | protein_coding | deleterious(0) | possibly_damaging(0.68) | TCGA-D8-A27L-01 | Breast | breast invasive carcinoma | Female | <65 | III/IV | Chemotherapy | adriamycin+cuclophosphamide | SD | |
| AZI2 | insertion | Nonsense_Mutation | novel | c.714_715insTATATGAAGTAGCTGTG | p.Val239TyrfsTer4 | p.V239Yfs*4 | Q9H6S1 | protein_coding | TCGA-A1-A0SM-01 | Breast | breast invasive carcinoma | Male | >=65 | I/II | Unknown | Unknown | SD | ||
| AZI2 | deletion | Frame_Shift_Del | c.171delN | p.Glu58ArgfsTer5 | p.E58Rfs*5 | Q9H6S1 | protein_coding | TCGA-GM-A2DF-01 | Breast | breast invasive carcinoma | Female | <65 | I/II | Chemotherapy | taxol | CR | |||
| AZI2 | SNV | Missense_Mutation | novel | c.50C>T | p.Ala17Val | p.A17V | Q9H6S1 | protein_coding | deleterious(0.02) | benign(0.412) | TCGA-2W-A8YY-01 | Cervix | cervical & endocervical cancer | Female | <65 | I/II | Chemotherapy | cisplatin | CR |
| AZI2 | SNV | Missense_Mutation | novel | c.107N>T | p.Ala36Val | p.A36V | Q9H6S1 | protein_coding | deleterious(0) | probably_damaging(0.999) | TCGA-EA-A410-01 | Cervix | cervical & endocervical cancer | Female | <65 | I/II | Unknown | Unknown | SD |
| AZI2 | SNV | Missense_Mutation | rs201211825 | c.553N>A | p.Asp185Asn | p.D185N | Q9H6S1 | protein_coding | tolerated(1) | benign(0) | TCGA-FU-A3HZ-01 | Cervix | cervical & endocervical cancer | Female | <65 | I/II | Chemotherapy | cisplatin | CR |
| AZI2 | SNV | Missense_Mutation | c.235G>A | p.Glu79Lys | p.E79K | Q9H6S1 | protein_coding | deleterious(0.01) | benign(0.042) | TCGA-IR-A3LK-01 | Cervix | cervical & endocervical cancer | Female | >=65 | I/II | Chemotherapy | cisplatin | PD | |
| AZI2 | SNV | Missense_Mutation | c.194N>T | p.Arg65Ile | p.R65I | Q9H6S1 | protein_coding | deleterious(0) | probably_damaging(0.96) | TCGA-AA-3510-01 | Colorectum | colon adenocarcinoma | Male | >=65 | I/II | Unknown | Unknown | SD | |
| AZI2 | SNV | Missense_Mutation | c.832N>G | p.Phe278Val | p.F278V | Q9H6S1 | protein_coding | tolerated(0.5) | benign(0.022) | TCGA-CA-6717-01 | Colorectum | colon adenocarcinoma | Male | <65 | I/II | Chemotherapy | oxaliplatin | CR |
| Page: 1 2 3 4 5 |
Top |
Related drugs of malignant transformation related genes |
| Identification of chemicals and drugs interact with genes involved in malignant transfromation |
| (DGIdb 4.0) |
| Entrez ID | Symbol | Category | Interaction Types | Drug Claim Name | Drug Name | PMIDs |
| Page: 1 |

Copyright 2023-Present -The University of Texas Health Science Center at Houston |