
|
|||||
|
 | |
| |
| |
| |
| |
| |
|
Gene: ATP6V1H |
Gene summary for ATP6V1H |
| Gene information | Species | Human | Gene symbol | ATP6V1H | Gene ID | 51606 |
| Gene name | ATPase H+ transporting V1 subunit H | |
| Gene Alias | CGI-11 | |
| Cytomap | 8q11.23 | |
| Gene Type | protein-coding | GO ID | GO:0006810 | UniProtAcc | A0A024R7U9 |
Top |
Malignant transformation analysis |
| Identification of the aberrant gene expression in precancerous and cancerous lesions by comparing the gene expression of stem-like cells in diseased tissues with normal stem cells |
| Entrez ID | Symbol | Replicates | Species | Organ | Tissue | Adj P-value | Log2FC | Malignancy |
| 51606 | ATP6V1H | S029 | Human | Liver | HCC | 3.74e-24 | 1.68e+00 | 0.2581 |
| 51606 | ATP6V1H | C04 | Human | Oral cavity | OSCC | 1.08e-36 | 1.37e+00 | 0.2633 |
| 51606 | ATP6V1H | C21 | Human | Oral cavity | OSCC | 5.82e-57 | 1.46e+00 | 0.2678 |
| 51606 | ATP6V1H | C30 | Human | Oral cavity | OSCC | 1.67e-47 | 1.86e+00 | 0.3055 |
| 51606 | ATP6V1H | C38 | Human | Oral cavity | OSCC | 4.90e-14 | 1.12e+00 | 0.172 |
| 51606 | ATP6V1H | C43 | Human | Oral cavity | OSCC | 3.00e-23 | 4.83e-01 | 0.1704 |
| 51606 | ATP6V1H | C46 | Human | Oral cavity | OSCC | 2.95e-23 | 5.90e-01 | 0.1673 |
| 51606 | ATP6V1H | C51 | Human | Oral cavity | OSCC | 1.30e-24 | 1.22e+00 | 0.2674 |
| 51606 | ATP6V1H | C57 | Human | Oral cavity | OSCC | 1.16e-33 | 8.49e-01 | 0.1679 |
| 51606 | ATP6V1H | C06 | Human | Oral cavity | OSCC | 5.90e-10 | 1.43e+00 | 0.2699 |
| 51606 | ATP6V1H | C07 | Human | Oral cavity | OSCC | 1.36e-05 | 9.47e-01 | 0.2491 |
| 51606 | ATP6V1H | C08 | Human | Oral cavity | OSCC | 5.94e-30 | 6.45e-01 | 0.1919 |
| 51606 | ATP6V1H | C09 | Human | Oral cavity | OSCC | 7.41e-11 | 3.93e-01 | 0.1431 |
| 51606 | ATP6V1H | LN22 | Human | Oral cavity | OSCC | 1.35e-09 | 1.03e+00 | 0.1733 |
| 51606 | ATP6V1H | LN46 | Human | Oral cavity | OSCC | 2.56e-11 | 5.37e-01 | 0.1666 |
| 51606 | ATP6V1H | LP15 | Human | Oral cavity | LP | 3.28e-09 | 1.45e+00 | 0.2174 |
| 51606 | ATP6V1H | EOLP-1 | Human | Oral cavity | EOLP | 8.53e-05 | 2.42e-01 | -0.0202 |
| 51606 | ATP6V1H | SYSMH1 | Human | Oral cavity | OSCC | 7.06e-19 | 4.12e-01 | 0.1127 |
| 51606 | ATP6V1H | SYSMH2 | Human | Oral cavity | OSCC | 4.41e-23 | 7.01e-01 | 0.2326 |
| 51606 | ATP6V1H | SYSMH3 | Human | Oral cavity | OSCC | 8.08e-23 | 6.24e-01 | 0.2442 |
| Page: 1 2 3 4 5 6 7 |
| Tissue | Expression Dynamics | Abbreviation |
| Cervix | 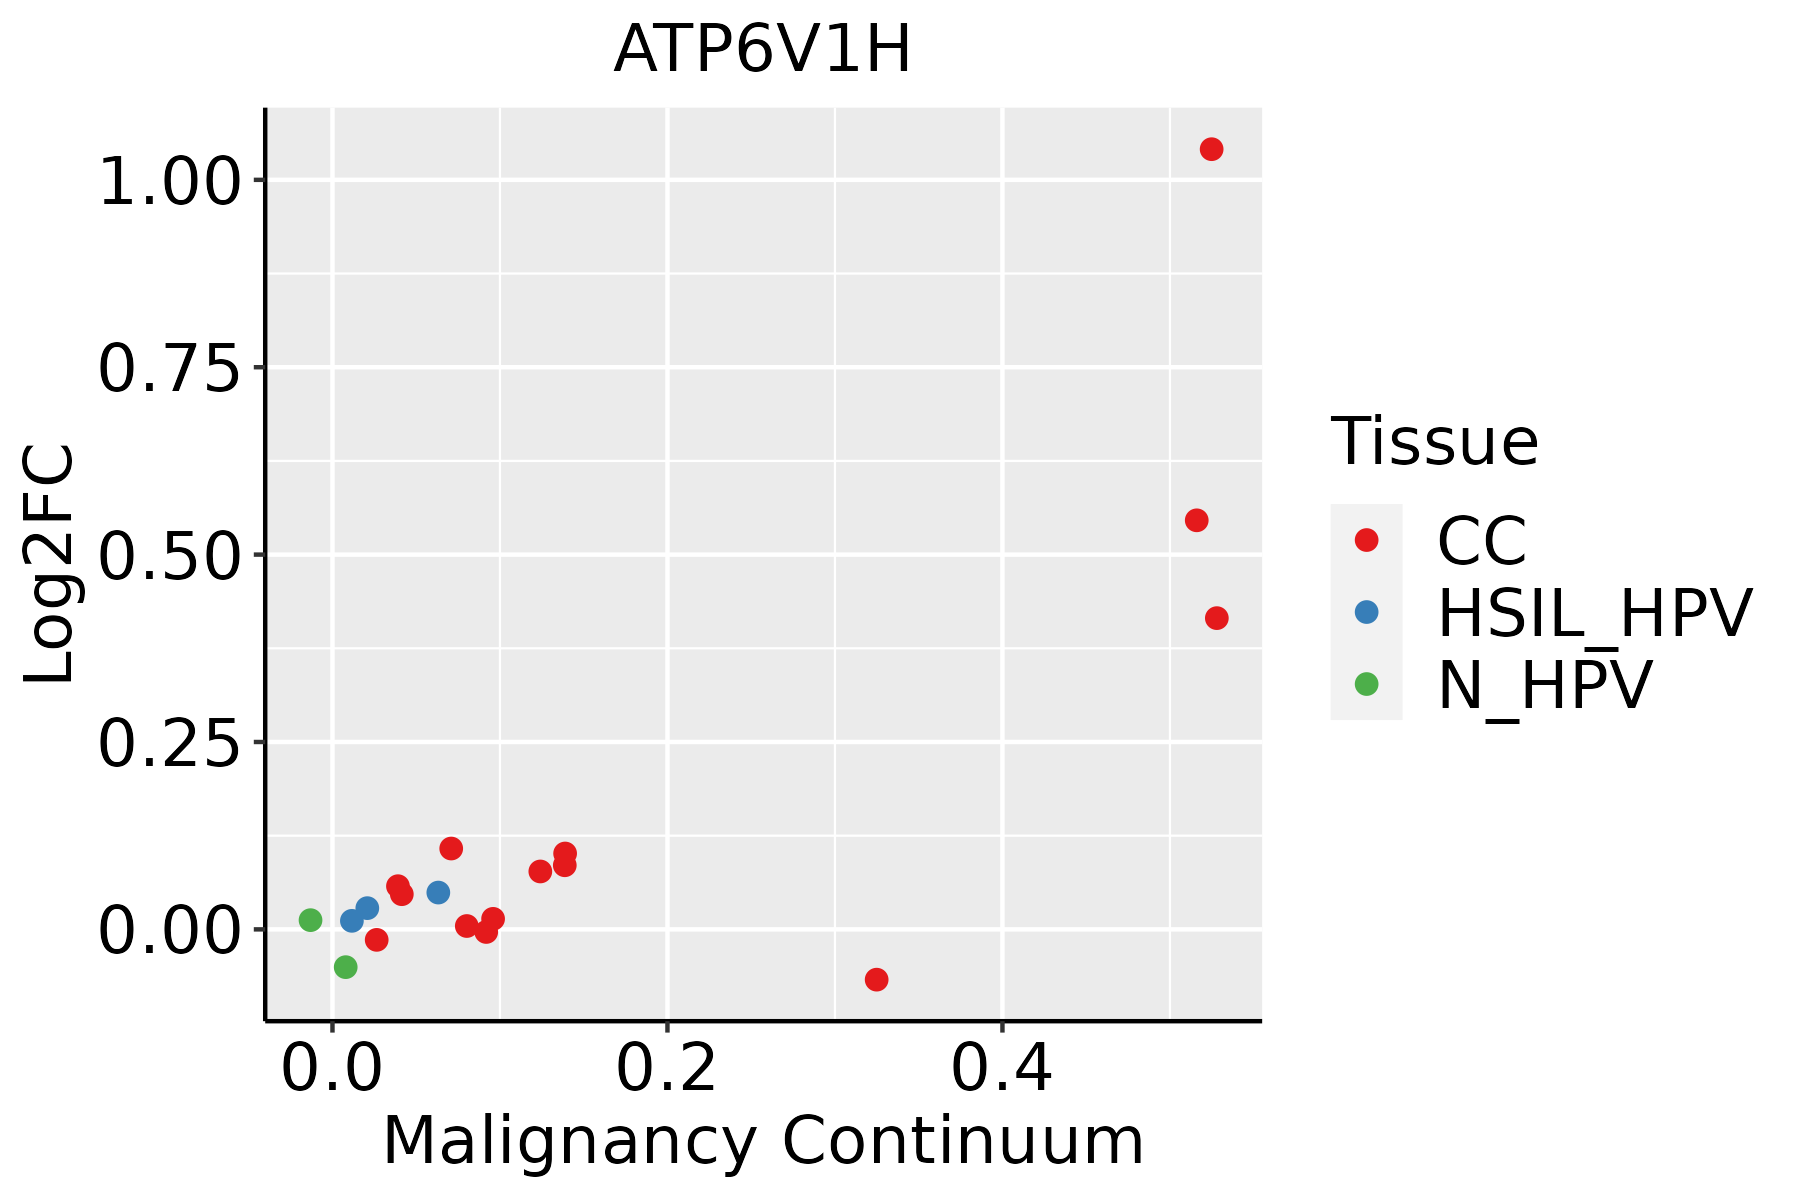 | CC: Cervix cancer |
| HSIL_HPV: HPV-infected high-grade squamous intraepithelial lesions | ||
| N_HPV: HPV-infected normal cervix | ||
| Esophagus | 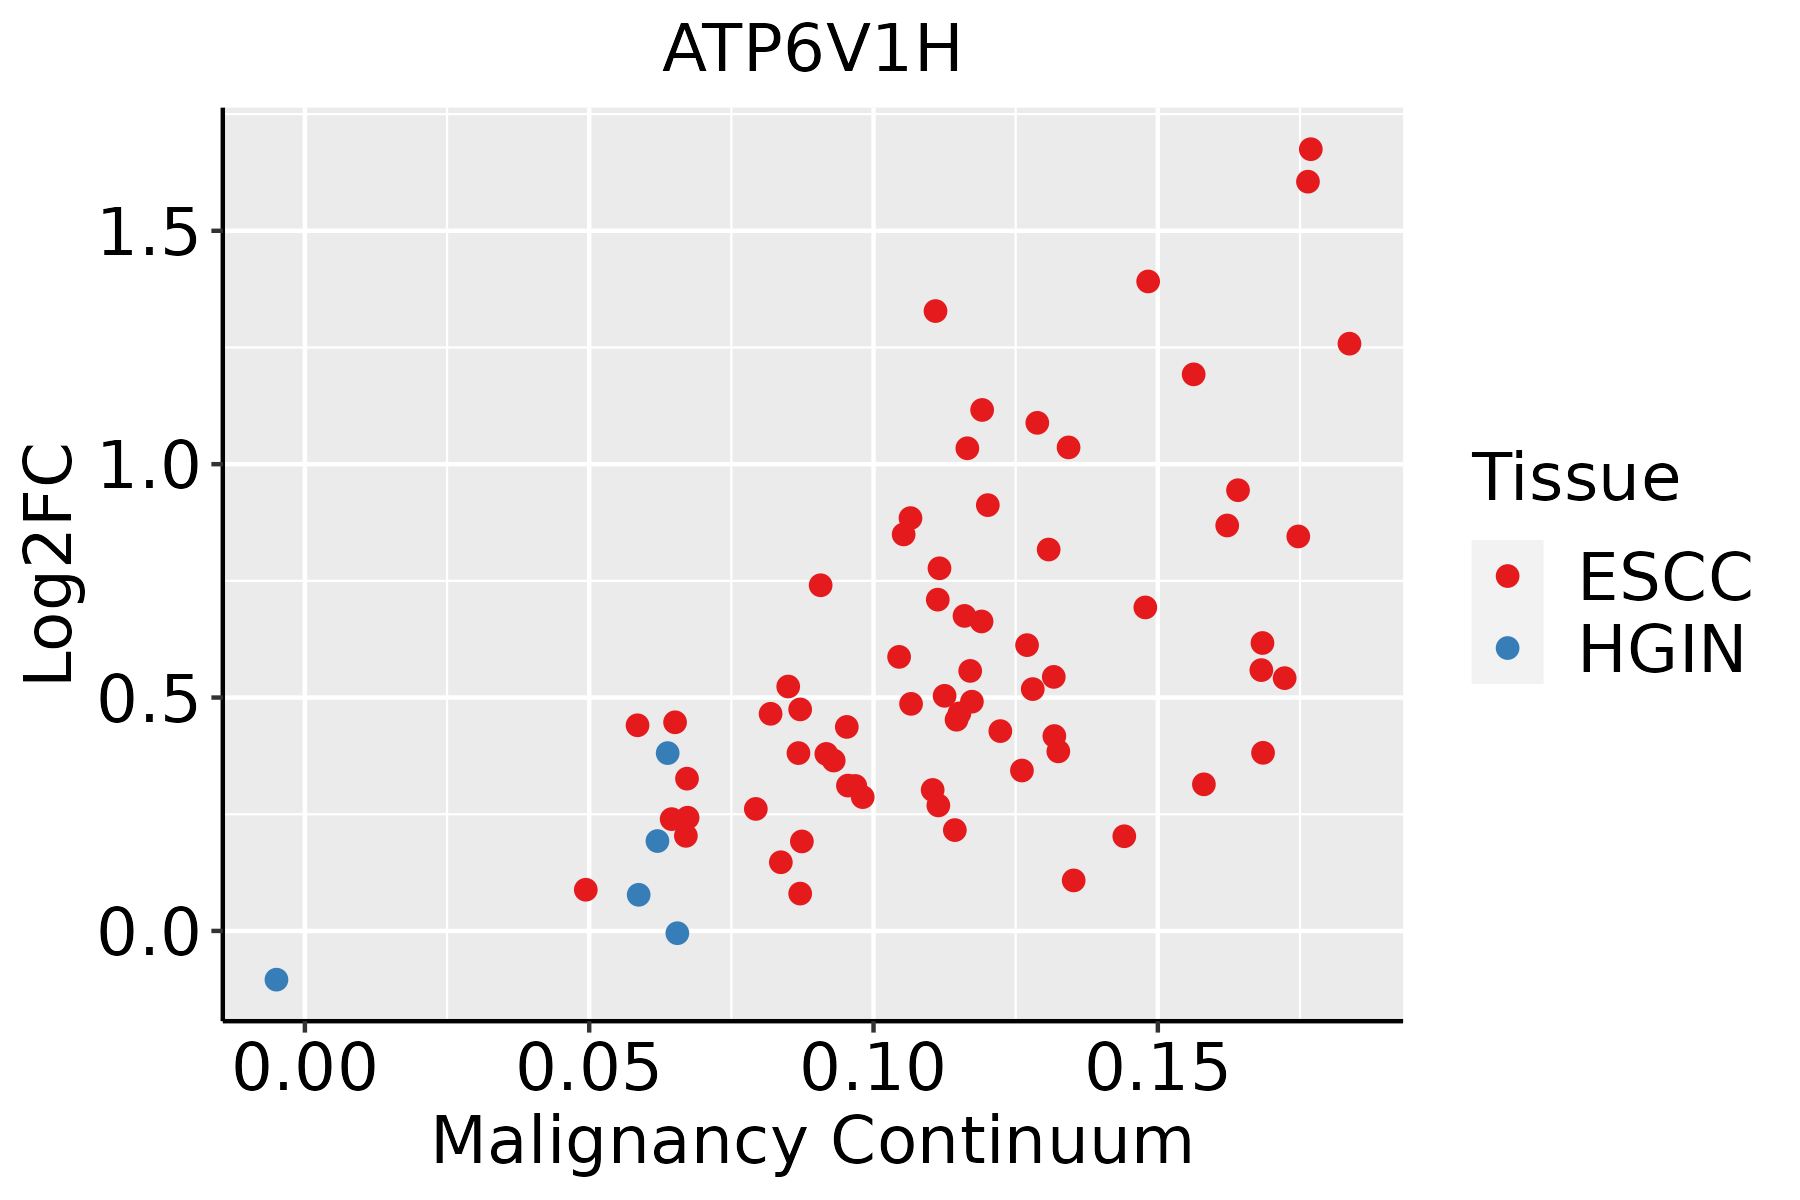 | ESCC: Esophageal squamous cell carcinoma |
| HGIN: High-grade intraepithelial neoplasias | ||
| LGIN: Low-grade intraepithelial neoplasias | ||
| Liver | 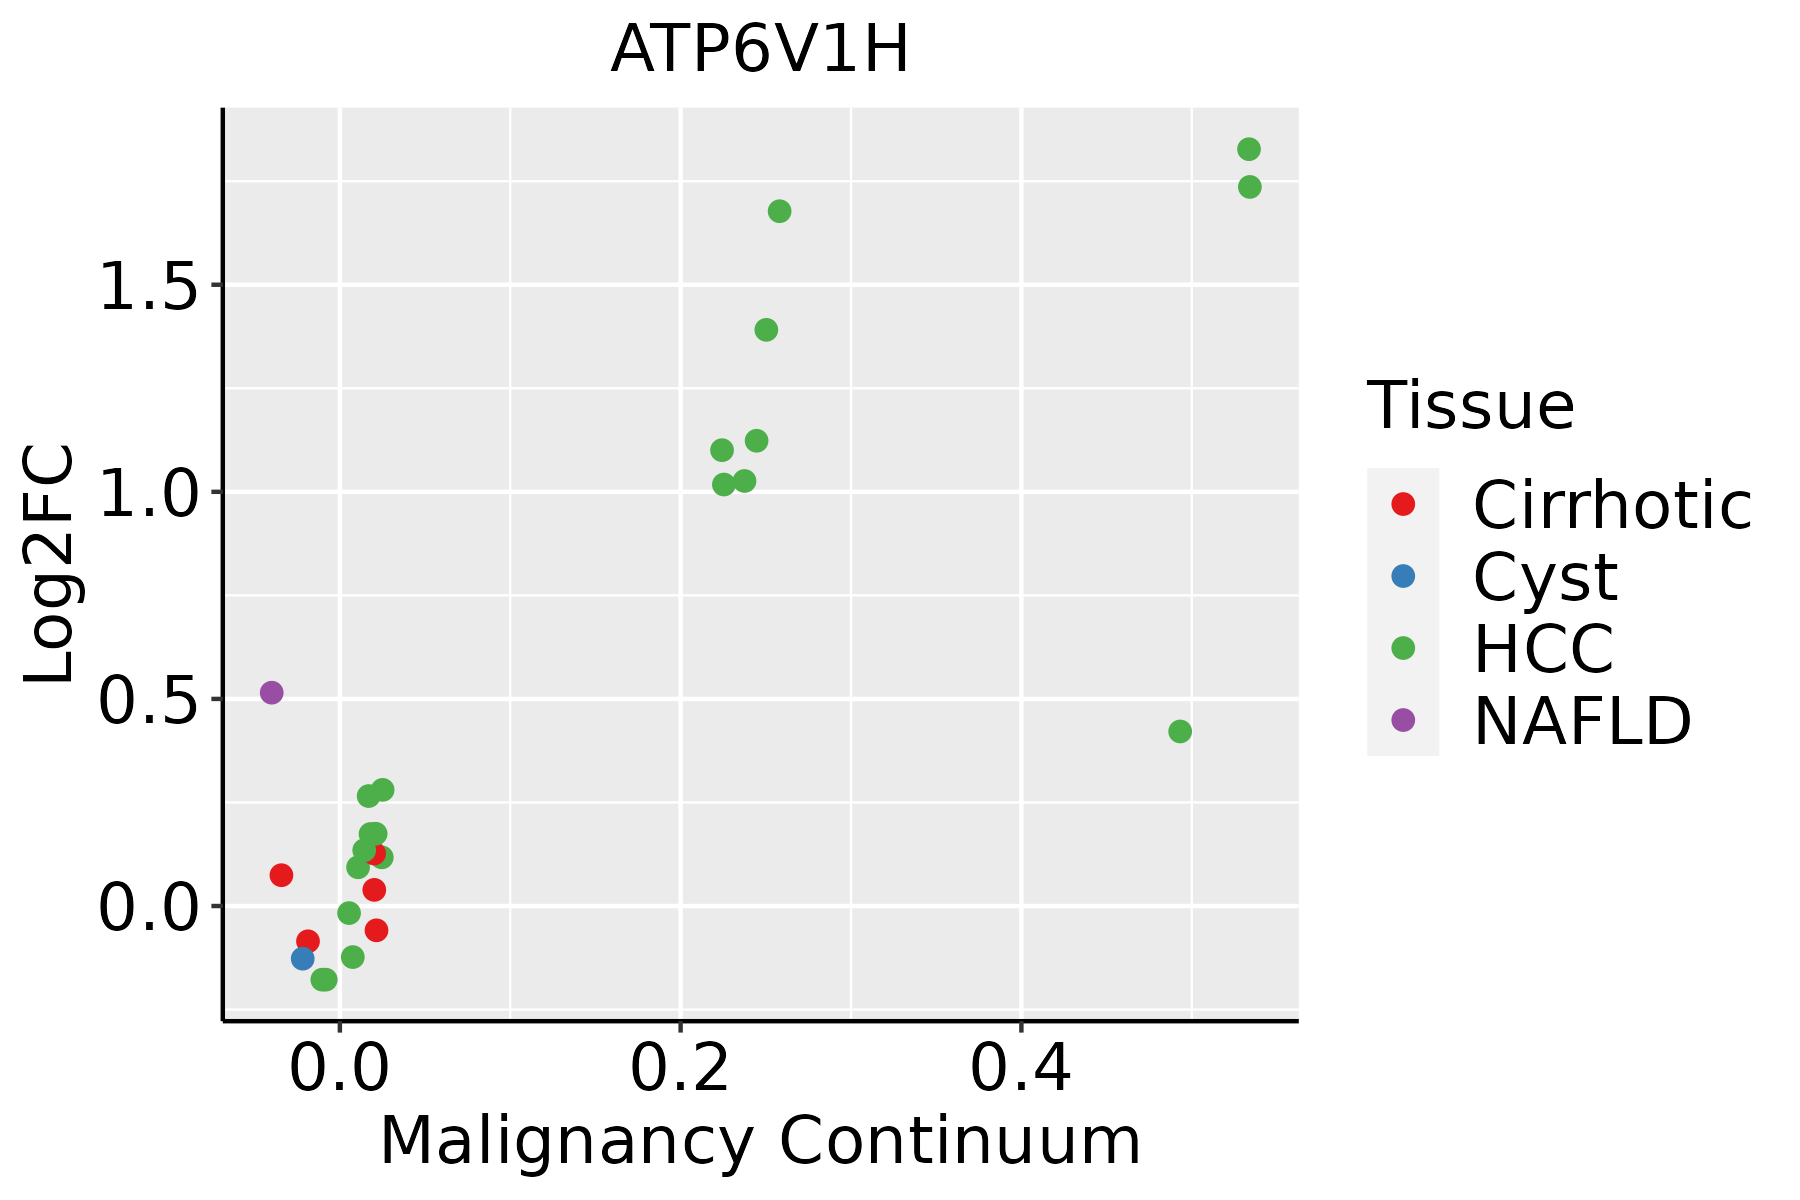 | HCC: Hepatocellular carcinoma |
| NAFLD: Non-alcoholic fatty liver disease | ||
| Oral Cavity | 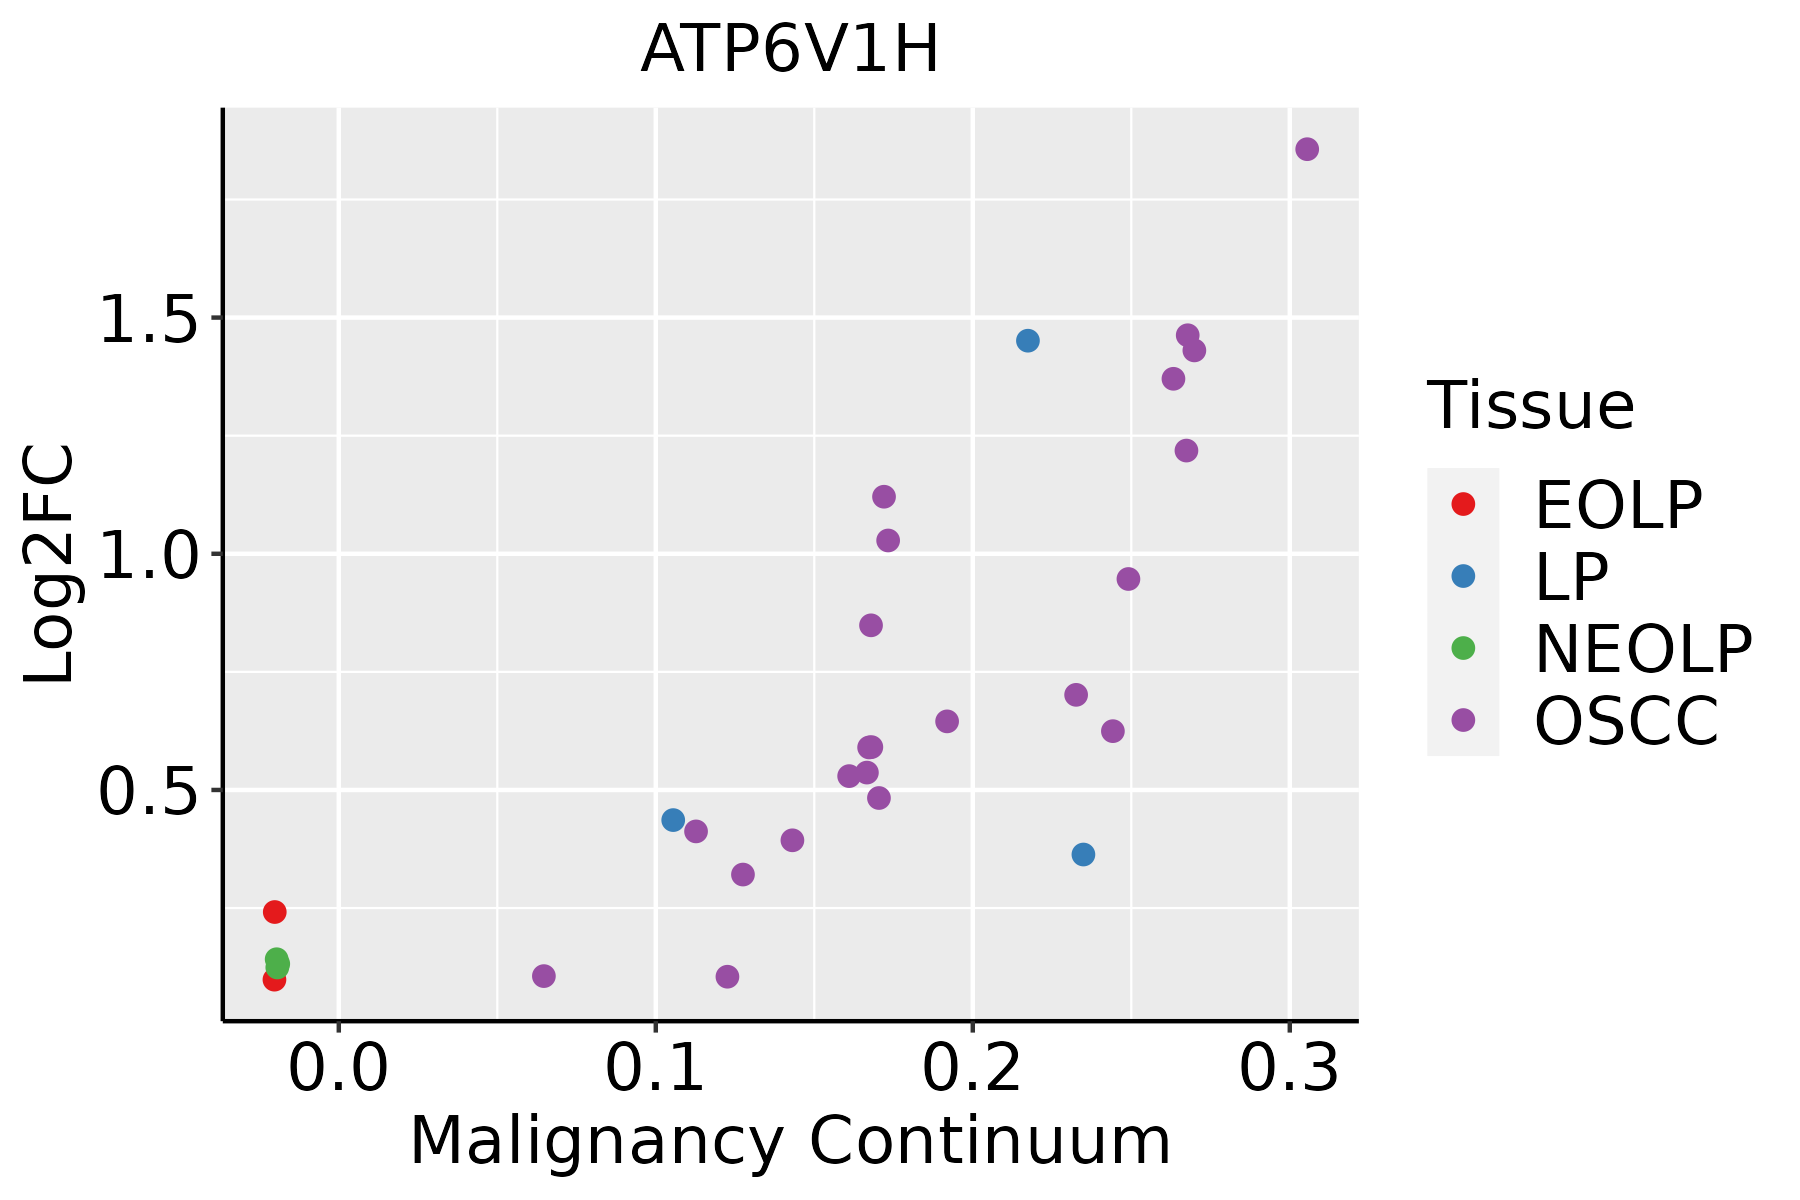 | EOLP: Erosive Oral lichen planus |
| LP: leukoplakia | ||
| NEOLP: Non-erosive oral lichen planus | ||
| OSCC: Oral squamous cell carcinoma | ||
| Skin | 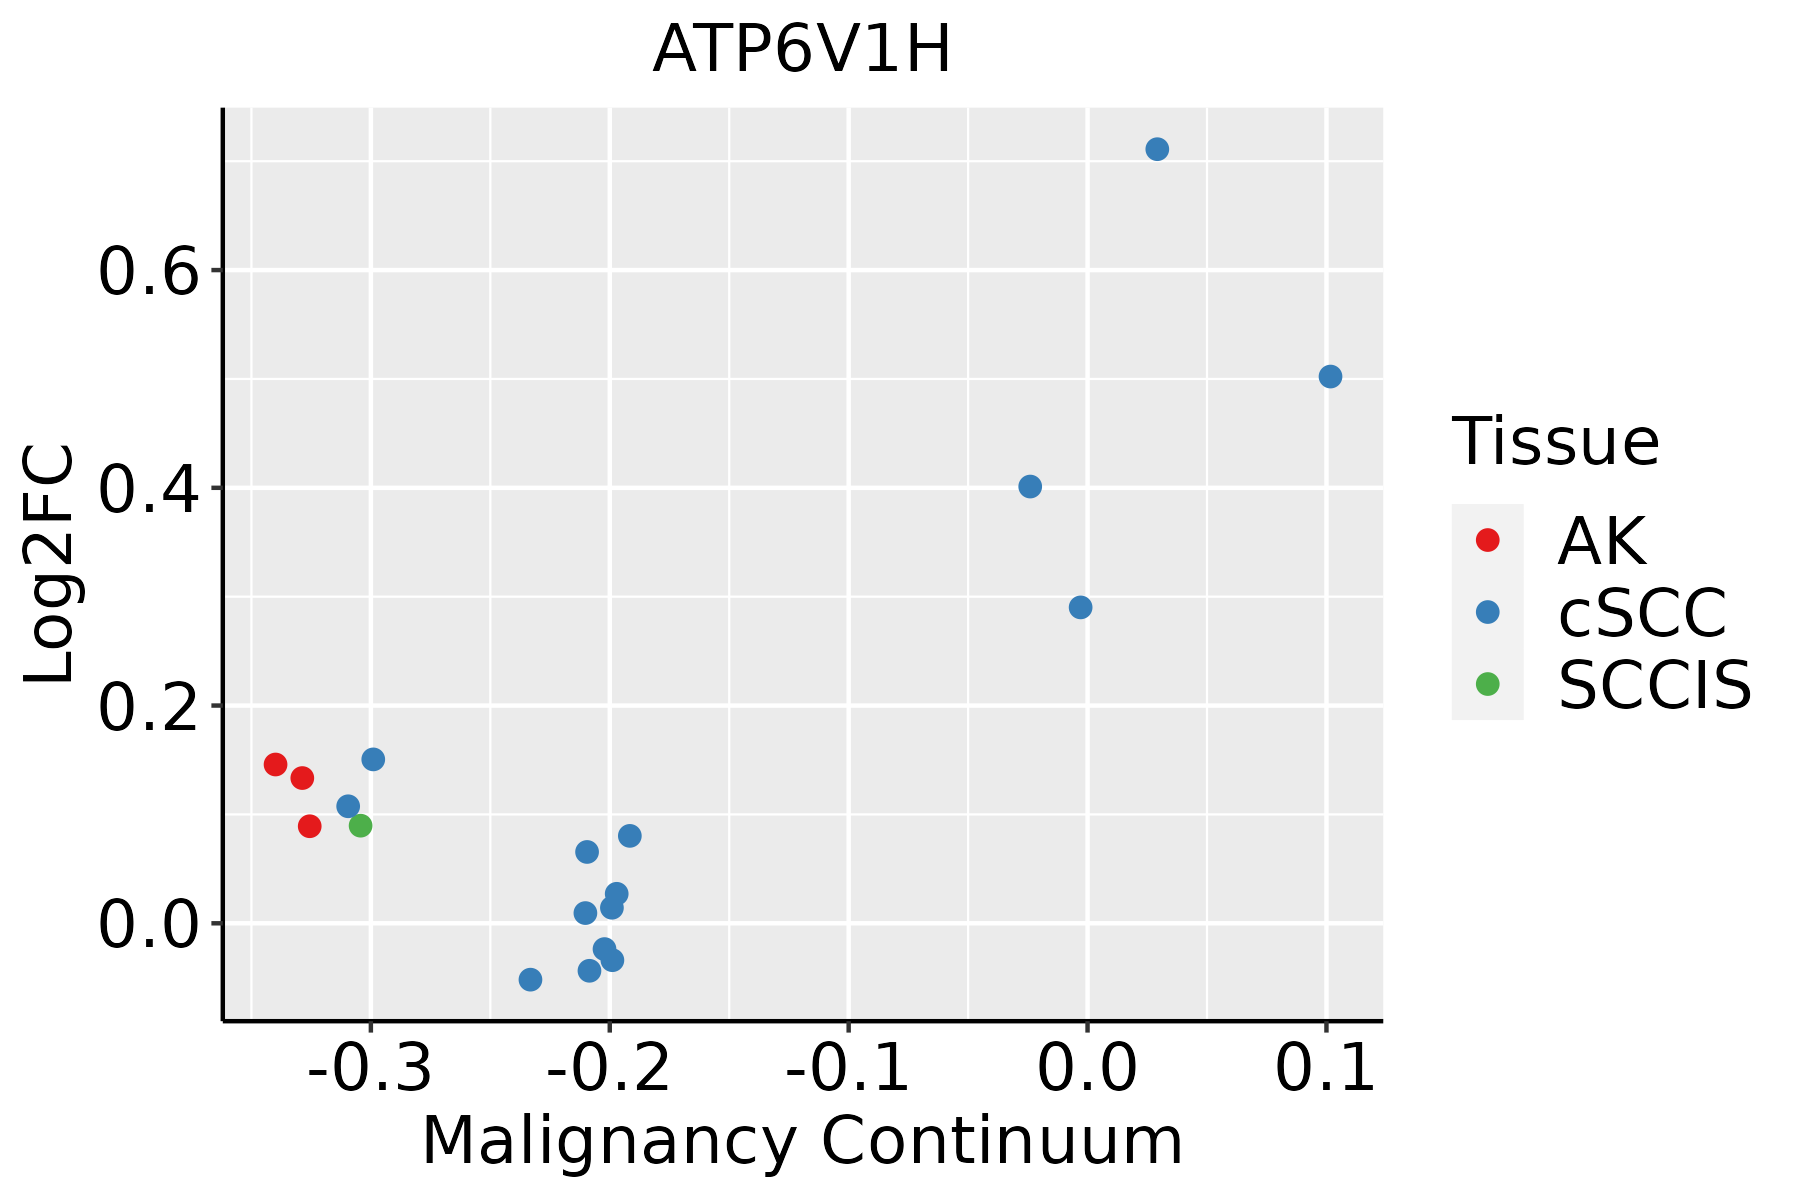 | AK: Actinic keratosis |
| cSCC: Cutaneous squamous cell carcinoma | ||
| SCCIS:squamous cell carcinoma in situ | ||
| Thyroid | 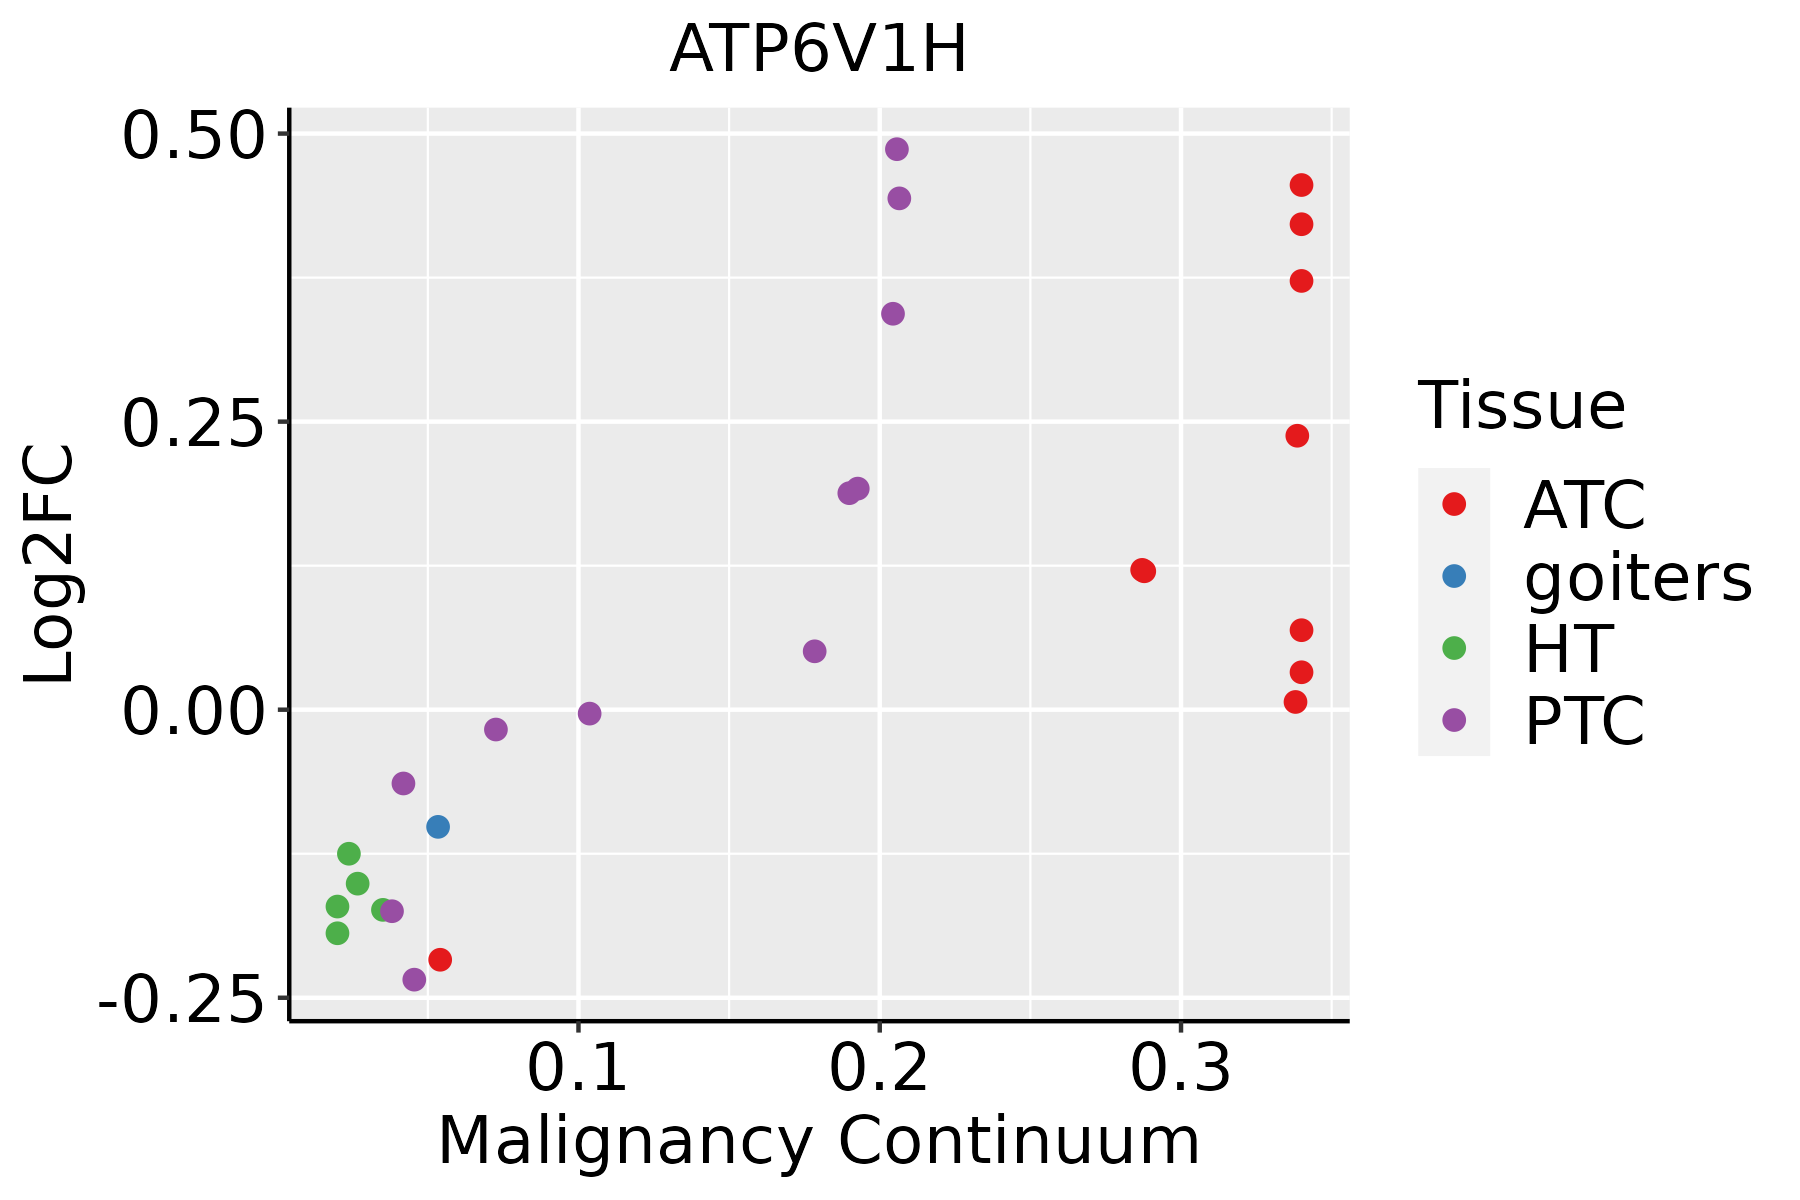 | ATC: Anaplastic thyroid cancer |
| HT: Hashimoto's thyroiditis | ||
| PTC: Papillary thyroid cancer |
| ∗log2FC in expression of this searched gene in stem-like cells from each diseased tissue sample relative to stem-like cells in normal samples in each tissue plotted against the malignancy continuum. Samples are colored based on if they are from different disease stage. |
Top |
Malignant transformation related pathway analysis |
| Find out the enriched GO biological processes and KEGG pathways involved in transition from healthy to precancer to cancer |
| Tissue | Disease Stage | Enriched GO biological Processes |
| Colorectum | AD |  |
| Colorectum | SER |  |
| Colorectum | MSS |  |
| Colorectum | MSI-H |  |
| Colorectum | FAP |  |
| ∗Top 15 enriched GO BP terms are showed in the bar plot of each disease state in each tissue. Each row represents a significant GO biological process which is colored according to the -log10(p.adjust). |
| Page: 1 2 3 4 5 6 7 8 9 |
| GO ID | Tissue | Disease Stage | Description | Gene Ratio | Bg Ratio | pvalue | p.adjust | Count |
| GO:19026009 | Cervix | CC | proton transmembrane transport | 39/2311 | 157/18723 | 1.23e-05 | 2.57e-04 | 39 |
| GO:00162367 | Cervix | CC | macroautophagy | 58/2311 | 291/18723 | 1.40e-04 | 1.70e-03 | 58 |
| GO:00105067 | Cervix | CC | regulation of autophagy | 61/2311 | 317/18723 | 2.61e-04 | 2.87e-03 | 61 |
| GO:001623617 | Esophagus | ESCC | macroautophagy | 216/8552 | 291/18723 | 1.94e-23 | 4.57e-21 | 216 |
| GO:001050617 | Esophagus | ESCC | regulation of autophagy | 220/8552 | 317/18723 | 6.72e-18 | 6.36e-16 | 220 |
| GO:001624114 | Esophagus | ESCC | regulation of macroautophagy | 102/8552 | 141/18723 | 1.09e-10 | 3.27e-09 | 102 |
| GO:00070353 | Esophagus | ESCC | vacuolar acidification | 20/8552 | 24/18723 | 1.69e-04 | 1.11e-03 | 20 |
| GO:00514521 | Esophagus | ESCC | intracellular pH reduction | 29/8552 | 42/18723 | 1.87e-03 | 8.46e-03 | 29 |
| GO:00458511 | Esophagus | ESCC | pH reduction | 31/8552 | 46/18723 | 2.42e-03 | 1.06e-02 | 31 |
| GO:190260018 | Esophagus | ESCC | proton transmembrane transport | 88/8552 | 157/18723 | 5.62e-03 | 2.10e-02 | 88 |
| GO:00105065 | Liver | NAFLD | regulation of autophagy | 57/1882 | 317/18723 | 1.00e-05 | 3.18e-04 | 57 |
| GO:00162365 | Liver | NAFLD | macroautophagy | 45/1882 | 291/18723 | 2.31e-03 | 2.19e-02 | 45 |
| GO:001623611 | Liver | Cirrhotic | macroautophagy | 129/4634 | 291/18723 | 1.75e-13 | 1.41e-11 | 129 |
| GO:001050611 | Liver | Cirrhotic | regulation of autophagy | 132/4634 | 317/18723 | 2.17e-11 | 1.33e-09 | 132 |
| GO:00162414 | Liver | Cirrhotic | regulation of macroautophagy | 60/4634 | 141/18723 | 2.57e-06 | 4.63e-05 | 60 |
| GO:0007035 | Liver | Cirrhotic | vacuolar acidification | 15/4634 | 24/18723 | 9.76e-05 | 1.03e-03 | 15 |
| GO:0051452 | Liver | Cirrhotic | intracellular pH reduction | 21/4634 | 42/18723 | 3.57e-04 | 3.03e-03 | 21 |
| GO:0045851 | Liver | Cirrhotic | pH reduction | 22/4634 | 46/18723 | 5.75e-04 | 4.48e-03 | 22 |
| GO:00300045 | Liver | Cirrhotic | cellular monovalent inorganic cation homeostasis | 38/4634 | 103/18723 | 4.02e-03 | 2.17e-02 | 38 |
| GO:00306415 | Liver | Cirrhotic | regulation of cellular pH | 31/4634 | 81/18723 | 4.76e-03 | 2.50e-02 | 31 |
| Page: 1 2 3 |
| Pathway ID | Tissue | Disease Stage | Description | Gene Ratio | Bg Ratio | pvalue | p.adjust | qvalue | Count |
| hsa0019018 | Cervix | CC | Oxidative phosphorylation | 64/1267 | 134/8465 | 1.25e-19 | 8.07e-18 | 4.77e-18 | 64 |
| hsa0414520 | Cervix | CC | Phagosome | 47/1267 | 152/8465 | 3.95e-07 | 4.26e-06 | 2.52e-06 | 47 |
| hsa051207 | Cervix | CC | Epithelial cell signaling in Helicobacter pylori infection | 24/1267 | 70/8465 | 4.35e-05 | 3.09e-04 | 1.83e-04 | 24 |
| hsa051657 | Cervix | CC | Human papillomavirus infection | 74/1267 | 331/8465 | 1.70e-04 | 1.02e-03 | 6.03e-04 | 74 |
| hsa0511016 | Cervix | CC | Vibrio cholerae infection | 18/1267 | 50/8465 | 1.91e-04 | 1.11e-03 | 6.55e-04 | 18 |
| hsa0532314 | Cervix | CC | Rheumatoid arthritis | 27/1267 | 93/8465 | 3.64e-04 | 1.82e-03 | 1.07e-03 | 27 |
| hsa05152 | Cervix | CC | Tuberculosis | 42/1267 | 180/8465 | 1.78e-03 | 7.21e-03 | 4.26e-03 | 42 |
| hsa0019019 | Cervix | CC | Oxidative phosphorylation | 64/1267 | 134/8465 | 1.25e-19 | 8.07e-18 | 4.77e-18 | 64 |
| hsa04145110 | Cervix | CC | Phagosome | 47/1267 | 152/8465 | 3.95e-07 | 4.26e-06 | 2.52e-06 | 47 |
| hsa0512014 | Cervix | CC | Epithelial cell signaling in Helicobacter pylori infection | 24/1267 | 70/8465 | 4.35e-05 | 3.09e-04 | 1.83e-04 | 24 |
| hsa0516512 | Cervix | CC | Human papillomavirus infection | 74/1267 | 331/8465 | 1.70e-04 | 1.02e-03 | 6.03e-04 | 74 |
| hsa0511017 | Cervix | CC | Vibrio cholerae infection | 18/1267 | 50/8465 | 1.91e-04 | 1.11e-03 | 6.55e-04 | 18 |
| hsa0532315 | Cervix | CC | Rheumatoid arthritis | 27/1267 | 93/8465 | 3.64e-04 | 1.82e-03 | 1.07e-03 | 27 |
| hsa051521 | Cervix | CC | Tuberculosis | 42/1267 | 180/8465 | 1.78e-03 | 7.21e-03 | 4.26e-03 | 42 |
| hsa00190210 | Esophagus | ESCC | Oxidative phosphorylation | 104/4205 | 134/8465 | 2.04e-11 | 2.98e-10 | 1.53e-10 | 104 |
| hsa0414222 | Esophagus | ESCC | Lysosome | 102/4205 | 132/8465 | 5.11e-11 | 7.13e-10 | 3.65e-10 | 102 |
| hsa0516510 | Esophagus | ESCC | Human papillomavirus infection | 215/4205 | 331/8465 | 7.86e-09 | 7.12e-08 | 3.65e-08 | 215 |
| hsa0512018 | Esophagus | ESCC | Epithelial cell signaling in Helicobacter pylori infection | 52/4205 | 70/8465 | 2.17e-05 | 1.07e-04 | 5.47e-05 | 52 |
| hsa0414530 | Esophagus | ESCC | Phagosome | 100/4205 | 152/8465 | 3.81e-05 | 1.72e-04 | 8.82e-05 | 100 |
| hsa041505 | Esophagus | ESCC | mTOR signaling pathway | 98/4205 | 156/8465 | 5.81e-04 | 1.95e-03 | 9.97e-04 | 98 |
| Page: 1 2 3 4 5 6 |
Top |
Cell-cell communication analysis |
| Identification of potential cell-cell interactions between two cell types and their ligand-receptor pairs for different disease states |
| Ligand | Receptor | LRpair | Pathway | Tissue | Disease Stage |
| Page: 1 |
Top |
Single-cell gene regulatory network inference analysis |
| Find out the significant the regulons (TFs) and the target genes of each regulon across cell types for different disease states |
| TF | Cell Type | Tissue | Disease Stage | Target Gene | RSS | Regulon Activity |
| ∗The dot plots of a searched regulon are shown for all cell subpopulations in each disease state of each tissue based on the regulon specific score inferred using pySCENIC and by calculating the average expression. |
| Page: 1 |
Top |
Somatic mutation of malignant transformation related genes |
| Annotation of somatic variants for genes involved in malignant transformation |
| Hugo Symbol | Variant Class | Variant Classification | dbSNP RS | HGVSc | HGVSp | HGVSp Short | SWISSPROT | BIOTYPE | SIFT | PolyPhen | Tumor Sample Barcode | Tissue | Histology | Sex | Age | Stage | Therapy Types | Drugs | Outcome |
| ATP6V1H | SNV | Missense_Mutation | rs371234673 | c.868C>T | p.Arg290Cys | p.R290C | Q9UI12 | protein_coding | deleterious(0) | probably_damaging(0.969) | TCGA-C8-A135-01 | Breast | breast invasive carcinoma | Female | <65 | I/II | Chemotherapy | 5-fluorouracil | CR |
| ATP6V1H | deletion | Frame_Shift_Del | novel | c.1088_1095delGGTTGGAA | p.Arg363MetfsTer8 | p.R363Mfs*8 | Q9UI12 | protein_coding | TCGA-A7-A6VX-01 | Breast | breast invasive carcinoma | Female | >=65 | I/II | Chemotherapy | docetaxel | CR | ||
| ATP6V1H | SNV | Missense_Mutation | rs770965453 | c.1277G>A | p.Arg426Gln | p.R426Q | Q9UI12 | protein_coding | tolerated(0.71) | benign(0.069) | TCGA-A6-6781-01 | Colorectum | colon adenocarcinoma | Male | <65 | III/IV | Chemotherapy | oxaliplatin | SD |
| ATP6V1H | SNV | Missense_Mutation | c.935N>A | p.Cys312Tyr | p.C312Y | Q9UI12 | protein_coding | tolerated(0.08) | possibly_damaging(0.823) | TCGA-AA-3672-01 | Colorectum | colon adenocarcinoma | Female | >=65 | III/IV | Unknown | Unknown | SD | |
| ATP6V1H | SNV | Missense_Mutation | rs753497464 | c.997N>A | p.Glu333Lys | p.E333K | Q9UI12 | protein_coding | deleterious(0.03) | benign(0.364) | TCGA-AA-3984-01 | Colorectum | colon adenocarcinoma | Female | <65 | I/II | Unknown | Unknown | SD |
| ATP6V1H | SNV | Missense_Mutation | novel | c.143N>G | p.Glu48Gly | p.E48G | Q9UI12 | protein_coding | deleterious(0.03) | benign(0.326) | TCGA-CA-6717-01 | Colorectum | colon adenocarcinoma | Male | <65 | I/II | Chemotherapy | oxaliplatin | CR |
| ATP6V1H | SNV | Missense_Mutation | c.928N>G | p.Ile310Val | p.I310V | Q9UI12 | protein_coding | tolerated(1) | benign(0.169) | TCGA-F4-6570-01 | Colorectum | colon adenocarcinoma | Female | >=65 | I/II | Unknown | Unknown | SD | |
| ATP6V1H | SNV | Missense_Mutation | rs562675599 | c.320N>A | p.Arg107His | p.R107H | Q9UI12 | protein_coding | deleterious(0.01) | possibly_damaging(0.828) | TCGA-EI-6514-01 | Colorectum | rectum adenocarcinoma | Female | <65 | I/II | Chemotherapy | 5-fu | SD |
| ATP6V1H | SNV | Missense_Mutation | rs770394341 | c.584C>T | p.Ser195Leu | p.S195L | Q9UI12 | protein_coding | deleterious(0) | benign(0.422) | TCGA-EI-6917-01 | Colorectum | rectum adenocarcinoma | Male | <65 | III/IV | Chemotherapy | 5fluorouracil+oxaciplatina+l-folinian | SD |
| ATP6V1H | SNV | Missense_Mutation | c.643N>T | p.Arg215Cys | p.R215C | Q9UI12 | protein_coding | deleterious(0) | probably_damaging(1) | TCGA-A5-A0G9-01 | Endometrium | uterine corpus endometrioid carcinoma | Female | >=65 | I/II | Unknown | Unknown | SD |
| Page: 1 2 3 4 5 6 |
Top |
Related drugs of malignant transformation related genes |
| Identification of chemicals and drugs interact with genes involved in malignant transfromation |
| (DGIdb 4.0) |
| Entrez ID | Symbol | Category | Interaction Types | Drug Claim Name | Drug Name | PMIDs |
| Page: 1 |

Copyright 2023-Present -The University of Texas Health Science Center at Houston |