
|
|||||
|
 | |
| |
| |
| |
| |
| |
|
Gene: ATP6V1D |
Gene summary for ATP6V1D |
| Gene information | Species | Human | Gene symbol | ATP6V1D | Gene ID | 51382 |
| Gene name | ATPase H+ transporting V1 subunit D | |
| Gene Alias | ATP6M | |
| Cytomap | 14q23.3 | |
| Gene Type | protein-coding | GO ID | GO:0006810 | UniProtAcc | A0A024R683 |
Top |
Malignant transformation analysis |
| Identification of the aberrant gene expression in precancerous and cancerous lesions by comparing the gene expression of stem-like cells in diseased tissues with normal stem cells |
| Entrez ID | Symbol | Replicates | Species | Organ | Tissue | Adj P-value | Log2FC | Malignancy |
| 51382 | ATP6V1D | C46 | Human | Oral cavity | OSCC | 6.74e-31 | 7.44e-01 | 0.1673 |
| 51382 | ATP6V1D | C51 | Human | Oral cavity | OSCC | 1.28e-22 | 1.14e+00 | 0.2674 |
| 51382 | ATP6V1D | C57 | Human | Oral cavity | OSCC | 3.68e-29 | 9.94e-01 | 0.1679 |
| 51382 | ATP6V1D | C06 | Human | Oral cavity | OSCC | 2.87e-13 | 2.28e+00 | 0.2699 |
| 51382 | ATP6V1D | C07 | Human | Oral cavity | OSCC | 6.17e-03 | 1.07e+00 | 0.2491 |
| 51382 | ATP6V1D | C08 | Human | Oral cavity | OSCC | 4.31e-36 | 8.93e-01 | 0.1919 |
| 51382 | ATP6V1D | C09 | Human | Oral cavity | OSCC | 2.82e-06 | 4.53e-01 | 0.1431 |
| 51382 | ATP6V1D | LN22 | Human | Oral cavity | OSCC | 6.17e-05 | 1.01e+00 | 0.1733 |
| 51382 | ATP6V1D | LN46 | Human | Oral cavity | OSCC | 5.18e-07 | 5.65e-01 | 0.1666 |
| 51382 | ATP6V1D | LP15 | Human | Oral cavity | LP | 1.76e-05 | 1.37e+00 | 0.2174 |
| 51382 | ATP6V1D | LP17 | Human | Oral cavity | LP | 5.93e-05 | 1.15e+00 | 0.2349 |
| 51382 | ATP6V1D | SYSMH1 | Human | Oral cavity | OSCC | 1.79e-18 | 4.84e-01 | 0.1127 |
| 51382 | ATP6V1D | SYSMH2 | Human | Oral cavity | OSCC | 6.66e-24 | 1.14e+00 | 0.2326 |
| 51382 | ATP6V1D | SYSMH3 | Human | Oral cavity | OSCC | 1.38e-34 | 1.12e+00 | 0.2442 |
| 51382 | ATP6V1D | SYSMH4 | Human | Oral cavity | OSCC | 3.32e-03 | 8.58e-02 | 0.1226 |
| 51382 | ATP6V1D | SYSMH5 | Human | Oral cavity | OSCC | 7.77e-13 | 7.26e-01 | 0.0647 |
| 51382 | ATP6V1D | SYSMH6 | Human | Oral cavity | OSCC | 3.76e-10 | 4.72e-01 | 0.1275 |
| 51382 | ATP6V1D | GSM5252130_BPH340PrGF_Via | Human | Prostate | BPH | 6.26e-12 | 4.86e-01 | -0.1972 |
| 51382 | ATP6V1D | GSM5252131_BPH340PrSF_Via | Human | Prostate | BPH | 2.26e-02 | 2.99e-01 | -0.2126 |
| 51382 | ATP6V1D | GSM5252132_BPH389PrGF | Human | Prostate | BPH | 1.49e-06 | 6.75e-01 | -0.2247 |
| Page: 1 2 3 4 5 6 7 |
| Tissue | Expression Dynamics | Abbreviation |
| Esophagus | 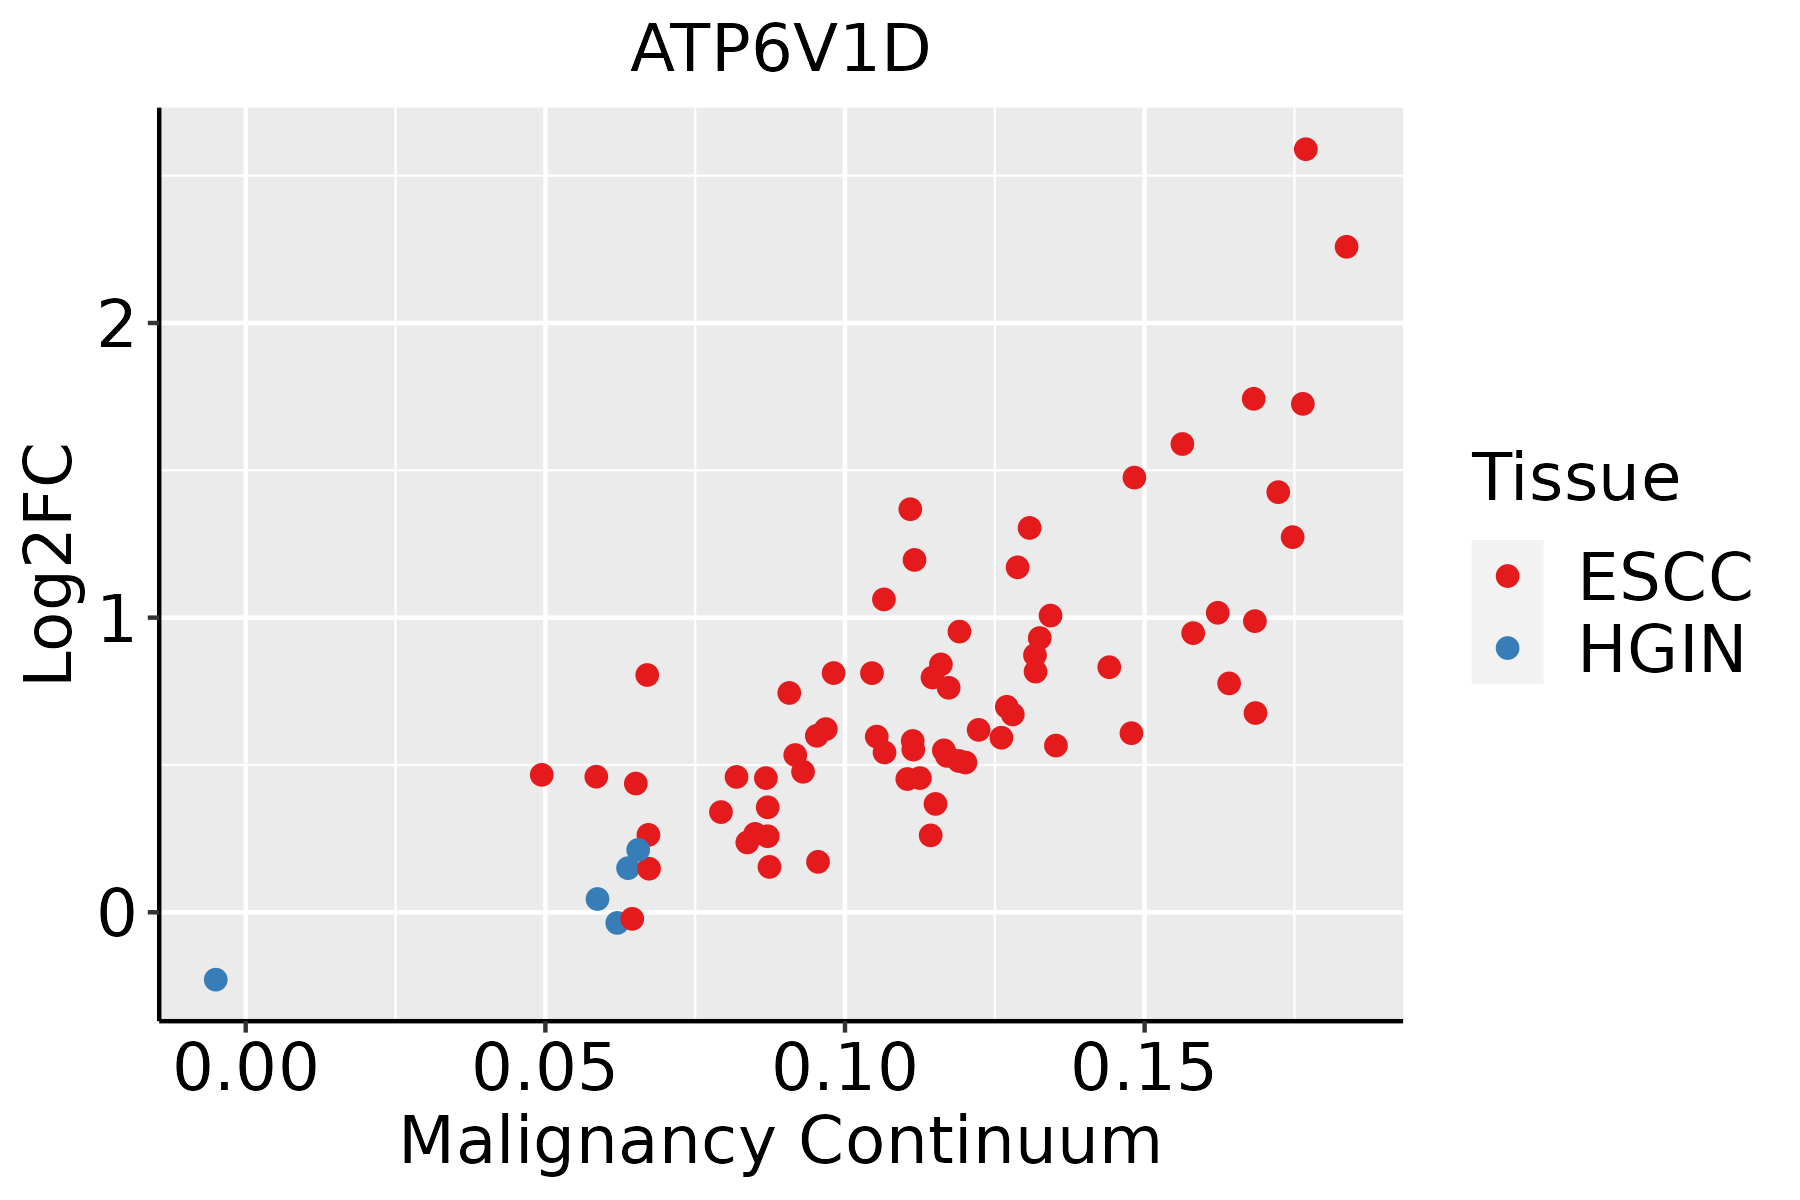 | ESCC: Esophageal squamous cell carcinoma |
| HGIN: High-grade intraepithelial neoplasias | ||
| LGIN: Low-grade intraepithelial neoplasias | ||
| Liver | 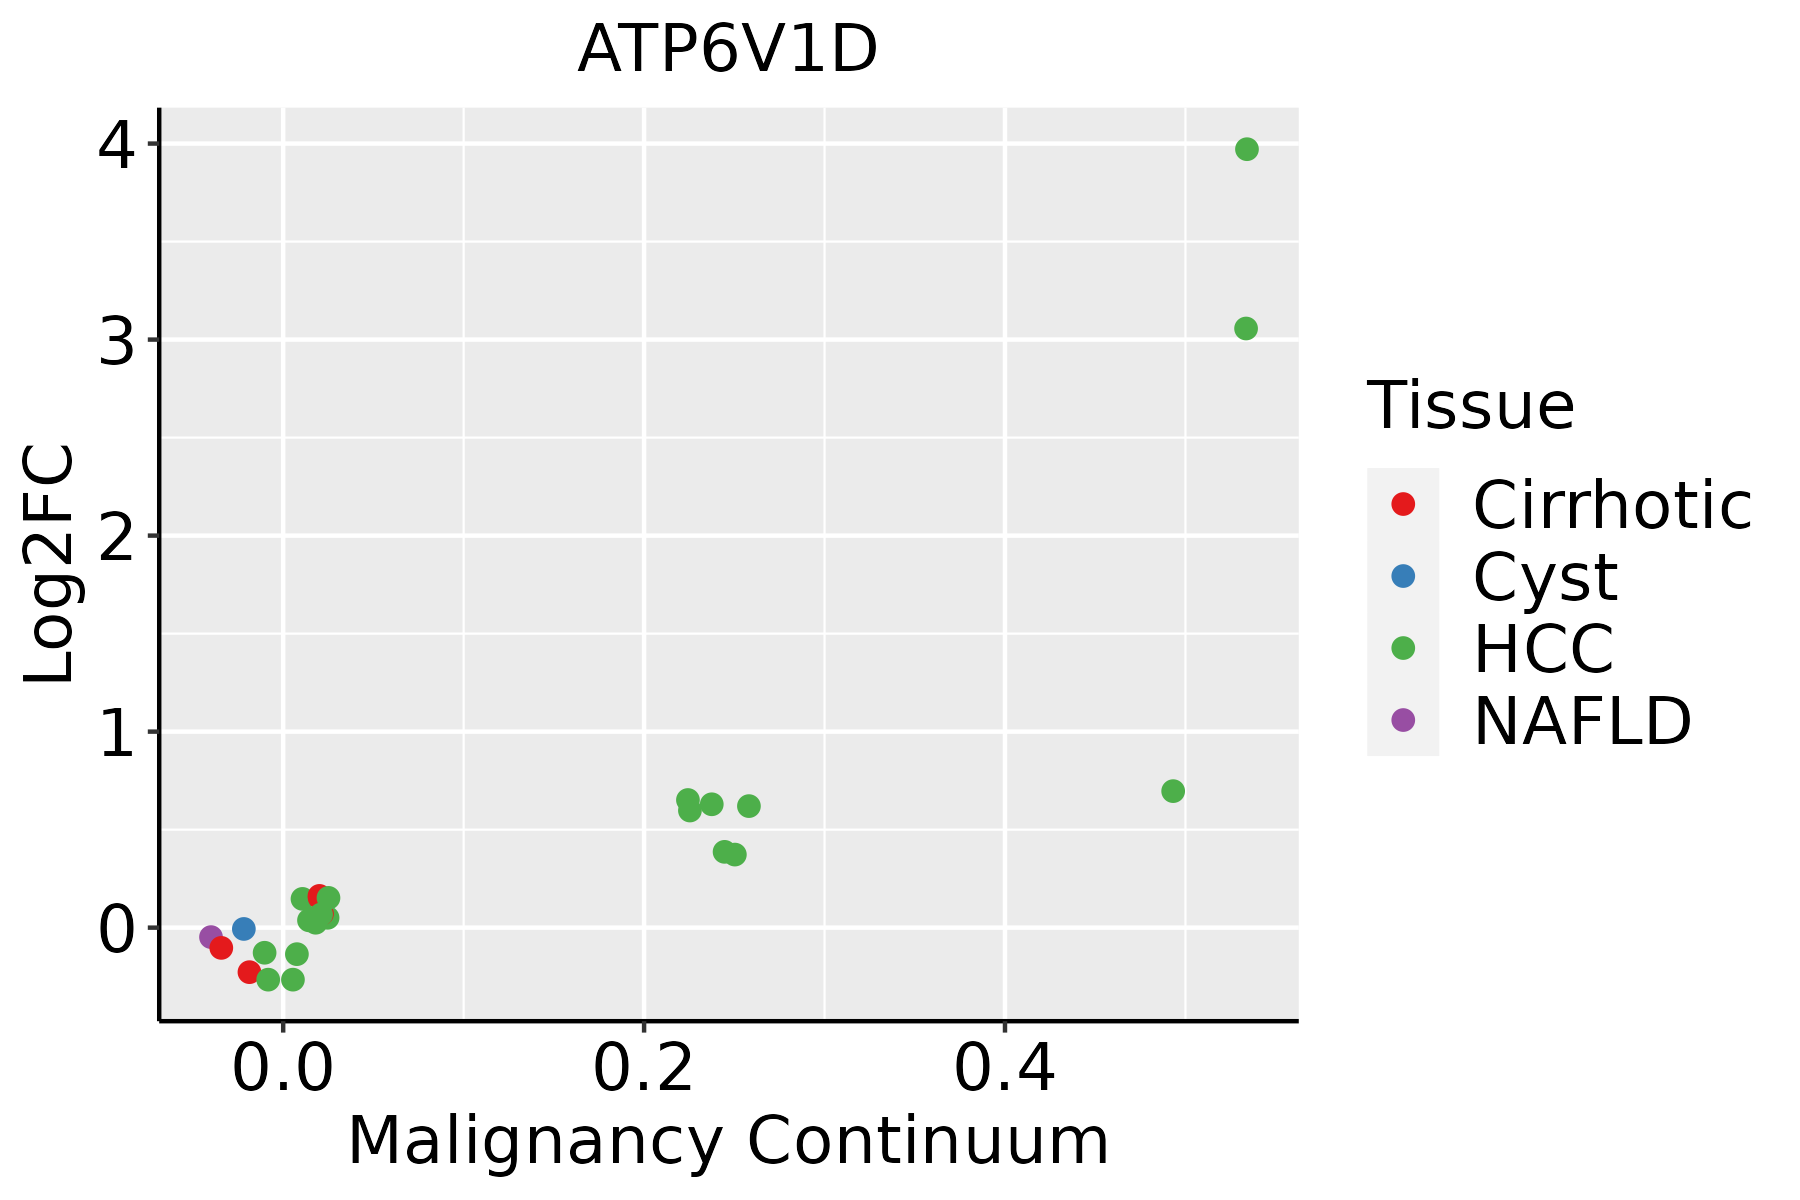 | HCC: Hepatocellular carcinoma |
| NAFLD: Non-alcoholic fatty liver disease | ||
| Oral Cavity |  | EOLP: Erosive Oral lichen planus |
| LP: leukoplakia | ||
| NEOLP: Non-erosive oral lichen planus | ||
| OSCC: Oral squamous cell carcinoma | ||
| Prostate | 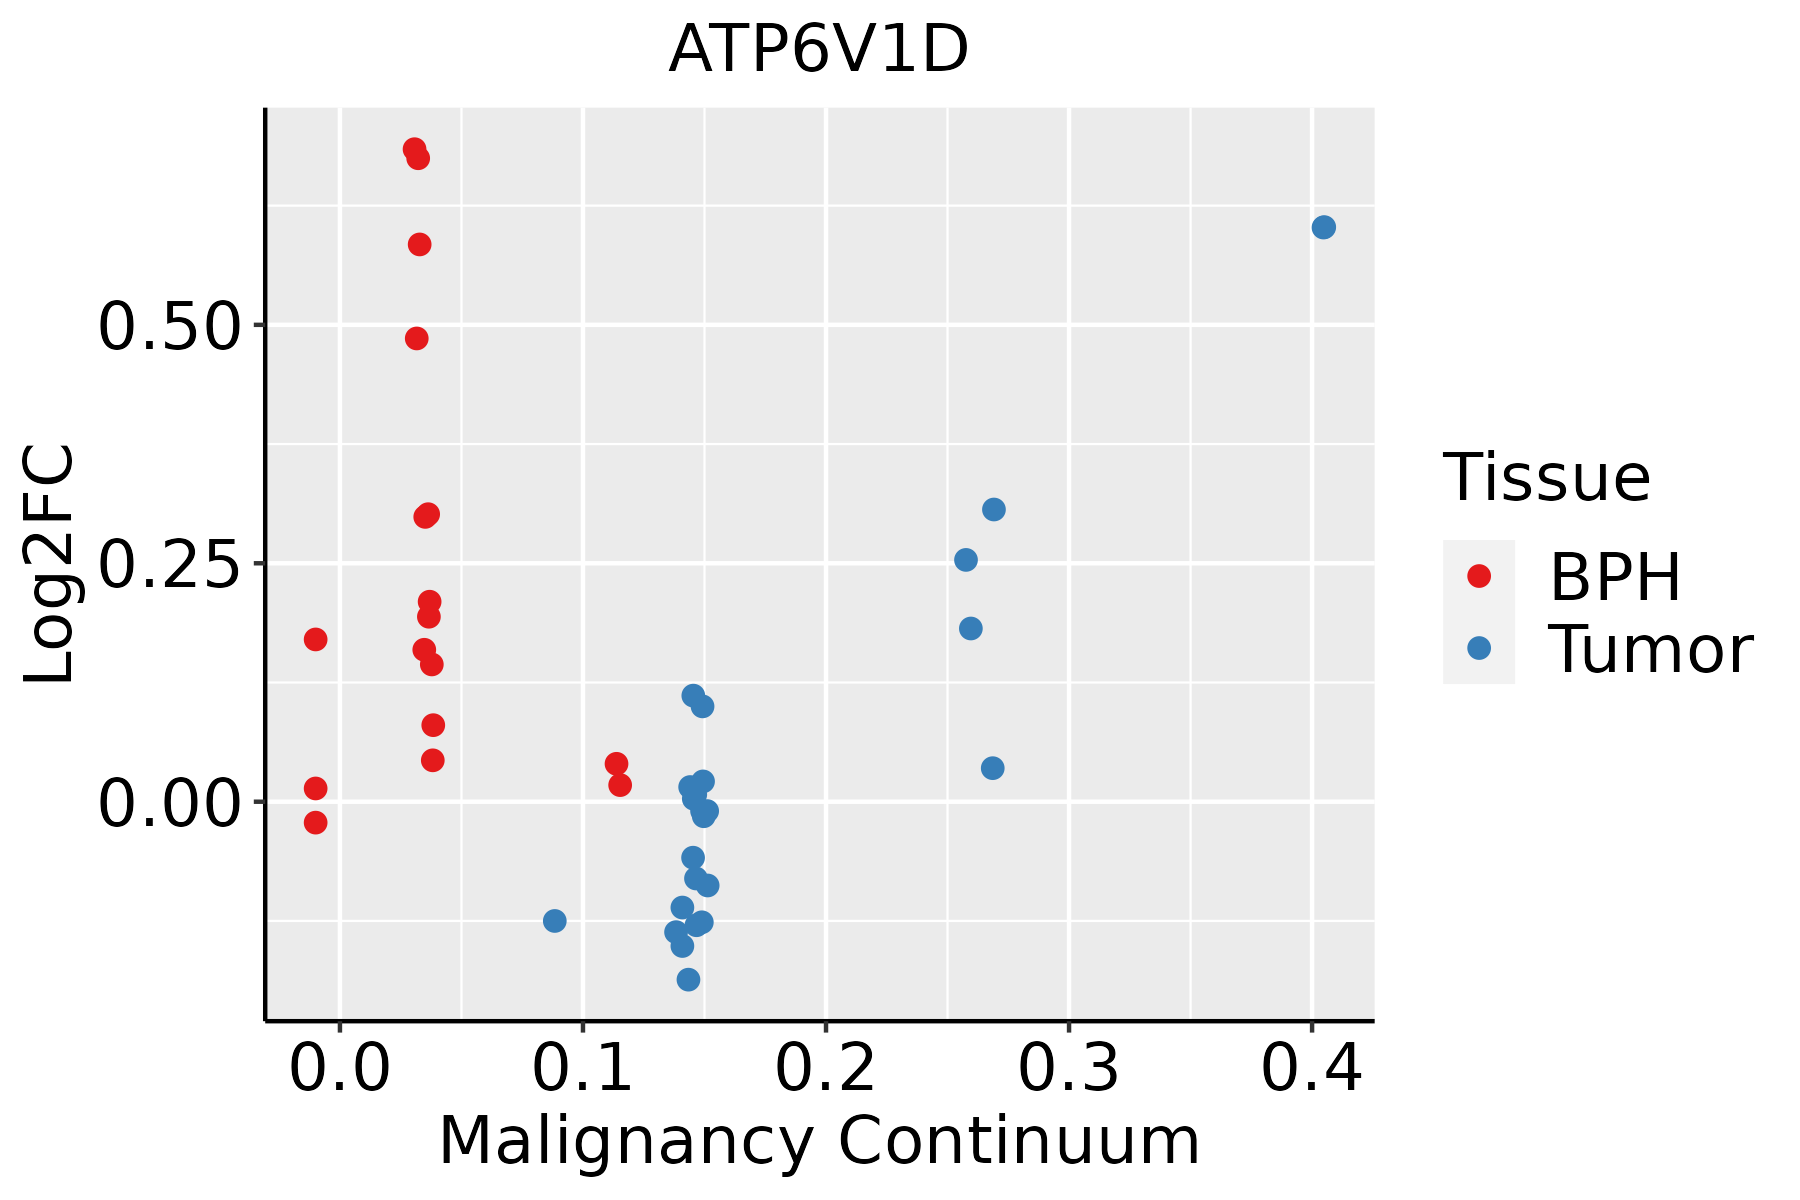 | BPH: Benign Prostatic Hyperplasia |
| Skin | 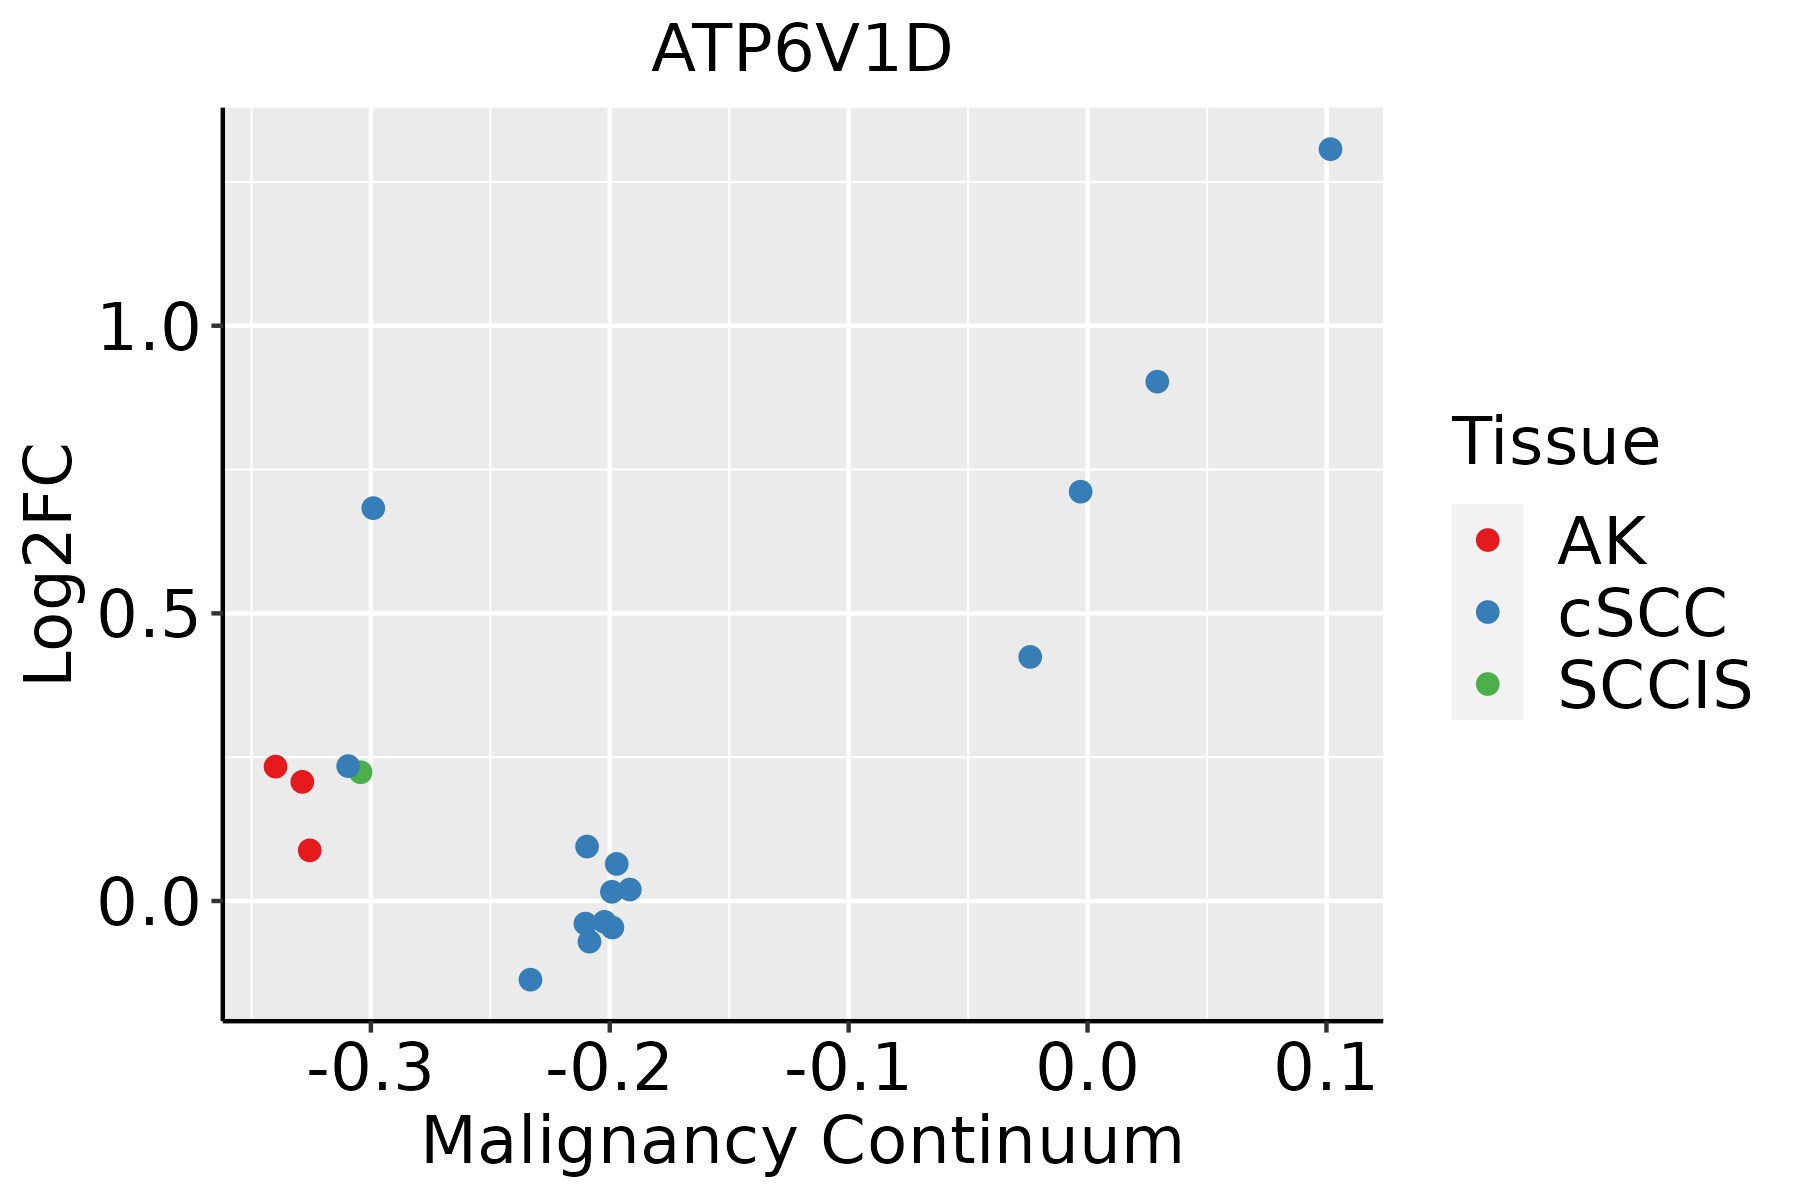 | AK: Actinic keratosis |
| cSCC: Cutaneous squamous cell carcinoma | ||
| SCCIS:squamous cell carcinoma in situ | ||
| Thyroid |  | ATC: Anaplastic thyroid cancer |
| HT: Hashimoto's thyroiditis | ||
| PTC: Papillary thyroid cancer |
| ∗log2FC in expression of this searched gene in stem-like cells from each diseased tissue sample relative to stem-like cells in normal samples in each tissue plotted against the malignancy continuum. Samples are colored based on if they are from different disease stage. |
Top |
Malignant transformation related pathway analysis |
| Find out the enriched GO biological processes and KEGG pathways involved in transition from healthy to precancer to cancer |
| Tissue | Disease Stage | Enriched GO biological Processes |
| Colorectum | AD |  |
| Colorectum | SER |  |
| Colorectum | MSS |  |
| Colorectum | MSI-H |  |
| Colorectum | FAP |  |
| ∗Top 15 enriched GO BP terms are showed in the bar plot of each disease state in each tissue. Each row represents a significant GO biological process which is colored according to the -log10(p.adjust). |
| Page: 1 2 3 4 5 6 7 8 9 |
| GO ID | Tissue | Disease Stage | Description | Gene Ratio | Bg Ratio | pvalue | p.adjust | Count |
| GO:001623617 | Esophagus | ESCC | macroautophagy | 216/8552 | 291/18723 | 1.94e-23 | 4.57e-21 | 216 |
| GO:001050617 | Esophagus | ESCC | regulation of autophagy | 220/8552 | 317/18723 | 6.72e-18 | 6.36e-16 | 220 |
| GO:001624114 | Esophagus | ESCC | regulation of macroautophagy | 102/8552 | 141/18723 | 1.09e-10 | 3.27e-09 | 102 |
| GO:190260018 | Esophagus | ESCC | proton transmembrane transport | 88/8552 | 157/18723 | 5.62e-03 | 2.10e-02 | 88 |
| GO:001623611 | Liver | Cirrhotic | macroautophagy | 129/4634 | 291/18723 | 1.75e-13 | 1.41e-11 | 129 |
| GO:001050611 | Liver | Cirrhotic | regulation of autophagy | 132/4634 | 317/18723 | 2.17e-11 | 1.33e-09 | 132 |
| GO:00162414 | Liver | Cirrhotic | regulation of macroautophagy | 60/4634 | 141/18723 | 2.57e-06 | 4.63e-05 | 60 |
| GO:001623621 | Liver | HCC | macroautophagy | 204/7958 | 291/18723 | 8.66e-22 | 1.41e-19 | 204 |
| GO:001050621 | Liver | HCC | regulation of autophagy | 210/7958 | 317/18723 | 7.59e-18 | 8.45e-16 | 210 |
| GO:001624111 | Liver | HCC | regulation of macroautophagy | 96/7958 | 141/18723 | 6.82e-10 | 2.14e-08 | 96 |
| GO:19026007 | Liver | HCC | proton transmembrane transport | 87/7958 | 157/18723 | 7.27e-04 | 4.42e-03 | 87 |
| GO:001623610 | Oral cavity | OSCC | macroautophagy | 192/7305 | 291/18723 | 7.01e-21 | 1.14e-18 | 192 |
| GO:001050610 | Oral cavity | OSCC | regulation of autophagy | 198/7305 | 317/18723 | 1.63e-17 | 1.51e-15 | 198 |
| GO:00162417 | Oral cavity | OSCC | regulation of macroautophagy | 96/7305 | 141/18723 | 2.33e-12 | 9.75e-11 | 96 |
| GO:001623615 | Oral cavity | LP | macroautophagy | 135/4623 | 291/18723 | 4.71e-16 | 6.70e-14 | 135 |
| GO:001050615 | Oral cavity | LP | regulation of autophagy | 132/4623 | 317/18723 | 1.82e-11 | 1.28e-09 | 132 |
| GO:001624113 | Oral cavity | LP | regulation of macroautophagy | 61/4623 | 141/18723 | 1.00e-06 | 2.50e-05 | 61 |
| GO:00162369 | Prostate | BPH | macroautophagy | 85/3107 | 291/18723 | 4.68e-08 | 1.29e-06 | 85 |
| GO:190260015 | Prostate | BPH | proton transmembrane transport | 52/3107 | 157/18723 | 2.81e-07 | 6.06e-06 | 52 |
| GO:00105069 | Prostate | BPH | regulation of autophagy | 86/3107 | 317/18723 | 1.29e-06 | 2.24e-05 | 86 |
| Page: 1 2 |
| Pathway ID | Tissue | Disease Stage | Description | Gene Ratio | Bg Ratio | pvalue | p.adjust | qvalue | Count |
| hsa00190210 | Esophagus | ESCC | Oxidative phosphorylation | 104/4205 | 134/8465 | 2.04e-11 | 2.98e-10 | 1.53e-10 | 104 |
| hsa0516510 | Esophagus | ESCC | Human papillomavirus infection | 215/4205 | 331/8465 | 7.86e-09 | 7.12e-08 | 3.65e-08 | 215 |
| hsa0512018 | Esophagus | ESCC | Epithelial cell signaling in Helicobacter pylori infection | 52/4205 | 70/8465 | 2.17e-05 | 1.07e-04 | 5.47e-05 | 52 |
| hsa0414530 | Esophagus | ESCC | Phagosome | 100/4205 | 152/8465 | 3.81e-05 | 1.72e-04 | 8.82e-05 | 100 |
| hsa041505 | Esophagus | ESCC | mTOR signaling pathway | 98/4205 | 156/8465 | 5.81e-04 | 1.95e-03 | 9.97e-04 | 98 |
| hsa0532320 | Esophagus | ESCC | Rheumatoid arthritis | 59/4205 | 93/8465 | 4.98e-03 | 1.27e-02 | 6.52e-03 | 59 |
| hsa0511028 | Esophagus | ESCC | Vibrio cholerae infection | 34/4205 | 50/8465 | 6.62e-03 | 1.62e-02 | 8.30e-03 | 34 |
| hsa0019038 | Esophagus | ESCC | Oxidative phosphorylation | 104/4205 | 134/8465 | 2.04e-11 | 2.98e-10 | 1.53e-10 | 104 |
| hsa0516515 | Esophagus | ESCC | Human papillomavirus infection | 215/4205 | 331/8465 | 7.86e-09 | 7.12e-08 | 3.65e-08 | 215 |
| hsa0512019 | Esophagus | ESCC | Epithelial cell signaling in Helicobacter pylori infection | 52/4205 | 70/8465 | 2.17e-05 | 1.07e-04 | 5.47e-05 | 52 |
| hsa04145114 | Esophagus | ESCC | Phagosome | 100/4205 | 152/8465 | 3.81e-05 | 1.72e-04 | 8.82e-05 | 100 |
| hsa0415013 | Esophagus | ESCC | mTOR signaling pathway | 98/4205 | 156/8465 | 5.81e-04 | 1.95e-03 | 9.97e-04 | 98 |
| hsa05323110 | Esophagus | ESCC | Rheumatoid arthritis | 59/4205 | 93/8465 | 4.98e-03 | 1.27e-02 | 6.52e-03 | 59 |
| hsa05110112 | Esophagus | ESCC | Vibrio cholerae infection | 34/4205 | 50/8465 | 6.62e-03 | 1.62e-02 | 8.30e-03 | 34 |
| hsa0019014 | Liver | Cirrhotic | Oxidative phosphorylation | 83/2530 | 134/8465 | 1.03e-14 | 3.44e-13 | 2.12e-13 | 83 |
| hsa0414514 | Liver | Cirrhotic | Phagosome | 73/2530 | 152/8465 | 1.61e-06 | 1.78e-05 | 1.10e-05 | 73 |
| hsa0511010 | Liver | Cirrhotic | Vibrio cholerae infection | 29/2530 | 50/8465 | 3.19e-05 | 2.47e-04 | 1.52e-04 | 29 |
| hsa051204 | Liver | Cirrhotic | Epithelial cell signaling in Helicobacter pylori infection | 34/2530 | 70/8465 | 7.42e-04 | 4.33e-03 | 2.67e-03 | 34 |
| hsa05165 | Liver | Cirrhotic | Human papillomavirus infection | 124/2530 | 331/8465 | 1.55e-03 | 7.83e-03 | 4.83e-03 | 124 |
| hsa0532310 | Liver | Cirrhotic | Rheumatoid arthritis | 38/2530 | 93/8465 | 1.52e-02 | 4.57e-02 | 2.82e-02 | 38 |
| Page: 1 2 3 4 5 |
Top |
Cell-cell communication analysis |
| Identification of potential cell-cell interactions between two cell types and their ligand-receptor pairs for different disease states |
| Ligand | Receptor | LRpair | Pathway | Tissue | Disease Stage |
| Page: 1 |
Top |
Single-cell gene regulatory network inference analysis |
| Find out the significant the regulons (TFs) and the target genes of each regulon across cell types for different disease states |
| TF | Cell Type | Tissue | Disease Stage | Target Gene | RSS | Regulon Activity |
| ∗The dot plots of a searched regulon are shown for all cell subpopulations in each disease state of each tissue based on the regulon specific score inferred using pySCENIC and by calculating the average expression. |
| Page: 1 |
Top |
Somatic mutation of malignant transformation related genes |
| Annotation of somatic variants for genes involved in malignant transformation |
| Hugo Symbol | Variant Class | Variant Classification | dbSNP RS | HGVSc | HGVSp | HGVSp Short | SWISSPROT | BIOTYPE | SIFT | PolyPhen | Tumor Sample Barcode | Tissue | Histology | Sex | Age | Stage | Therapy Types | Drugs | Outcome |
| ATP6V1D | SNV | Missense_Mutation | novel | c.503N>A | p.Arg168His | p.R168H | Q9Y5K8 | protein_coding | deleterious(0.01) | probably_damaging(0.997) | TCGA-AN-A046-01 | Breast | breast invasive carcinoma | Female | >=65 | I/II | Unknown | Unknown | SD |
| ATP6V1D | SNV | Missense_Mutation | c.461C>G | p.Ser154Cys | p.S154C | Q9Y5K8 | protein_coding | tolerated(0.07) | benign(0.412) | TCGA-D8-A27G-01 | Breast | breast invasive carcinoma | Female | >=65 | I/II | Unknown | Unknown | SD | |
| ATP6V1D | SNV | Missense_Mutation | novel | c.17N>A | p.Arg6Gln | p.R6Q | Q9Y5K8 | protein_coding | deleterious(0.05) | possibly_damaging(0.51) | TCGA-XX-A899-01 | Breast | breast invasive carcinoma | Female | <65 | III/IV | Chemotherapy | cytoxan | CR |
| ATP6V1D | insertion | Frame_Shift_Ins | novel | c.240-1_240insTCATAAAA | p.Thr81HisfsTer15 | p.T81Hfs*15 | Q9Y5K8 | protein_coding | TCGA-AN-A0FX-01 | Breast | breast invasive carcinoma | Female | <65 | I/II | Unknown | Unknown | SD | ||
| ATP6V1D | SNV | Missense_Mutation | c.211N>A | p.Glu71Lys | p.E71K | Q9Y5K8 | protein_coding | deleterious(0.04) | benign(0.119) | TCGA-AZ-6600-01 | Colorectum | colon adenocarcinoma | Male | <65 | III/IV | Chemotherapy | cpt-11 | PD | |
| ATP6V1D | SNV | Missense_Mutation | novel | c.314N>A | p.Thr105Asn | p.T105N | Q9Y5K8 | protein_coding | tolerated(0.32) | benign(0.033) | TCGA-DM-A1D0-01 | Colorectum | colon adenocarcinoma | Female | >=65 | I/II | Unknown | Unknown | SD |
| ATP6V1D | SNV | Missense_Mutation | novel | c.512C>T | p.Ala171Val | p.A171V | Q9Y5K8 | protein_coding | deleterious(0) | probably_damaging(0.996) | TCGA-A5-A0G1-01 | Endometrium | uterine corpus endometrioid carcinoma | Female | >=65 | I/II | Unknown | Unknown | SD |
| ATP6V1D | SNV | Missense_Mutation | novel | c.726G>T | p.Glu242Asp | p.E242D | Q9Y5K8 | protein_coding | tolerated(0.23) | benign(0.007) | TCGA-A5-A0G2-01 | Endometrium | uterine corpus endometrioid carcinoma | Female | <65 | III/IV | Unknown | Unknown | SD |
| ATP6V1D | SNV | Missense_Mutation | novel | c.456G>T | p.Gln152His | p.Q152H | Q9Y5K8 | protein_coding | deleterious(0) | probably_damaging(0.996) | TCGA-A5-A1OF-01 | Endometrium | uterine corpus endometrioid carcinoma | Female | <65 | I/II | Unknown | Unknown | SD |
| ATP6V1D | SNV | Missense_Mutation | novel | c.178N>A | p.Glu60Lys | p.E60K | Q9Y5K8 | protein_coding | tolerated(0.23) | benign(0.059) | TCGA-AJ-A3NE-01 | Endometrium | uterine corpus endometrioid carcinoma | Female | <65 | I/II | Unknown | Unknown | SD |
| Page: 1 2 3 |
Top |
Related drugs of malignant transformation related genes |
| Identification of chemicals and drugs interact with genes involved in malignant transfromation |
| (DGIdb 4.0) |
| Entrez ID | Symbol | Category | Interaction Types | Drug Claim Name | Drug Name | PMIDs |
| Page: 1 |

Copyright 2023-Present -The University of Texas Health Science Center at Houston |