
|
|||||
|
 | |
| |
| |
| |
| |
| |
|
Gene: ATP13A3 |
Gene summary for ATP13A3 |
| Gene information | Species | Human | Gene symbol | ATP13A3 | Gene ID | 79572 |
| Gene name | ATPase 13A3 | |
| Gene Alias | AFURS1 | |
| Cytomap | 3q29 | |
| Gene Type | protein-coding | GO ID | GO:0006810 | UniProtAcc | Q9H7F0 |
Top |
Malignant transformation analysis |
| Identification of the aberrant gene expression in precancerous and cancerous lesions by comparing the gene expression of stem-like cells in diseased tissues with normal stem cells |
| Entrez ID | Symbol | Replicates | Species | Organ | Tissue | Adj P-value | Log2FC | Malignancy |
| 79572 | ATP13A3 | Pt13.b | Human | Liver | HCC | 2.39e-02 | -8.06e-02 | 0.0251 |
| 79572 | ATP13A3 | Pt14.a | Human | Liver | HCC | 9.08e-07 | 3.31e-01 | 0.0169 |
| 79572 | ATP13A3 | S014 | Human | Liver | HCC | 5.36e-03 | 3.27e-01 | 0.2254 |
| 79572 | ATP13A3 | S015 | Human | Liver | HCC | 6.02e-03 | 3.63e-01 | 0.2375 |
| 79572 | ATP13A3 | S016 | Human | Liver | HCC | 2.05e-06 | 3.89e-01 | 0.2243 |
| 79572 | ATP13A3 | S027 | Human | Liver | HCC | 1.43e-06 | 8.05e-01 | 0.2446 |
| 79572 | ATP13A3 | S028 | Human | Liver | HCC | 1.83e-09 | 6.52e-01 | 0.2503 |
| 79572 | ATP13A3 | S029 | Human | Liver | HCC | 2.37e-14 | 8.62e-01 | 0.2581 |
| 79572 | ATP13A3 | C04 | Human | Oral cavity | OSCC | 3.52e-16 | 9.21e-01 | 0.2633 |
| 79572 | ATP13A3 | C21 | Human | Oral cavity | OSCC | 6.82e-21 | 7.64e-01 | 0.2678 |
| 79572 | ATP13A3 | C30 | Human | Oral cavity | OSCC | 4.26e-15 | 9.12e-01 | 0.3055 |
| 79572 | ATP13A3 | C43 | Human | Oral cavity | OSCC | 1.58e-08 | 3.71e-02 | 0.1704 |
| 79572 | ATP13A3 | C46 | Human | Oral cavity | OSCC | 2.65e-02 | 1.45e-01 | 0.1673 |
| 79572 | ATP13A3 | C51 | Human | Oral cavity | OSCC | 6.64e-09 | 6.40e-01 | 0.2674 |
| 79572 | ATP13A3 | C57 | Human | Oral cavity | OSCC | 2.78e-06 | 3.15e-01 | 0.1679 |
| 79572 | ATP13A3 | C06 | Human | Oral cavity | OSCC | 8.04e-07 | 1.40e+00 | 0.2699 |
| 79572 | ATP13A3 | C08 | Human | Oral cavity | OSCC | 1.79e-08 | 2.18e-01 | 0.1919 |
| 79572 | ATP13A3 | LN22 | Human | Oral cavity | OSCC | 3.33e-06 | 8.48e-01 | 0.1733 |
| 79572 | ATP13A3 | EOLP-1 | Human | Oral cavity | EOLP | 3.72e-05 | 3.39e-01 | -0.0202 |
| 79572 | ATP13A3 | NEOLP-1 | Human | Oral cavity | NEOLP | 8.09e-10 | 5.14e-01 | -0.0194 |
| Page: 1 2 3 4 5 6 7 8 |
| Tissue | Expression Dynamics | Abbreviation |
| Cervix |  | CC: Cervix cancer |
| HSIL_HPV: HPV-infected high-grade squamous intraepithelial lesions | ||
| N_HPV: HPV-infected normal cervix | ||
| Endometrium |  | AEH: Atypical endometrial hyperplasia |
| EEC: Endometrioid Cancer | ||
| Esophagus | 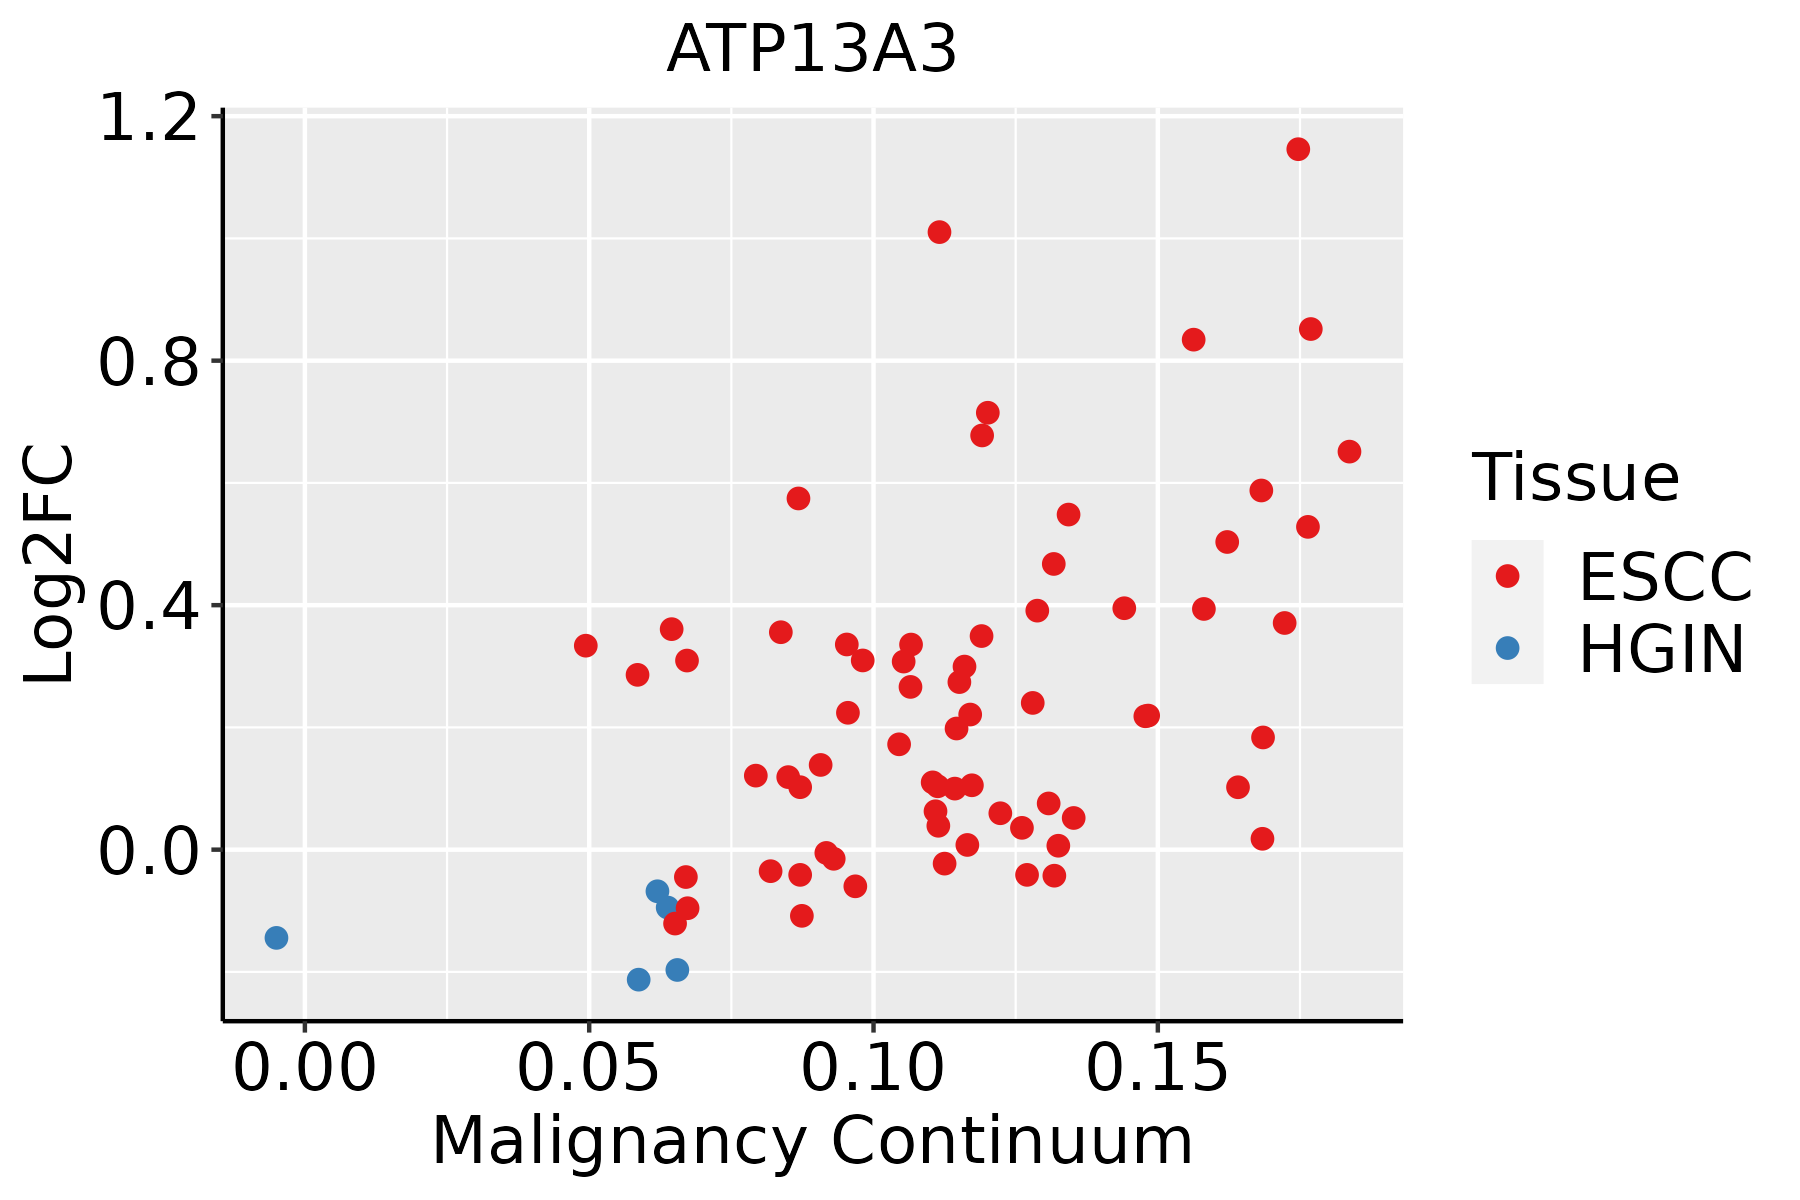 | ESCC: Esophageal squamous cell carcinoma |
| HGIN: High-grade intraepithelial neoplasias | ||
| LGIN: Low-grade intraepithelial neoplasias | ||
| Liver | 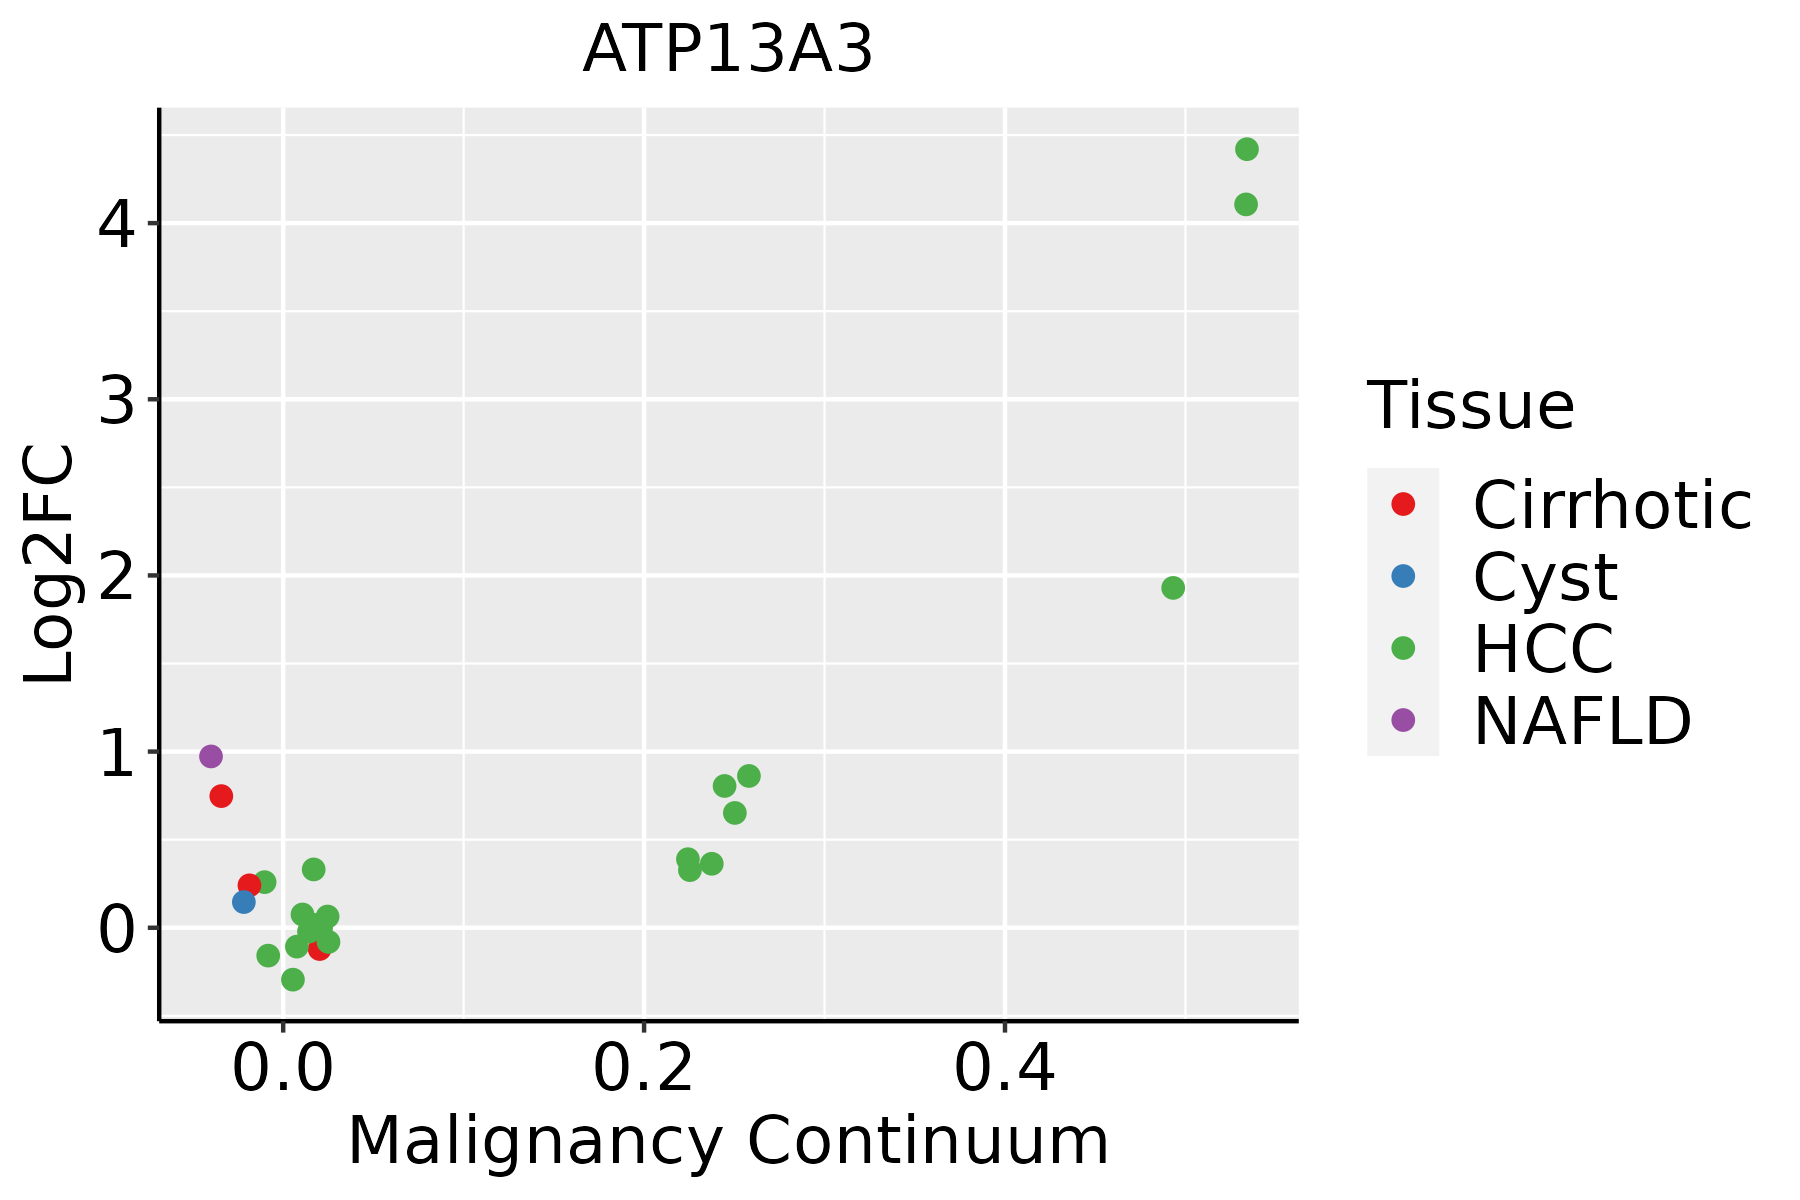 | HCC: Hepatocellular carcinoma |
| NAFLD: Non-alcoholic fatty liver disease | ||
| Oral Cavity | 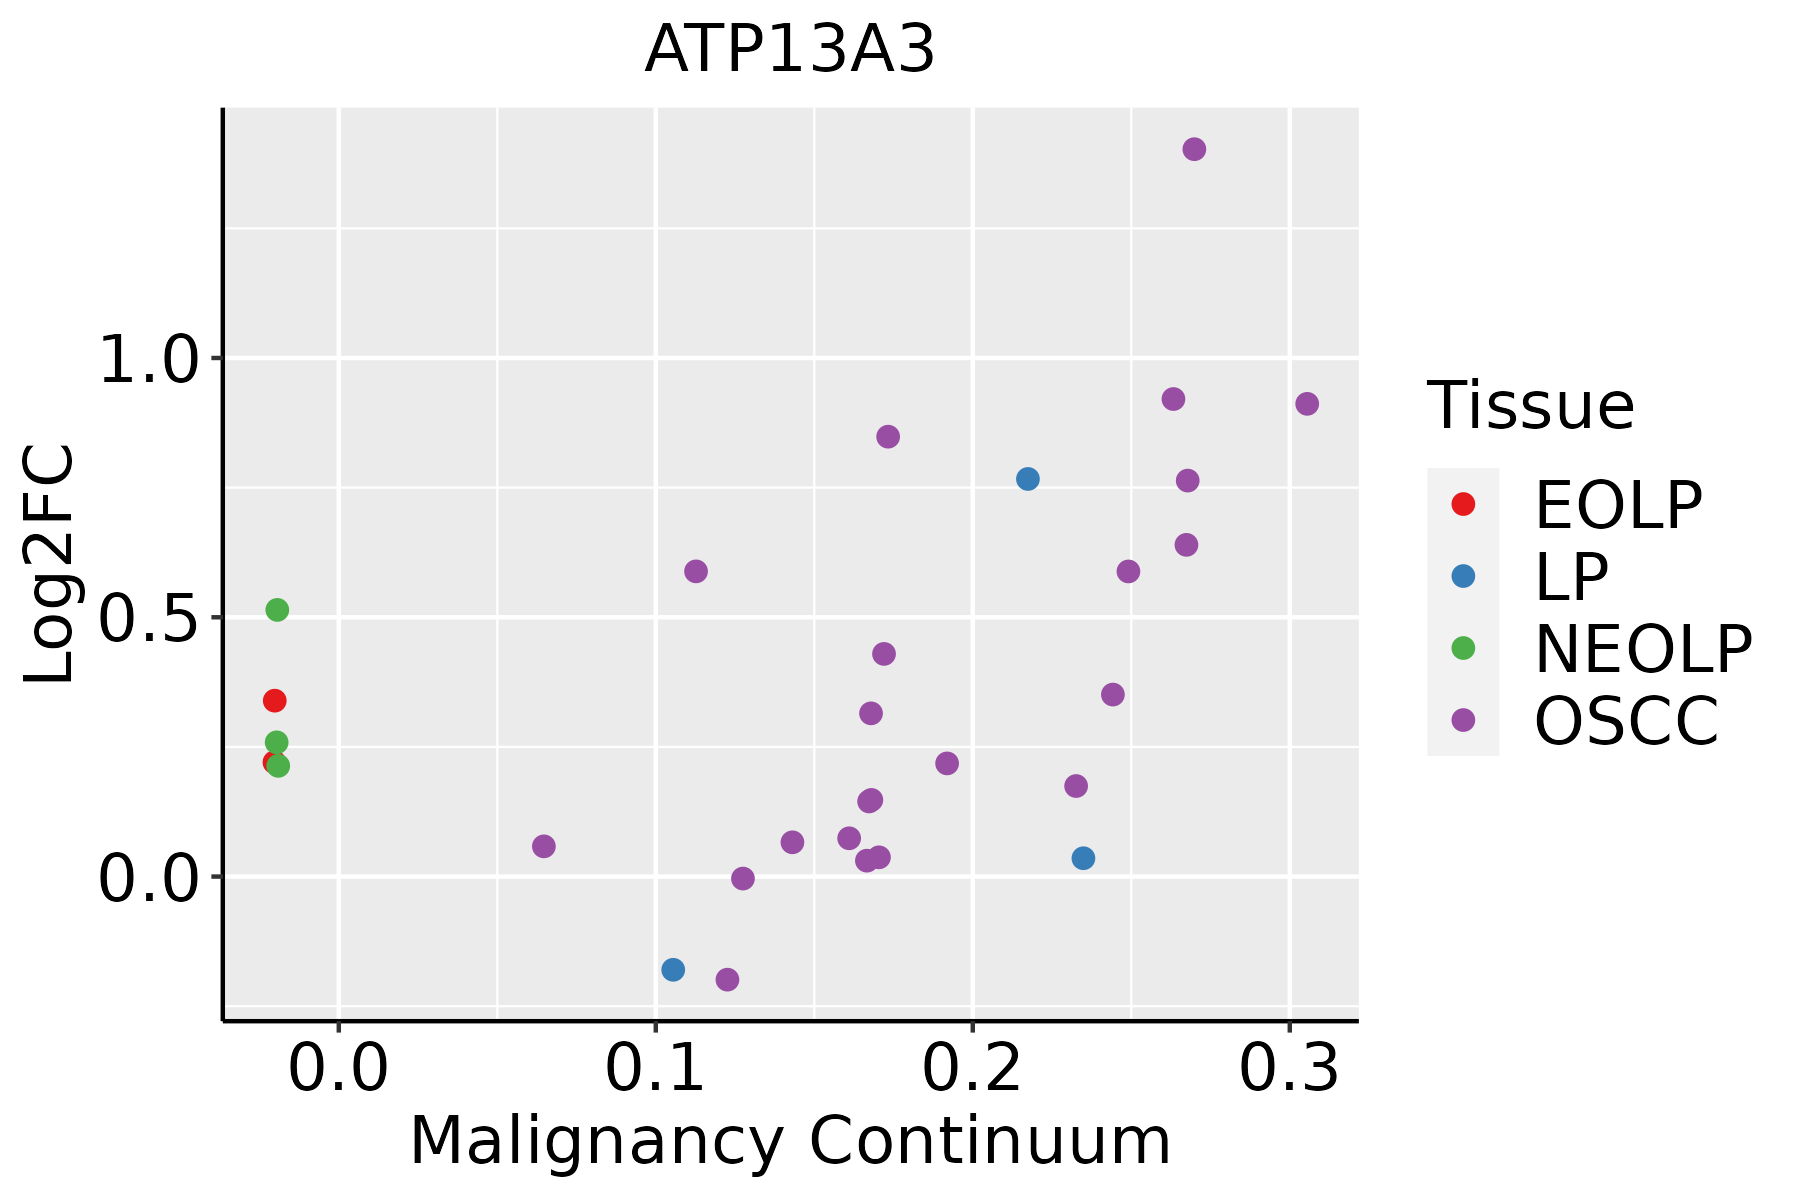 | EOLP: Erosive Oral lichen planus |
| LP: leukoplakia | ||
| NEOLP: Non-erosive oral lichen planus | ||
| OSCC: Oral squamous cell carcinoma | ||
| Prostate | 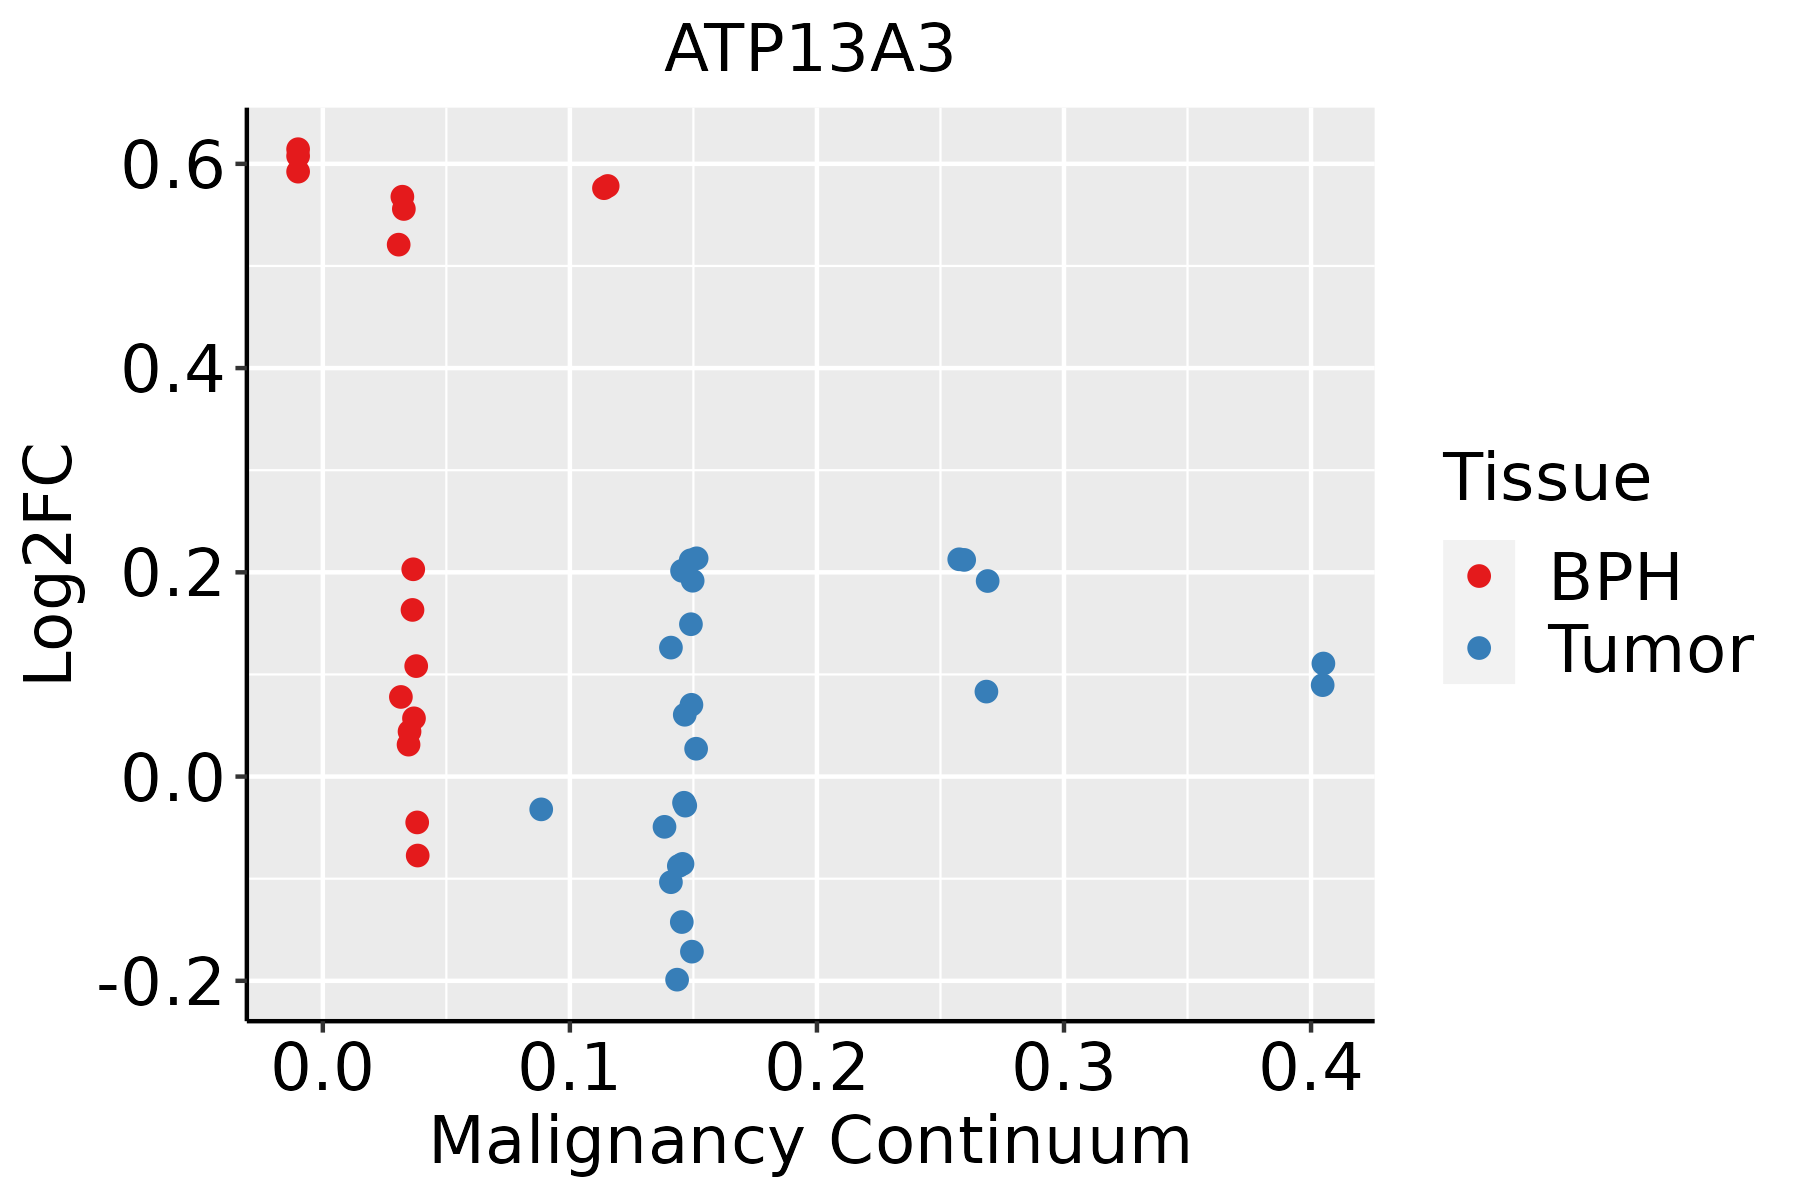 | BPH: Benign Prostatic Hyperplasia |
| Thyroid |  | ATC: Anaplastic thyroid cancer |
| HT: Hashimoto's thyroiditis | ||
| PTC: Papillary thyroid cancer |
| ∗log2FC in expression of this searched gene in stem-like cells from each diseased tissue sample relative to stem-like cells in normal samples in each tissue plotted against the malignancy continuum. Samples are colored based on if they are from different disease stage. |
Top |
Malignant transformation related pathway analysis |
| Find out the enriched GO biological processes and KEGG pathways involved in transition from healthy to precancer to cancer |
| Tissue | Disease Stage | Enriched GO biological Processes |
| Colorectum | AD |  |
| Colorectum | SER |  |
| Colorectum | MSS |  |
| Colorectum | MSI-H |  |
| Colorectum | FAP |  |
| ∗Top 15 enriched GO BP terms are showed in the bar plot of each disease state in each tissue. Each row represents a significant GO biological process which is colored according to the -log10(p.adjust). |
| Page: 1 2 3 4 5 6 7 8 9 |
| GO ID | Tissue | Disease Stage | Description | Gene Ratio | Bg Ratio | pvalue | p.adjust | Count |
| GO:00725032 | Oral cavity | EOLP | cellular divalent inorganic cation homeostasis | 75/2218 | 486/18723 | 9.77e-03 | 4.42e-02 | 75 |
| Page: 1 |
| Pathway ID | Tissue | Disease Stage | Description | Gene Ratio | Bg Ratio | pvalue | p.adjust | qvalue | Count |
| Page: 1 |
Top |
Cell-cell communication analysis |
| Identification of potential cell-cell interactions between two cell types and their ligand-receptor pairs for different disease states |
| Ligand | Receptor | LRpair | Pathway | Tissue | Disease Stage |
| Page: 1 |
Top |
Single-cell gene regulatory network inference analysis |
| Find out the significant the regulons (TFs) and the target genes of each regulon across cell types for different disease states |
| TF | Cell Type | Tissue | Disease Stage | Target Gene | RSS | Regulon Activity |
| ∗The dot plots of a searched regulon are shown for all cell subpopulations in each disease state of each tissue based on the regulon specific score inferred using pySCENIC and by calculating the average expression. |
| Page: 1 |
Top |
Somatic mutation of malignant transformation related genes |
| Annotation of somatic variants for genes involved in malignant transformation |
| Hugo Symbol | Variant Class | Variant Classification | dbSNP RS | HGVSc | HGVSp | HGVSp Short | SWISSPROT | BIOTYPE | SIFT | PolyPhen | Tumor Sample Barcode | Tissue | Histology | Sex | Age | Stage | Therapy Types | Drugs | Outcome |
| ATP13A3 | SNV | Missense_Mutation | novel | c.2949G>A | p.Met983Ile | p.M983I | Q9H7F0 | protein_coding | deleterious(0.03) | benign(0.04) | TCGA-5L-AAT1-01 | Breast | breast invasive carcinoma | Female | <65 | III/IV | Hormone Therapy | letrozol | SD |
| ATP13A3 | SNV | Missense_Mutation | novel | c.3428N>A | p.Arg1143His | p.R1143H | Q9H7F0 | protein_coding | deleterious(0) | probably_damaging(0.953) | TCGA-AN-A046-01 | Breast | breast invasive carcinoma | Female | >=65 | I/II | Unknown | Unknown | SD |
| ATP13A3 | SNV | Missense_Mutation | novel | c.3065N>A | p.Ser1022Tyr | p.S1022Y | Q9H7F0 | protein_coding | deleterious(0) | benign(0.003) | TCGA-AN-A046-01 | Breast | breast invasive carcinoma | Female | >=65 | I/II | Unknown | Unknown | SD |
| ATP13A3 | SNV | Missense_Mutation | novel | c.601C>T | p.Pro201Ser | p.P201S | Q9H7F0 | protein_coding | tolerated(0.07) | benign(0.18) | TCGA-AO-A0JB-01 | Breast | breast invasive carcinoma | Female | <65 | III/IV | Chemotherapy | cyclophosphamide | SD |
| ATP13A3 | SNV | Missense_Mutation | rs773074163 | c.1960G>A | p.Ala654Thr | p.A654T | Q9H7F0 | protein_coding | deleterious(0) | probably_damaging(0.986) | TCGA-AR-A0TX-01 | Breast | breast invasive carcinoma | Female | <65 | I/II | Unknown | Unknown | SD |
| ATP13A3 | SNV | Missense_Mutation | novel | c.3343T>C | p.Tyr1115His | p.Y1115H | Q9H7F0 | protein_coding | deleterious(0.05) | benign(0.289) | TCGA-AR-A0U2-01 | Breast | breast invasive carcinoma | Female | <65 | III/IV | Hormone Therapy | tamoxiphen | PD |
| ATP13A3 | SNV | Missense_Mutation | rs773710020 | c.3572N>T | p.Ala1191Val | p.A1191V | Q9H7F0 | protein_coding | tolerated(0.13) | possibly_damaging(0.709) | TCGA-D8-A1XQ-01 | Breast | breast invasive carcinoma | Female | >=65 | I/II | Unknown | Unknown | SD |
| ATP13A3 | SNV | Missense_Mutation | c.1262N>T | p.Ala421Val | p.A421V | Q9H7F0 | protein_coding | deleterious(0) | probably_damaging(0.999) | TCGA-D8-A1XQ-01 | Breast | breast invasive carcinoma | Female | >=65 | I/II | Unknown | Unknown | SD | |
| ATP13A3 | SNV | Missense_Mutation | novel | c.3329C>T | p.Ser1110Phe | p.S1110F | Q9H7F0 | protein_coding | tolerated(0.71) | possibly_damaging(0.498) | TCGA-D8-A73U-01 | Breast | breast invasive carcinoma | Female | >=65 | I/II | Hormone Therapy | tamoxiphen | SD |
| ATP13A3 | SNV | Missense_Mutation | c.2573G>A | p.Arg858His | p.R858H | Q9H7F0 | protein_coding | deleterious(0) | probably_damaging(1) | TCGA-E9-A1RF-01 | Breast | breast invasive carcinoma | Female | >=65 | III/IV | Hormone Therapy | tamoxiphen | SD |
| Page: 1 2 3 4 5 6 7 8 9 10 11 12 13 14 15 |
Top |
Related drugs of malignant transformation related genes |
| Identification of chemicals and drugs interact with genes involved in malignant transfromation |
| (DGIdb 4.0) |
| Entrez ID | Symbol | Category | Interaction Types | Drug Claim Name | Drug Name | PMIDs |
| Page: 1 |

Copyright 2023-Present -The University of Texas Health Science Center at Houston |