
|
|||||
|
 | |
| |
| |
| |
| |
| |
|
Gene: AP3S1 |
Gene summary for AP3S1 |
| Gene information | Species | Human | Gene symbol | AP3S1 | Gene ID | 1176 |
| Gene name | adaptor related protein complex 3 subunit sigma 1 | |
| Gene Alias | CLAPS3 | |
| Cytomap | 5q22.3-q23.1 | |
| Gene Type | protein-coding | GO ID | GO:0006810 | UniProtAcc | Q92572 |
Top |
Malignant transformation analysis |
| Identification of the aberrant gene expression in precancerous and cancerous lesions by comparing the gene expression of stem-like cells in diseased tissues with normal stem cells |
| Entrez ID | Symbol | Replicates | Species | Organ | Tissue | Adj P-value | Log2FC | Malignancy |
| 1176 | AP3S1 | P130T-E | Human | Esophagus | ESCC | 3.30e-79 | 2.24e+00 | 0.1676 |
| 1176 | AP3S1 | S43 | Human | Liver | Cirrhotic | 7.99e-11 | -2.22e-01 | -0.0187 |
| 1176 | AP3S1 | HCC1_Meng | Human | Liver | HCC | 3.93e-87 | 2.03e-01 | 0.0246 |
| 1176 | AP3S1 | HCC2_Meng | Human | Liver | HCC | 3.07e-29 | -1.46e-01 | 0.0107 |
| 1176 | AP3S1 | cirrhotic1 | Human | Liver | Cirrhotic | 9.88e-08 | 4.57e-02 | 0.0202 |
| 1176 | AP3S1 | cirrhotic2 | Human | Liver | Cirrhotic | 1.21e-09 | 1.12e-01 | 0.0201 |
| 1176 | AP3S1 | cirrhotic3 | Human | Liver | Cirrhotic | 6.72e-06 | 9.41e-02 | 0.0215 |
| 1176 | AP3S1 | HCC1 | Human | Liver | HCC | 2.51e-07 | 3.70e+00 | 0.5336 |
| 1176 | AP3S1 | HCC2 | Human | Liver | HCC | 5.13e-12 | 3.19e+00 | 0.5341 |
| 1176 | AP3S1 | Pt13.b | Human | Liver | HCC | 9.40e-20 | 3.00e-01 | 0.0251 |
| 1176 | AP3S1 | Pt14.b | Human | Liver | HCC | 1.93e-06 | 2.02e-01 | 0.018 |
| 1176 | AP3S1 | S014 | Human | Liver | HCC | 3.27e-26 | 1.21e+00 | 0.2254 |
| 1176 | AP3S1 | S015 | Human | Liver | HCC | 4.41e-18 | 1.53e+00 | 0.2375 |
| 1176 | AP3S1 | S016 | Human | Liver | HCC | 4.47e-23 | 1.24e+00 | 0.2243 |
| 1176 | AP3S1 | S027 | Human | Liver | HCC | 1.99e-03 | 8.87e-01 | 0.2446 |
| 1176 | AP3S1 | S028 | Human | Liver | HCC | 2.87e-13 | 9.85e-01 | 0.2503 |
| 1176 | AP3S1 | S029 | Human | Liver | HCC | 1.82e-20 | 1.57e+00 | 0.2581 |
| 1176 | AP3S1 | C04 | Human | Oral cavity | OSCC | 2.01e-39 | 2.33e+00 | 0.2633 |
| 1176 | AP3S1 | C21 | Human | Oral cavity | OSCC | 1.86e-69 | 2.73e+00 | 0.2678 |
| 1176 | AP3S1 | C30 | Human | Oral cavity | OSCC | 1.00e-57 | 3.19e+00 | 0.3055 |
| Page: 1 2 3 4 5 6 7 8 |
| Tissue | Expression Dynamics | Abbreviation |
| Endometrium | 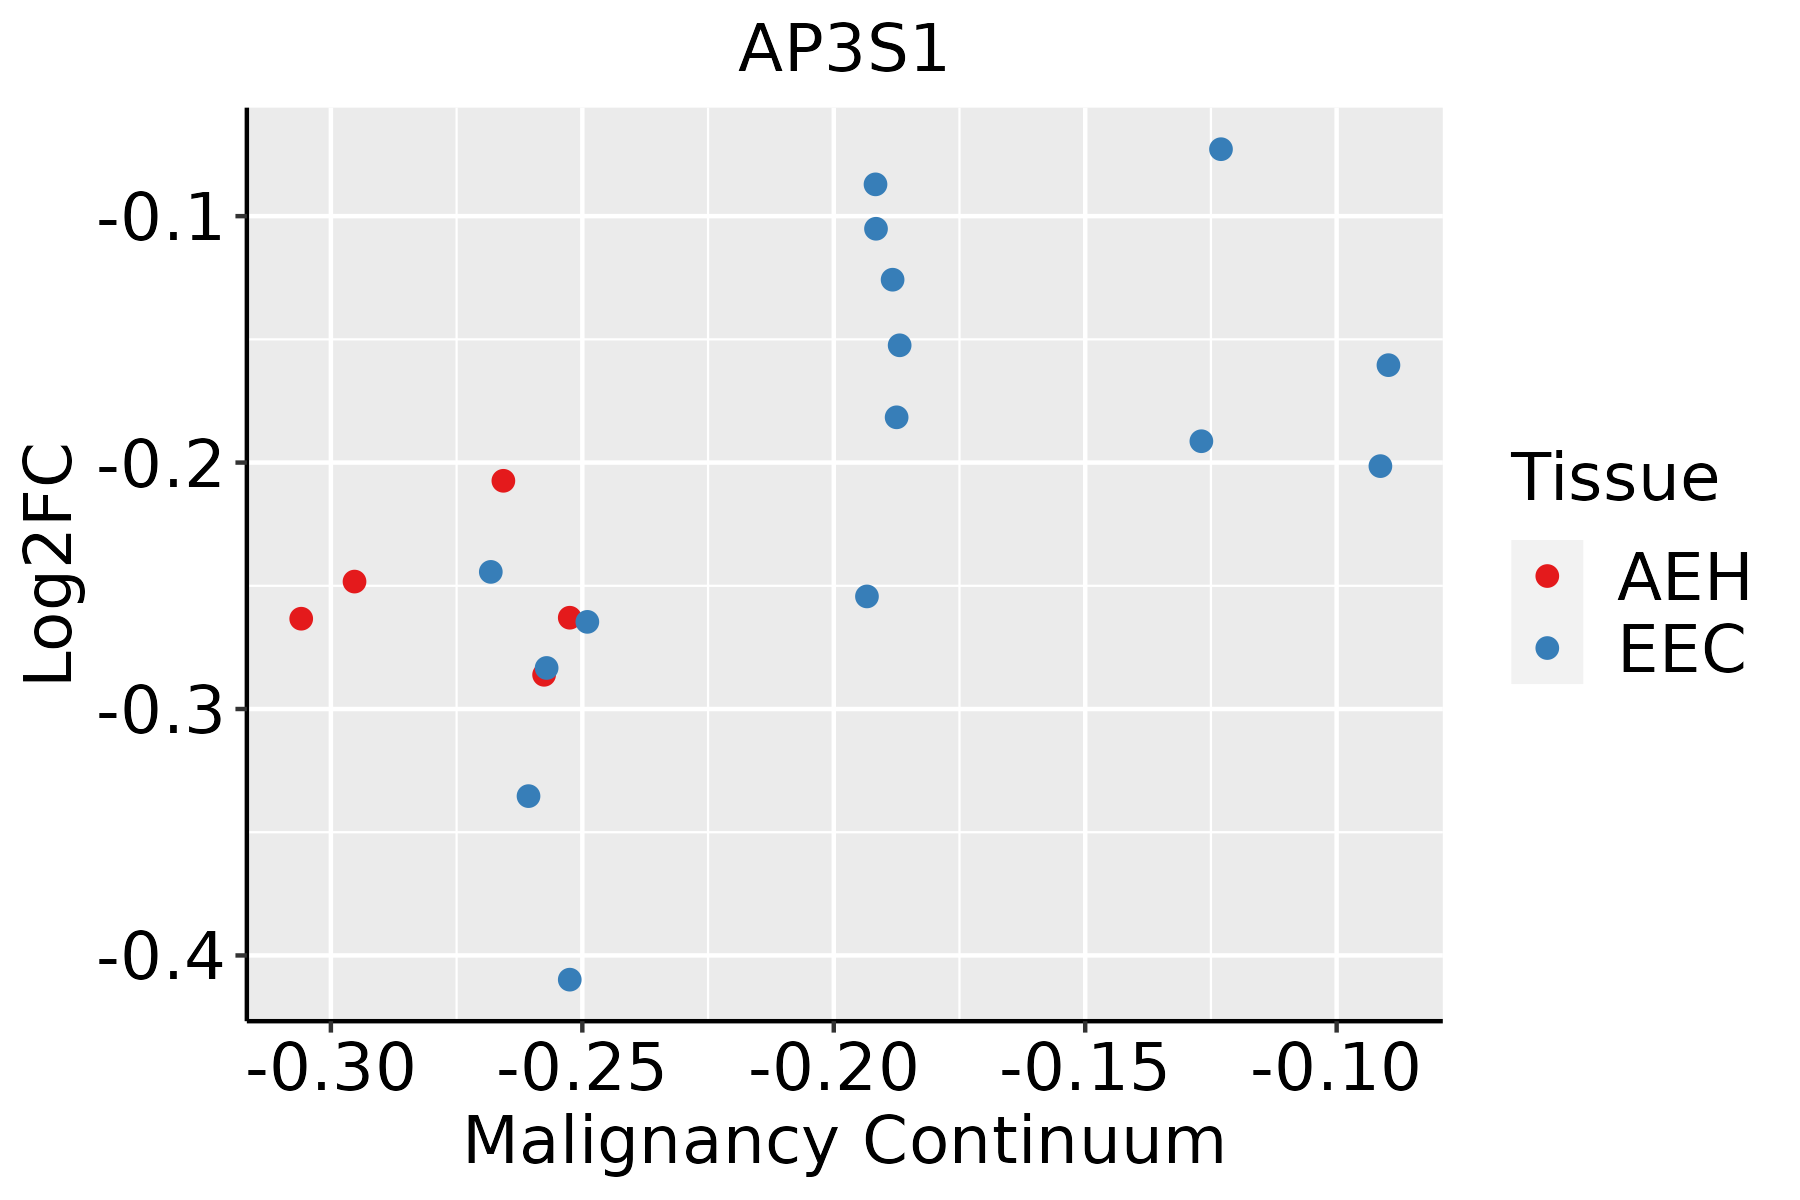 | AEH: Atypical endometrial hyperplasia |
| EEC: Endometrioid Cancer | ||
| Esophagus |  | ESCC: Esophageal squamous cell carcinoma |
| HGIN: High-grade intraepithelial neoplasias | ||
| LGIN: Low-grade intraepithelial neoplasias | ||
| Liver |  | HCC: Hepatocellular carcinoma |
| NAFLD: Non-alcoholic fatty liver disease | ||
| Oral Cavity | 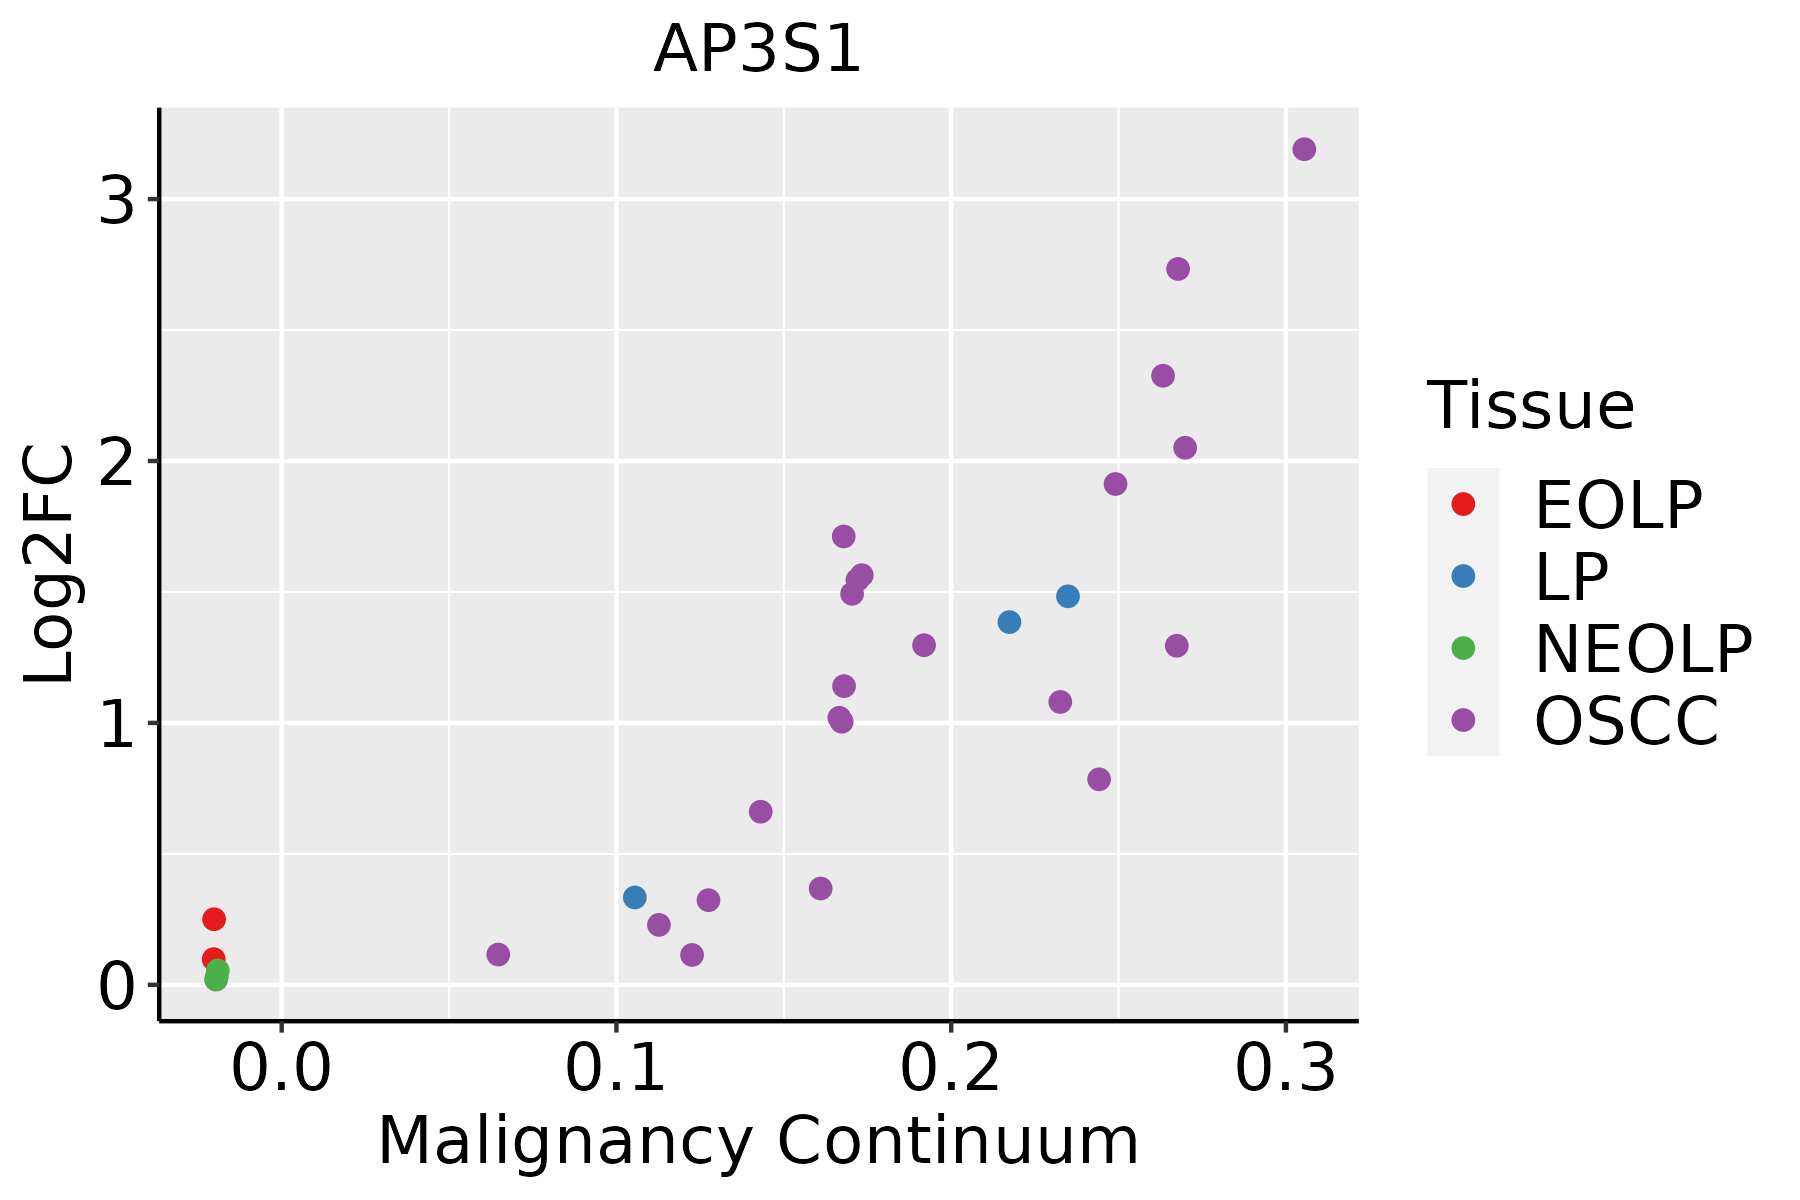 | EOLP: Erosive Oral lichen planus |
| LP: leukoplakia | ||
| NEOLP: Non-erosive oral lichen planus | ||
| OSCC: Oral squamous cell carcinoma | ||
| Skin | 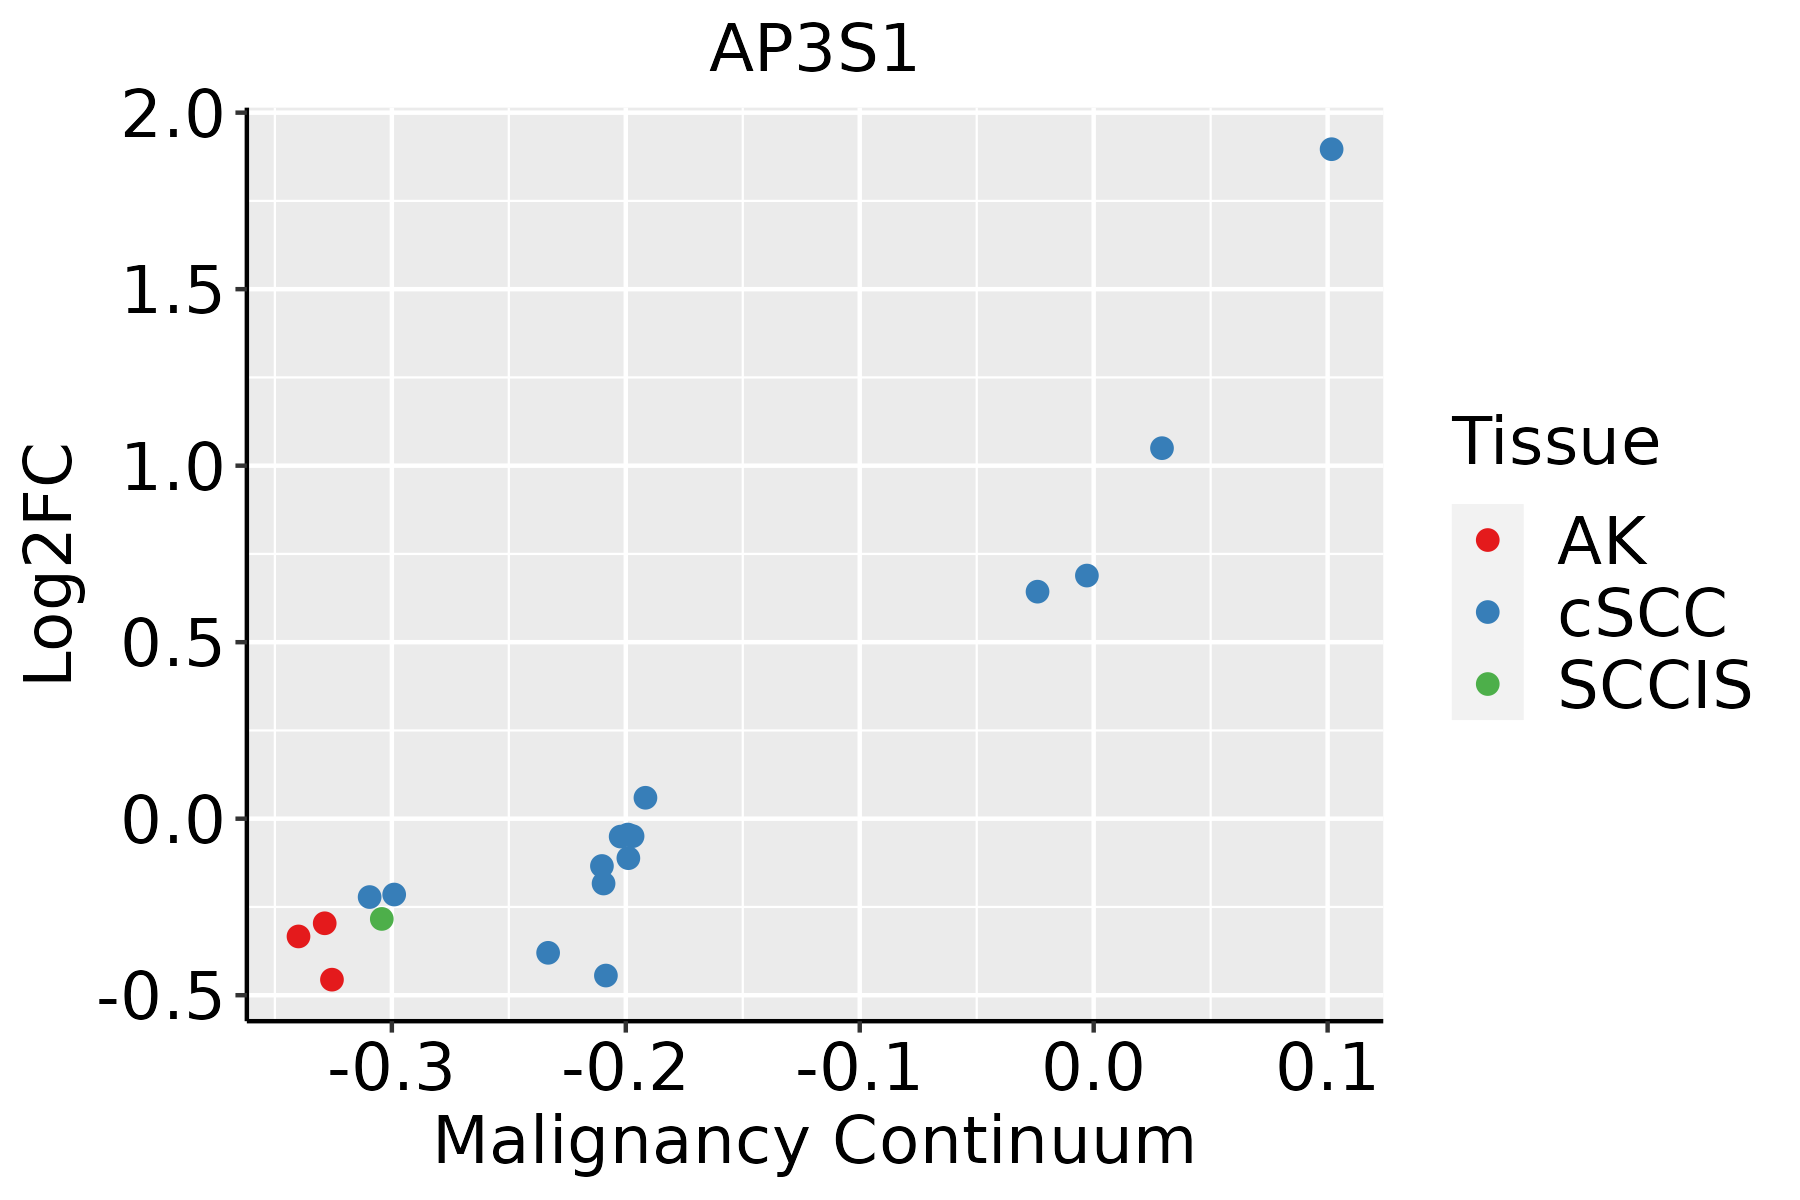 | AK: Actinic keratosis |
| cSCC: Cutaneous squamous cell carcinoma | ||
| SCCIS:squamous cell carcinoma in situ | ||
| Thyroid |  | ATC: Anaplastic thyroid cancer |
| HT: Hashimoto's thyroiditis | ||
| PTC: Papillary thyroid cancer |
| ∗log2FC in expression of this searched gene in stem-like cells from each diseased tissue sample relative to stem-like cells in normal samples in each tissue plotted against the malignancy continuum. Samples are colored based on if they are from different disease stage. |
Top |
Malignant transformation related pathway analysis |
| Find out the enriched GO biological processes and KEGG pathways involved in transition from healthy to precancer to cancer |
| Tissue | Disease Stage | Enriched GO biological Processes |
| Colorectum | AD |  |
| Colorectum | SER |  |
| Colorectum | MSS |  |
| Colorectum | MSI-H |  |
| Colorectum | FAP |  |
| ∗Top 15 enriched GO BP terms are showed in the bar plot of each disease state in each tissue. Each row represents a significant GO biological process which is colored according to the -log10(p.adjust). |
| Page: 1 2 3 4 5 6 7 8 9 |
| GO ID | Tissue | Disease Stage | Description | Gene Ratio | Bg Ratio | pvalue | p.adjust | Count |
| GO:00516568 | Endometrium | AEH | establishment of organelle localization | 77/2100 | 390/18723 | 4.89e-07 | 1.94e-05 | 77 |
| GO:00481939 | Endometrium | AEH | Golgi vesicle transport | 60/2100 | 296/18723 | 3.65e-06 | 9.79e-05 | 60 |
| GO:19016539 | Endometrium | AEH | cellular response to peptide | 64/2100 | 359/18723 | 1.16e-04 | 1.63e-03 | 64 |
| GO:004343410 | Endometrium | AEH | response to peptide hormone | 70/2100 | 414/18723 | 2.93e-04 | 3.35e-03 | 70 |
| GO:00307058 | Endometrium | AEH | cytoskeleton-dependent intracellular transport | 38/2100 | 195/18723 | 4.72e-04 | 4.91e-03 | 38 |
| GO:00516507 | Endometrium | AEH | establishment of vesicle localization | 32/2100 | 161/18723 | 8.99e-04 | 8.24e-03 | 32 |
| GO:00328699 | Endometrium | AEH | cellular response to insulin stimulus | 37/2100 | 203/18723 | 1.97e-03 | 1.54e-02 | 37 |
| GO:00713758 | Endometrium | AEH | cellular response to peptide hormone stimulus | 49/2100 | 290/18723 | 2.24e-03 | 1.72e-02 | 49 |
| GO:00516487 | Endometrium | AEH | vesicle localization | 32/2100 | 177/18723 | 4.33e-03 | 2.86e-02 | 32 |
| GO:00082866 | Endometrium | AEH | insulin receptor signaling pathway | 23/2100 | 116/18723 | 4.58e-03 | 2.95e-02 | 23 |
| GO:00070348 | Endometrium | AEH | vacuolar transport | 29/2100 | 157/18723 | 4.69e-03 | 2.99e-02 | 29 |
| GO:00328689 | Endometrium | AEH | response to insulin | 44/2100 | 264/18723 | 4.70e-03 | 3.00e-02 | 44 |
| GO:00484891 | Endometrium | AEH | synaptic vesicle transport | 11/2100 | 42/18723 | 5.45e-03 | 3.37e-02 | 11 |
| GO:00080887 | Endometrium | AEH | axo-dendritic transport | 16/2100 | 75/18723 | 8.13e-03 | 4.49e-02 | 16 |
| GO:005165613 | Endometrium | EEC | establishment of organelle localization | 75/2168 | 390/18723 | 6.23e-06 | 1.49e-04 | 75 |
| GO:004819313 | Endometrium | EEC | Golgi vesicle transport | 60/2168 | 296/18723 | 9.91e-06 | 2.17e-04 | 60 |
| GO:190165314 | Endometrium | EEC | cellular response to peptide | 68/2168 | 359/18723 | 2.75e-05 | 4.83e-04 | 68 |
| GO:004343416 | Endometrium | EEC | response to peptide hormone | 74/2168 | 414/18723 | 9.11e-05 | 1.28e-03 | 74 |
| GO:003070514 | Endometrium | EEC | cytoskeleton-dependent intracellular transport | 39/2168 | 195/18723 | 4.40e-04 | 4.58e-03 | 39 |
| GO:007137513 | Endometrium | EEC | cellular response to peptide hormone stimulus | 52/2168 | 290/18723 | 8.77e-04 | 8.01e-03 | 52 |
| Page: 1 2 3 4 5 6 7 8 9 10 11 |
| Pathway ID | Tissue | Disease Stage | Description | Gene Ratio | Bg Ratio | pvalue | p.adjust | qvalue | Count |
| hsa0414222 | Esophagus | ESCC | Lysosome | 102/4205 | 132/8465 | 5.11e-11 | 7.13e-10 | 3.65e-10 | 102 |
| hsa0414232 | Esophagus | ESCC | Lysosome | 102/4205 | 132/8465 | 5.11e-11 | 7.13e-10 | 3.65e-10 | 102 |
| hsa041424 | Liver | Cirrhotic | Lysosome | 68/2530 | 132/8465 | 1.34e-07 | 1.97e-06 | 1.21e-06 | 68 |
| hsa0414211 | Liver | Cirrhotic | Lysosome | 68/2530 | 132/8465 | 1.34e-07 | 1.97e-06 | 1.21e-06 | 68 |
| hsa041422 | Liver | HCC | Lysosome | 100/4020 | 132/8465 | 2.32e-11 | 4.31e-10 | 2.40e-10 | 100 |
| hsa041423 | Liver | HCC | Lysosome | 100/4020 | 132/8465 | 2.32e-11 | 4.31e-10 | 2.40e-10 | 100 |
| hsa041425 | Oral cavity | OSCC | Lysosome | 87/3704 | 132/8465 | 1.97e-07 | 1.35e-06 | 6.86e-07 | 87 |
| hsa0414212 | Oral cavity | OSCC | Lysosome | 87/3704 | 132/8465 | 1.97e-07 | 1.35e-06 | 6.86e-07 | 87 |
| hsa0414221 | Oral cavity | LP | Lysosome | 67/2418 | 132/8465 | 5.13e-08 | 7.77e-07 | 5.01e-07 | 67 |
| hsa0414231 | Oral cavity | LP | Lysosome | 67/2418 | 132/8465 | 5.13e-08 | 7.77e-07 | 5.01e-07 | 67 |
| Page: 1 |
Top |
Cell-cell communication analysis |
| Identification of potential cell-cell interactions between two cell types and their ligand-receptor pairs for different disease states |
| Ligand | Receptor | LRpair | Pathway | Tissue | Disease Stage |
| Page: 1 |
Top |
Single-cell gene regulatory network inference analysis |
| Find out the significant the regulons (TFs) and the target genes of each regulon across cell types for different disease states |
| TF | Cell Type | Tissue | Disease Stage | Target Gene | RSS | Regulon Activity |
| ∗The dot plots of a searched regulon are shown for all cell subpopulations in each disease state of each tissue based on the regulon specific score inferred using pySCENIC and by calculating the average expression. |
| Page: 1 |
Top |
Somatic mutation of malignant transformation related genes |
| Annotation of somatic variants for genes involved in malignant transformation |
| Hugo Symbol | Variant Class | Variant Classification | dbSNP RS | HGVSc | HGVSp | HGVSp Short | SWISSPROT | BIOTYPE | SIFT | PolyPhen | Tumor Sample Barcode | Tissue | Histology | Sex | Age | Stage | Therapy Types | Drugs | Outcome |
| AP3S1 | SNV | Missense_Mutation | c.467N>A | p.Gly156Glu | p.G156E | Q92572 | protein_coding | tolerated(0.26) | benign(0.044) | TCGA-BH-A18P-01 | Breast | breast invasive carcinoma | Female | <65 | I/II | Unknown | Unknown | PD | |
| AP3S1 | SNV | Missense_Mutation | c.327N>C | p.Leu109Phe | p.L109F | Q92572 | protein_coding | deleterious(0.01) | probably_damaging(0.996) | TCGA-DR-A0ZM-01 | Cervix | cervical & endocervical cancer | Female | <65 | III/IV | Unspecific | Cisplatin | SD | |
| AP3S1 | SNV | Missense_Mutation | c.572C>A | p.Ser191Tyr | p.S191Y | Q92572 | protein_coding | deleterious_low_confidence(0.01) | benign(0.003) | TCGA-CA-6718-01 | Colorectum | colon adenocarcinoma | Male | <65 | I/II | Unknown | Unknown | PD | |
| AP3S1 | SNV | Missense_Mutation | rs200347946 | c.34G>A | p.Gly12Arg | p.G12R | Q92572 | protein_coding | deleterious(0.03) | possibly_damaging(0.873) | TCGA-CM-5868-01 | Colorectum | colon adenocarcinoma | Female | <65 | I/II | Chemotherapy | fluorouracil | SD |
| AP3S1 | SNV | Missense_Mutation | c.125G>T | p.Arg42Ile | p.R42I | Q92572 | protein_coding | deleterious(0) | probably_damaging(0.995) | TCGA-AG-A002-01 | Colorectum | rectum adenocarcinoma | Male | <65 | I/II | Unknown | Unknown | SD | |
| AP3S1 | SNV | Missense_Mutation | novel | c.137N>C | p.Val46Ala | p.V46A | Q92572 | protein_coding | tolerated(0.15) | benign(0.034) | TCGA-F5-6814-01 | Colorectum | rectum adenocarcinoma | Male | <65 | I/II | Unknown | Unknown | SD |
| AP3S1 | SNV | Missense_Mutation | novel | c.115N>A | p.Val39Ile | p.V39I | Q92572 | protein_coding | tolerated(0.18) | possibly_damaging(0.576) | TCGA-A5-A0G1-01 | Endometrium | uterine corpus endometrioid carcinoma | Female | >=65 | I/II | Unknown | Unknown | SD |
| AP3S1 | SNV | Missense_Mutation | novel | c.208N>C | p.Thr70Pro | p.T70P | Q92572 | protein_coding | deleterious(0) | possibly_damaging(0.651) | TCGA-A5-A0G1-01 | Endometrium | uterine corpus endometrioid carcinoma | Female | >=65 | I/II | Unknown | Unknown | SD |
| AP3S1 | SNV | Missense_Mutation | novel | c.119N>A | p.Ser40Tyr | p.S40Y | Q92572 | protein_coding | deleterious(0) | probably_damaging(0.958) | TCGA-A5-A2K5-01 | Endometrium | uterine corpus endometrioid carcinoma | Female | >=65 | I/II | Unknown | Unknown | SD |
| AP3S1 | SNV | Missense_Mutation | c.209N>T | p.Thr70Met | p.T70M | Q92572 | protein_coding | deleterious(0.02) | probably_damaging(0.997) | TCGA-AP-A059-01 | Endometrium | uterine corpus endometrioid carcinoma | Female | >=65 | I/II | Unknown | Unknown | SD |
| Page: 1 2 3 |
Top |
Related drugs of malignant transformation related genes |
| Identification of chemicals and drugs interact with genes involved in malignant transfromation |
| (DGIdb 4.0) |
| Entrez ID | Symbol | Category | Interaction Types | Drug Claim Name | Drug Name | PMIDs |
| Page: 1 |

Copyright 2023-Present -The University of Texas Health Science Center at Houston |