
|
|||||
|
 | |
| |
| |
| |
| |
| |
|
Gene: ANXA3 |
Gene summary for ANXA3 |
| Gene information | Species | Human | Gene symbol | ANXA3 | Gene ID | 306 |
| Gene name | annexin A3 | |
| Gene Alias | ANX3 | |
| Cytomap | 4q21.21 | |
| Gene Type | protein-coding | GO ID | GO:0001525 | UniProtAcc | P12429 |
Top |
Malignant transformation analysis |
| Identification of the aberrant gene expression in precancerous and cancerous lesions by comparing the gene expression of stem-like cells in diseased tissues with normal stem cells |
| Entrez ID | Symbol | Replicates | Species | Organ | Tissue | Adj P-value | Log2FC | Malignancy |
| 306 | ANXA3 | nodule-WTA | Human | Thyroid | goiters | 3.08e-02 | -4.19e-01 | 0.0534 |
| 306 | ANXA3 | PTC01 | Human | Thyroid | PTC | 1.70e-14 | -1.17e-01 | 0.1899 |
| 306 | ANXA3 | PTC05 | Human | Thyroid | PTC | 1.01e-11 | 1.14e+00 | 0.2065 |
| 306 | ANXA3 | PTC06 | Human | Thyroid | PTC | 2.77e-07 | 6.68e-01 | 0.2057 |
| 306 | ANXA3 | PTC07 | Human | Thyroid | PTC | 3.32e-13 | 5.97e-01 | 0.2044 |
| 306 | ANXA3 | ATC08 | Human | Thyroid | ATC | 2.60e-09 | -4.53e-01 | 0.0541 |
| 306 | ANXA3 | ATC09 | Human | Thyroid | ATC | 6.39e-05 | -6.17e-01 | 0.2871 |
| 306 | ANXA3 | ATC12 | Human | Thyroid | ATC | 1.02e-18 | -6.33e-01 | 0.34 |
| 306 | ANXA3 | ATC13 | Human | Thyroid | ATC | 1.92e-19 | -6.33e-01 | 0.34 |
| 306 | ANXA3 | ATC1 | Human | Thyroid | ATC | 8.40e-04 | -6.15e-01 | 0.2878 |
| 306 | ANXA3 | ATC4 | Human | Thyroid | ATC | 3.50e-17 | -6.33e-01 | 0.34 |
| 306 | ANXA3 | ATC5 | Human | Thyroid | ATC | 5.37e-18 | -6.33e-01 | 0.34 |
| Page: 1 2 3 4 5 |
| Tissue | Expression Dynamics | Abbreviation |
| Breast | 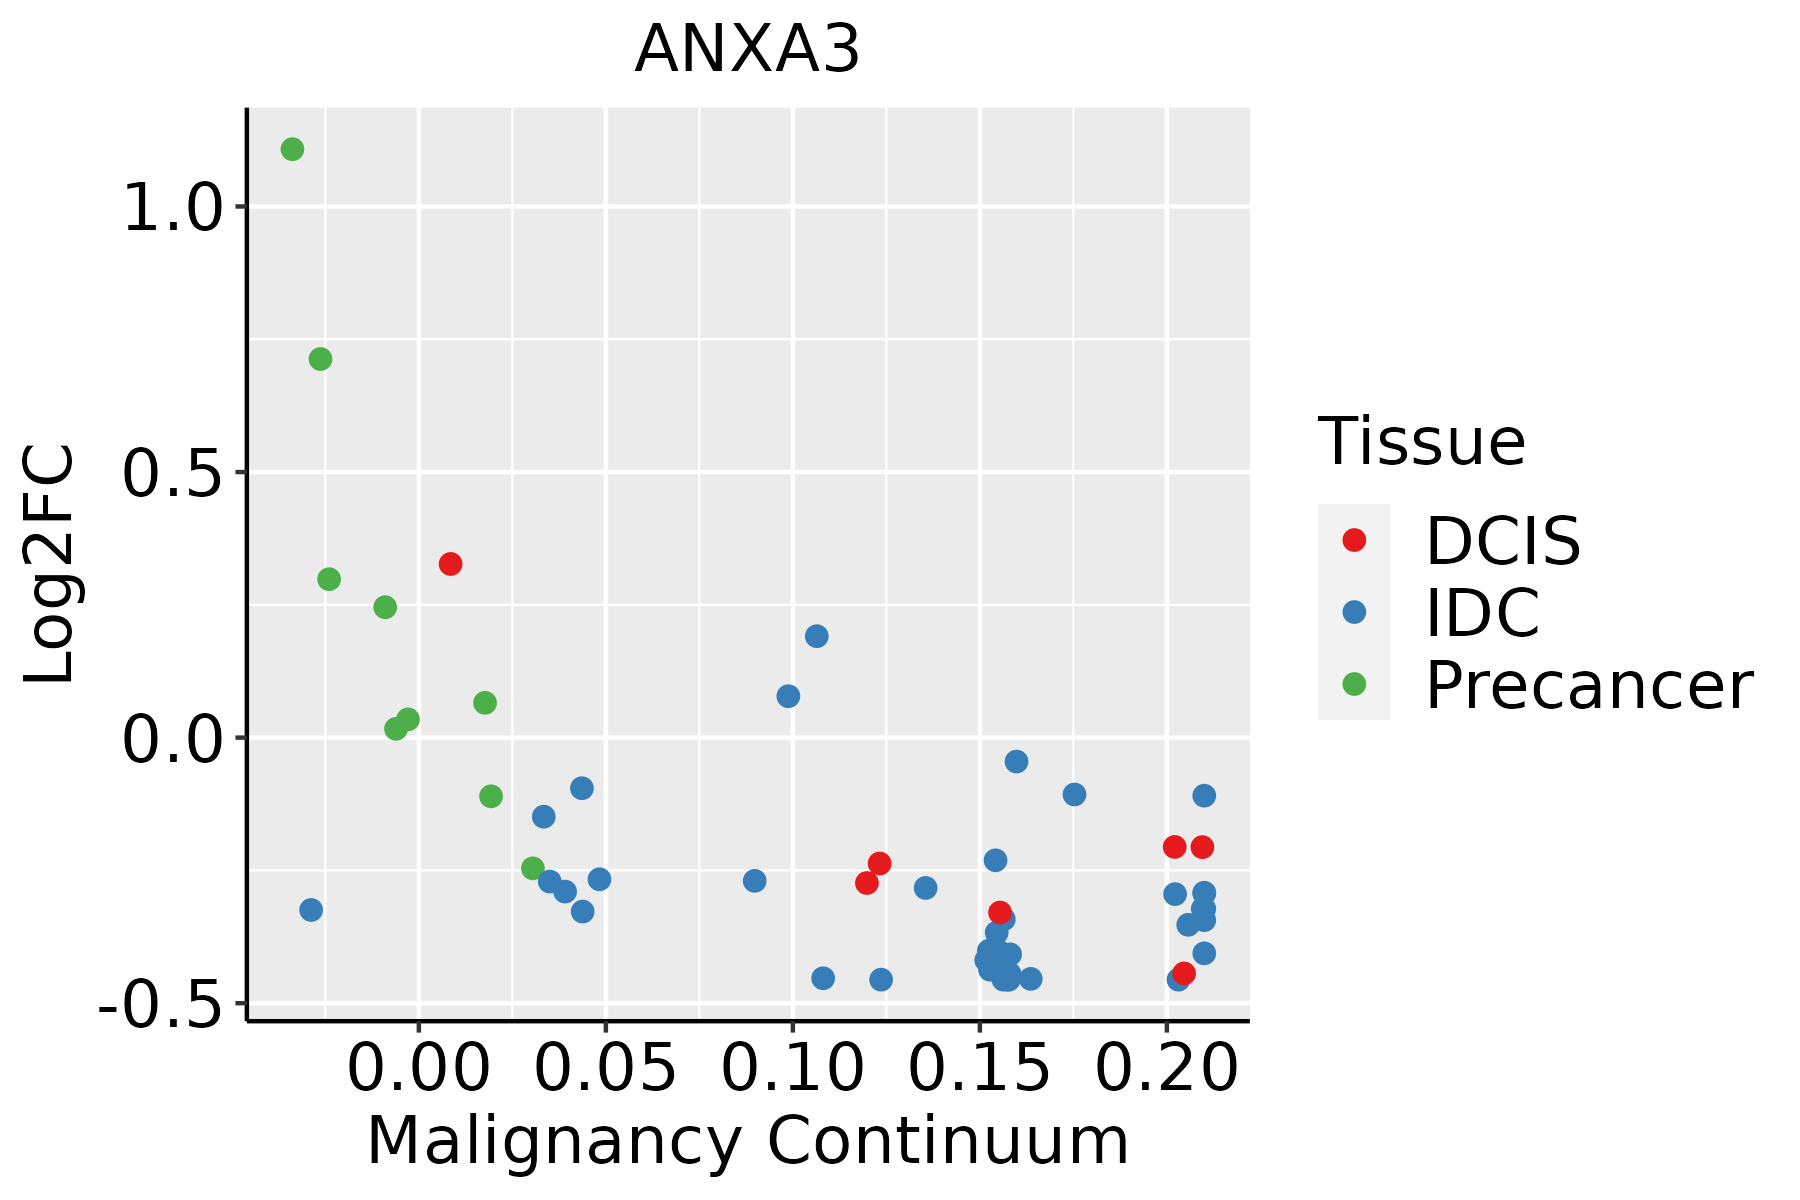 | IDC: Invasive ductal carcinoma |
| DCIS: Ductal carcinoma in situ | ||
| Precancer(BRCA1-mut): Precancerous lesion from BRCA1 mutation carriers | ||
| Esophagus | 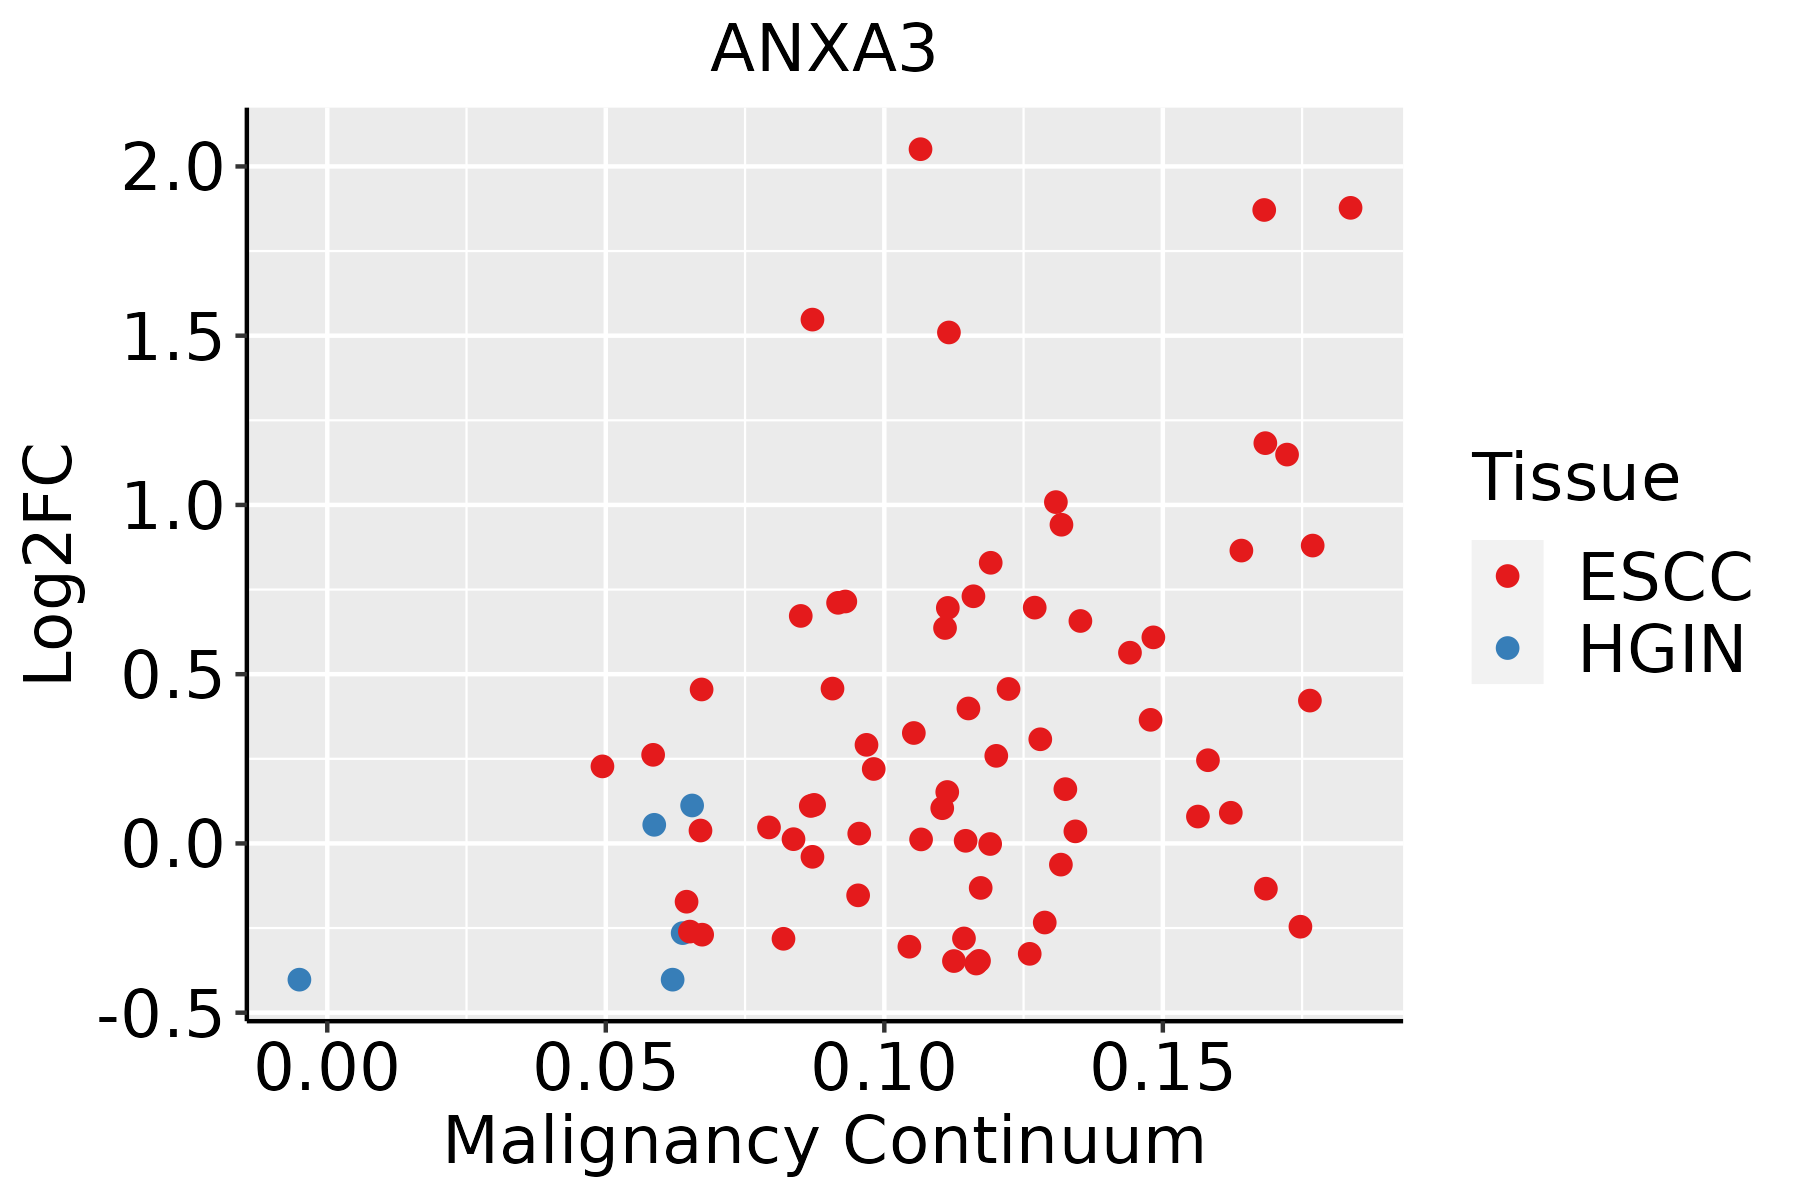 | ESCC: Esophageal squamous cell carcinoma |
| HGIN: High-grade intraepithelial neoplasias | ||
| LGIN: Low-grade intraepithelial neoplasias | ||
| Oral Cavity | 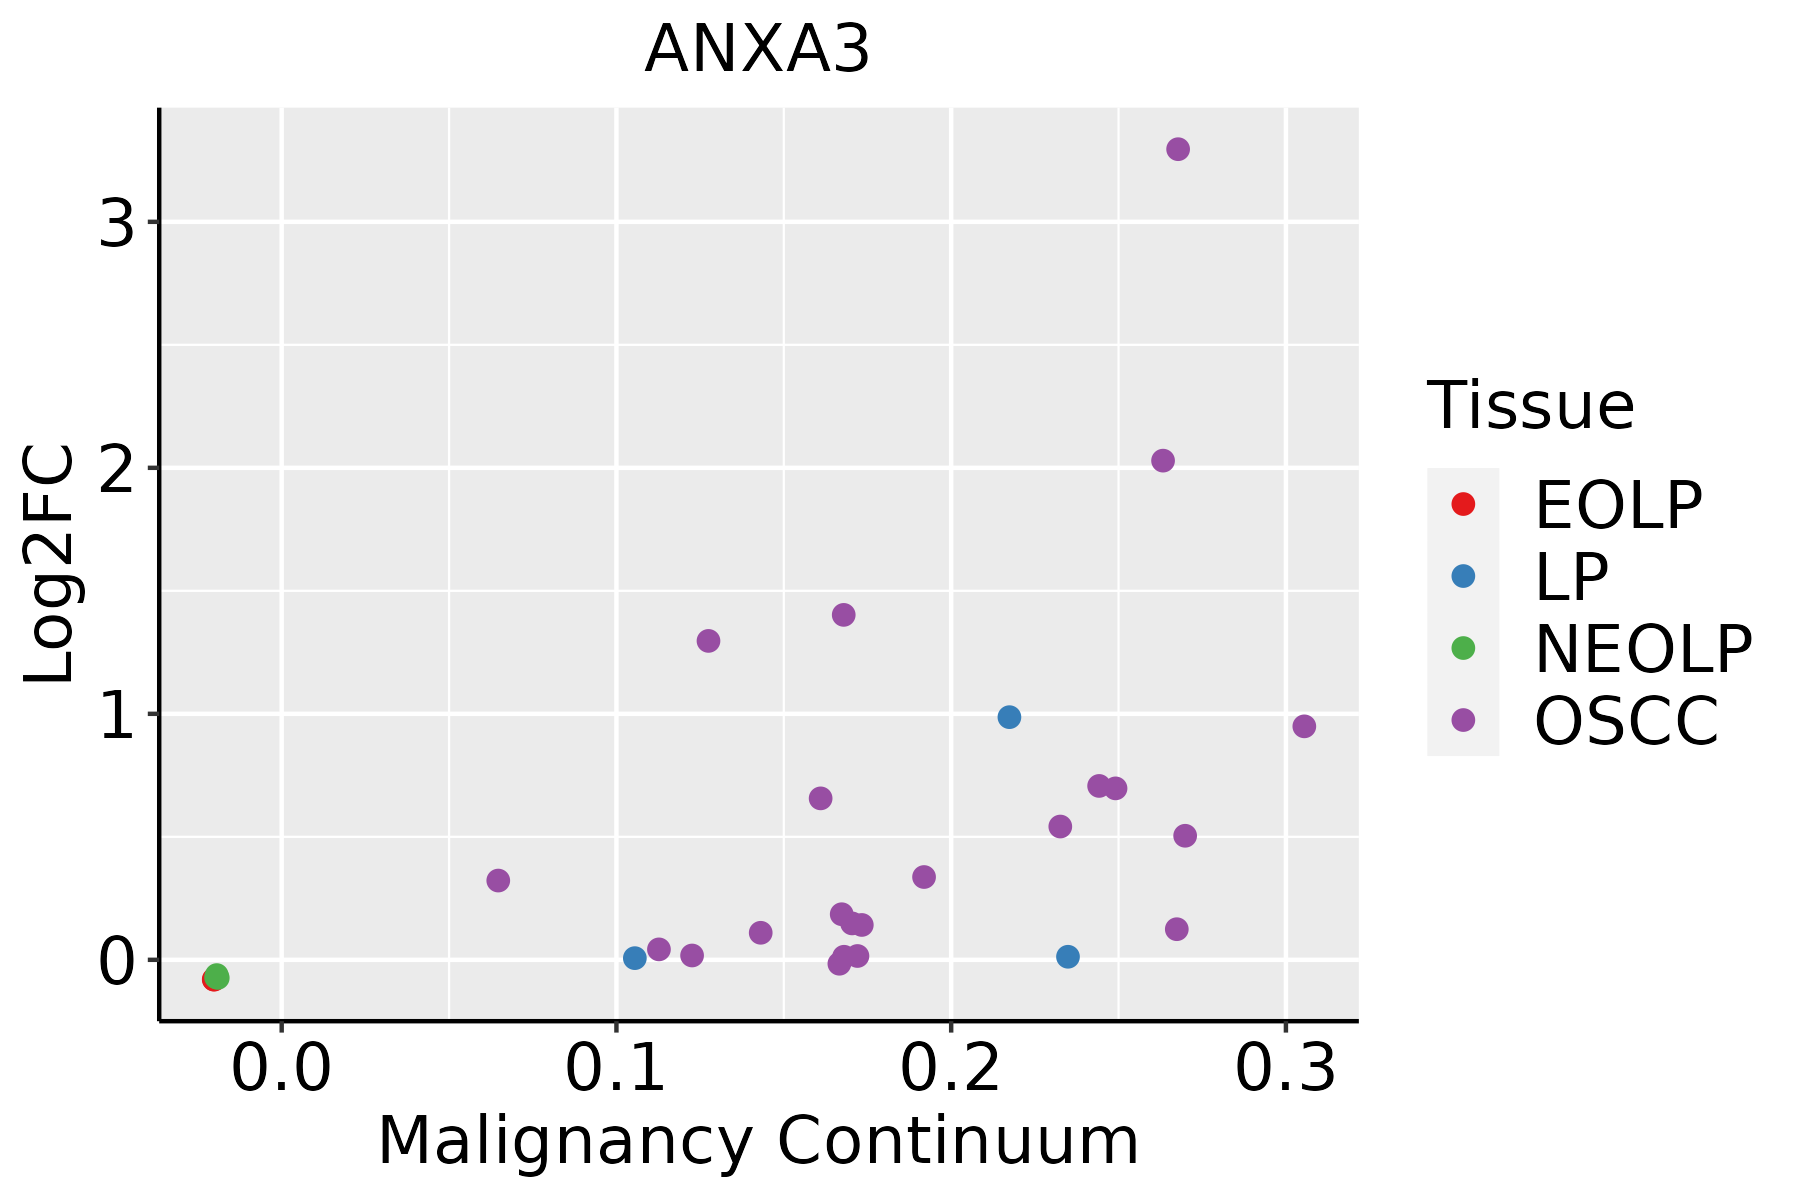 | EOLP: Erosive Oral lichen planus |
| LP: leukoplakia | ||
| NEOLP: Non-erosive oral lichen planus | ||
| OSCC: Oral squamous cell carcinoma | ||
| Prostate | 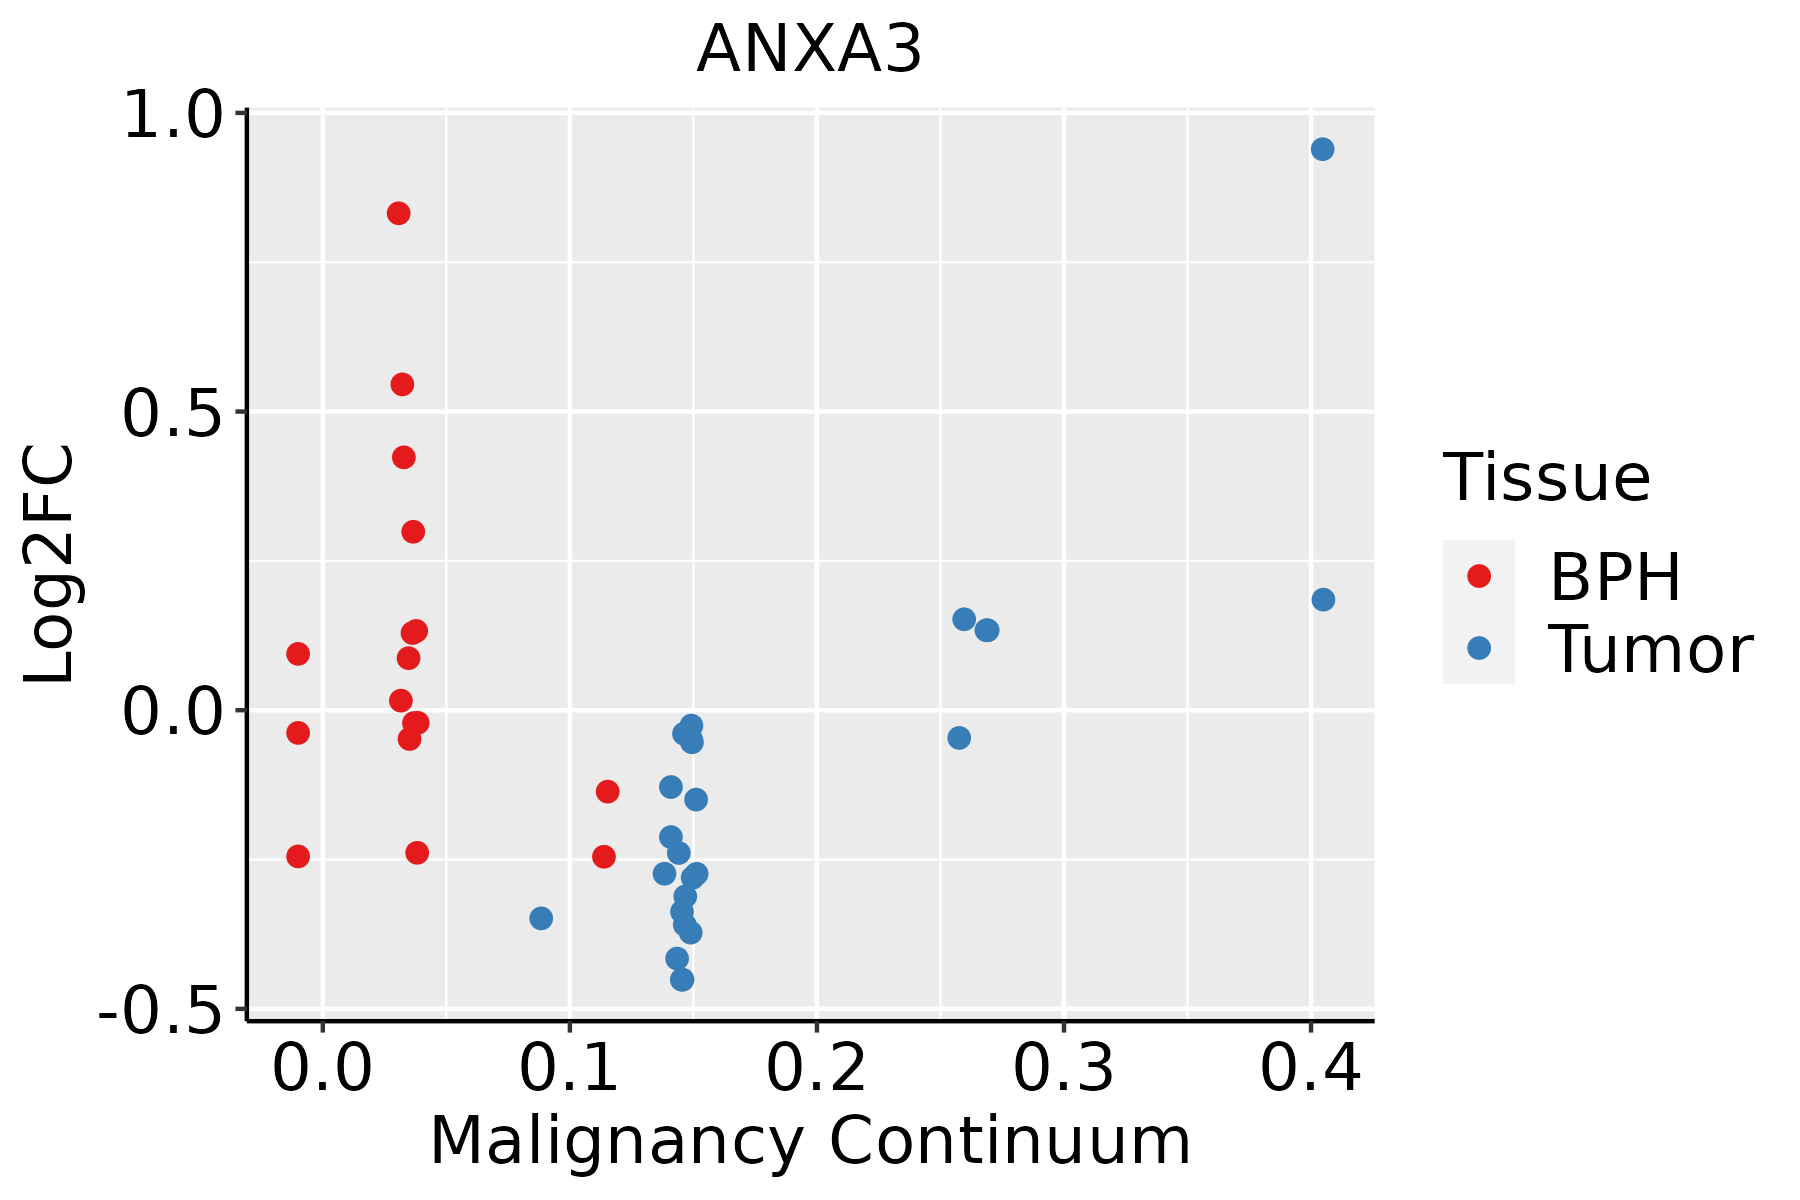 | BPH: Benign Prostatic Hyperplasia |
| Skin | 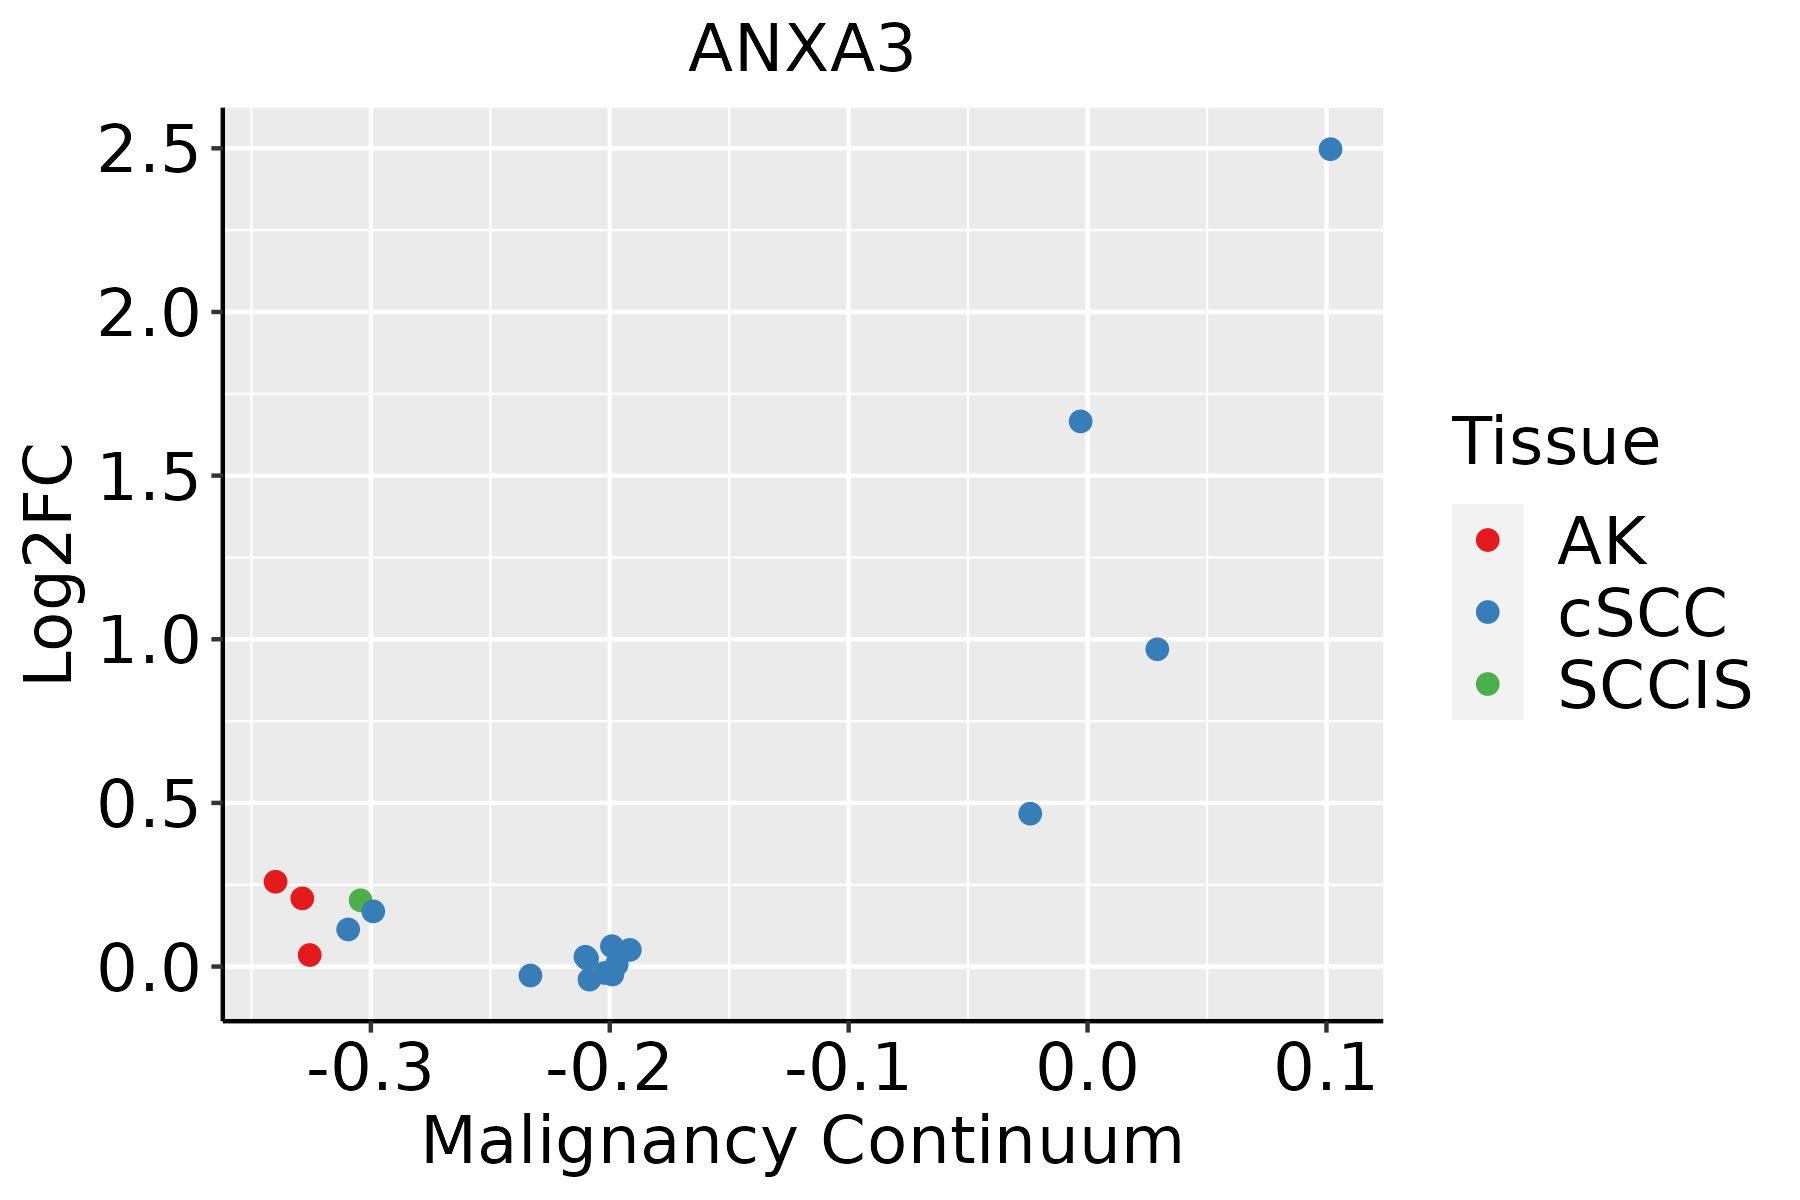 | AK: Actinic keratosis |
| cSCC: Cutaneous squamous cell carcinoma | ||
| SCCIS:squamous cell carcinoma in situ | ||
| Thyroid | 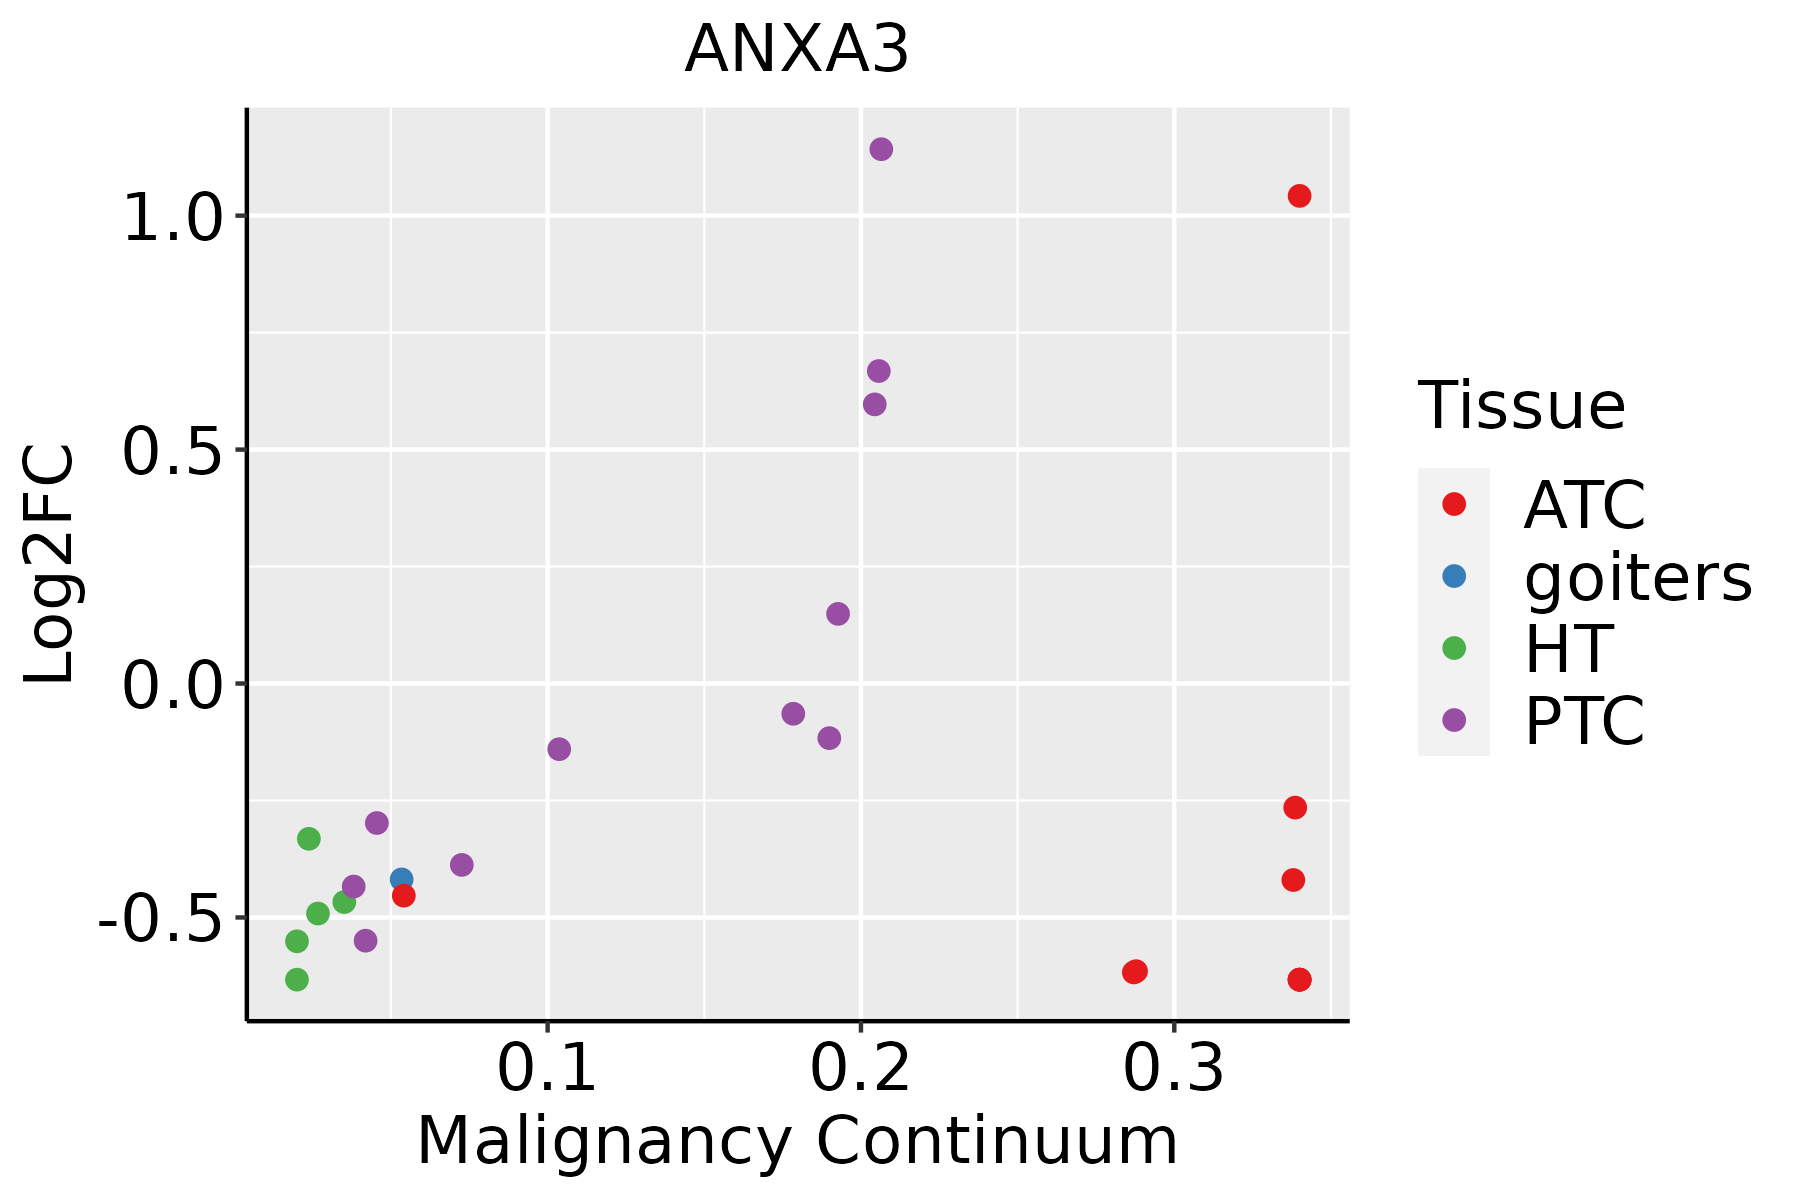 | ATC: Anaplastic thyroid cancer |
| HT: Hashimoto's thyroiditis | ||
| PTC: Papillary thyroid cancer |
| ∗log2FC in expression of this searched gene in stem-like cells from each diseased tissue sample relative to stem-like cells in normal samples in each tissue plotted against the malignancy continuum. Samples are colored based on if they are from different disease stage. |
Top |
Malignant transformation related pathway analysis |
| Find out the enriched GO biological processes and KEGG pathways involved in transition from healthy to precancer to cancer |
| Tissue | Disease Stage | Enriched GO biological Processes |
| Colorectum | AD |  |
| Colorectum | SER |  |
| Colorectum | MSS |  |
| Colorectum | MSI-H |  |
| Colorectum | FAP |  |
| ∗Top 15 enriched GO BP terms are showed in the bar plot of each disease state in each tissue. Each row represents a significant GO biological process which is colored according to the -log10(p.adjust). |
| Page: 1 2 3 4 5 6 7 8 9 |
| GO ID | Tissue | Disease Stage | Description | Gene Ratio | Bg Ratio | pvalue | p.adjust | Count |
| GO:00485459 | Breast | Precancer | response to steroid hormone | 53/1080 | 339/18723 | 3.07e-11 | 3.66e-09 | 53 |
| GO:00319608 | Breast | Precancer | response to corticosteroid | 30/1080 | 167/18723 | 2.50e-08 | 1.65e-06 | 30 |
| GO:00513848 | Breast | Precancer | response to glucocorticoid | 26/1080 | 148/18723 | 3.32e-07 | 1.57e-05 | 26 |
| GO:00106348 | Breast | Precancer | positive regulation of epithelial cell migration | 25/1080 | 176/18723 | 2.75e-05 | 6.21e-04 | 25 |
| GO:00106319 | Breast | Precancer | epithelial cell migration | 40/1080 | 357/18723 | 4.57e-05 | 9.71e-04 | 40 |
| GO:00901329 | Breast | Precancer | epithelium migration | 40/1080 | 360/18723 | 5.51e-05 | 1.14e-03 | 40 |
| GO:00435426 | Breast | Precancer | endothelial cell migration | 33/1080 | 279/18723 | 7.28e-05 | 1.44e-03 | 33 |
| GO:00901309 | Breast | Precancer | tissue migration | 40/1080 | 365/18723 | 7.48e-05 | 1.47e-03 | 40 |
| GO:00105953 | Breast | Precancer | positive regulation of endothelial cell migration | 20/1080 | 133/18723 | 7.59e-05 | 1.48e-03 | 20 |
| GO:00311004 | Breast | Precancer | animal organ regeneration | 14/1080 | 76/18723 | 9.92e-05 | 1.83e-03 | 14 |
| GO:00106329 | Breast | Precancer | regulation of epithelial cell migration | 33/1080 | 292/18723 | 1.74e-04 | 2.86e-03 | 33 |
| GO:00310995 | Breast | Precancer | regeneration | 25/1080 | 198/18723 | 1.91e-04 | 3.06e-03 | 25 |
| GO:00016678 | Breast | Precancer | ameboidal-type cell migration | 47/1080 | 475/18723 | 2.19e-04 | 3.35e-03 | 47 |
| GO:0045766 | Breast | Precancer | positive regulation of angiogenesis | 23/1080 | 181/18723 | 3.09e-04 | 4.43e-03 | 23 |
| GO:1904018 | Breast | Precancer | positive regulation of vasculature development | 23/1080 | 181/18723 | 3.09e-04 | 4.43e-03 | 23 |
| GO:00105943 | Breast | Precancer | regulation of endothelial cell migration | 27/1080 | 232/18723 | 4.12e-04 | 5.55e-03 | 27 |
| GO:0045765 | Breast | Precancer | regulation of angiogenesis | 35/1080 | 342/18723 | 7.35e-04 | 8.80e-03 | 35 |
| GO:1901342 | Breast | Precancer | regulation of vasculature development | 35/1080 | 348/18723 | 1.00e-03 | 1.12e-02 | 35 |
| GO:00510548 | Breast | Precancer | positive regulation of DNA metabolic process | 23/1080 | 201/18723 | 1.34e-03 | 1.41e-02 | 23 |
| GO:004854514 | Breast | IDC | response to steroid hormone | 70/1434 | 339/18723 | 1.34e-14 | 4.23e-12 | 70 |
| Page: 1 2 3 4 5 6 7 8 9 10 11 12 13 |
| Pathway ID | Tissue | Disease Stage | Description | Gene Ratio | Bg Ratio | pvalue | p.adjust | qvalue | Count |
| Page: 1 |
Top |
Cell-cell communication analysis |
| Identification of potential cell-cell interactions between two cell types and their ligand-receptor pairs for different disease states |
| Ligand | Receptor | LRpair | Pathway | Tissue | Disease Stage |
| Page: 1 |
Top |
Single-cell gene regulatory network inference analysis |
| Find out the significant the regulons (TFs) and the target genes of each regulon across cell types for different disease states |
| TF | Cell Type | Tissue | Disease Stage | Target Gene | RSS | Regulon Activity |
| ∗The dot plots of a searched regulon are shown for all cell subpopulations in each disease state of each tissue based on the regulon specific score inferred using pySCENIC and by calculating the average expression. |
| Page: 1 |
Top |
Somatic mutation of malignant transformation related genes |
| Annotation of somatic variants for genes involved in malignant transformation |
| Hugo Symbol | Variant Class | Variant Classification | dbSNP RS | HGVSc | HGVSp | HGVSp Short | SWISSPROT | BIOTYPE | SIFT | PolyPhen | Tumor Sample Barcode | Tissue | Histology | Sex | Age | Stage | Therapy Types | Drugs | Outcome |
| ANXA3 | SNV | Missense_Mutation | rs73828045 | c.863G>A | p.Arg288Gln | p.R288Q | P12429 | protein_coding | deleterious(0.02) | benign(0.242) | TCGA-AN-A046-01 | Breast | breast invasive carcinoma | Female | >=65 | I/II | Unknown | Unknown | SD |
| ANXA3 | SNV | Missense_Mutation | rs181568024 | c.157N>T | p.Arg53Trp | p.R53W | P12429 | protein_coding | deleterious(0) | probably_damaging(0.999) | TCGA-AN-A0AK-01 | Breast | breast invasive carcinoma | Female | >=65 | I/II | Unknown | Unknown | SD |
| ANXA3 | SNV | Missense_Mutation | novel | c.505N>G | p.Lys169Glu | p.K169E | P12429 | protein_coding | tolerated(0.87) | benign(0.035) | TCGA-C8-A3M7-01 | Breast | breast invasive carcinoma | Female | <65 | III/IV | Unknown | Unknown | PD |
| ANXA3 | SNV | Missense_Mutation | c.786N>C | p.Leu262Phe | p.L262F | P12429 | protein_coding | deleterious(0) | possibly_damaging(0.85) | TCGA-E2-A10C-01 | Breast | breast invasive carcinoma | Female | <65 | I/II | Chemotherapy | cytoxan | SD | |
| ANXA3 | SNV | Missense_Mutation | novel | c.104N>C | p.Gly35Ala | p.G35A | P12429 | protein_coding | deleterious(0) | probably_damaging(0.999) | TCGA-GM-A3XL-01 | Breast | breast invasive carcinoma | Female | <65 | I/II | Chemotherapy | fluorouracil | CR |
| ANXA3 | SNV | Missense_Mutation | c.112N>A | p.Glu38Lys | p.E38K | P12429 | protein_coding | tolerated(0.11) | probably_damaging(0.992) | TCGA-EK-A2PG-01 | Cervix | cervical & endocervical cancer | Female | >=65 | I/II | Unknown | Unknown | SD | |
| ANXA3 | SNV | Missense_Mutation | c.8N>G | p.Ser3Cys | p.S3C | P12429 | protein_coding | deleterious(0) | benign(0) | TCGA-IR-A3LA-01 | Cervix | cervical & endocervical cancer | Female | <65 | I/II | Chemotherapy | cisplatin | CR | |
| ANXA3 | SNV | Missense_Mutation | c.703N>T | p.His235Tyr | p.H235Y | P12429 | protein_coding | tolerated(0.06) | possibly_damaging(0.58) | TCGA-A6-6653-01 | Colorectum | colon adenocarcinoma | Male | >=65 | I/II | Unknown | Unknown | SD | |
| ANXA3 | SNV | Missense_Mutation | novel | c.253N>A | p.Val85Met | p.V85M | P12429 | protein_coding | deleterious(0.04) | probably_damaging(0.998) | TCGA-AA-3972-01 | Colorectum | colon adenocarcinoma | Male | >=65 | III/IV | Chemotherapy | capecitabine | PD |
| ANXA3 | SNV | Missense_Mutation | novel | c.591N>A | p.Phe197Leu | p.F197L | P12429 | protein_coding | deleterious(0.01) | probably_damaging(0.98) | TCGA-AZ-4315-01 | Colorectum | colon adenocarcinoma | Male | <65 | I/II | Unknown | Unknown | SD |
| Page: 1 2 3 4 |
Top |
Related drugs of malignant transformation related genes |
| Identification of chemicals and drugs interact with genes involved in malignant transfromation |
| (DGIdb 4.0) |
| Entrez ID | Symbol | Category | Interaction Types | Drug Claim Name | Drug Name | PMIDs |
| Page: 1 |

Copyright 2023-Present -The University of Texas Health Science Center at Houston |