
|
|||||
|
 | |
| |
| |
| |
| |
| |
|
Gene: ZNF800 |
Gene summary for ZNF800 |
| Gene information | Species | Human | Gene symbol | ZNF800 | Gene ID | 168850 |
| Gene name | zinc finger protein 800 | |
| Gene Alias | ZNF800 | |
| Cytomap | 7q31.33 | |
| Gene Type | protein-coding | GO ID | GO:0005575 | UniProtAcc | Q2TB10 |
Top |
Malignant transformation analysis |
| Identification of the aberrant gene expression in precancerous and cancerous lesions by comparing the gene expression of stem-like cells in diseased tissues with normal stem cells |
| Entrez ID | Symbol | Replicates | Species | Organ | Tissue | Adj P-value | Log2FC | Malignancy |
| 168850 | ZNF800 | P127T-E | Human | Esophagus | ESCC | 1.26e-16 | 3.22e-01 | 0.0826 |
| 168850 | ZNF800 | P128T-E | Human | Esophagus | ESCC | 1.32e-37 | 1.20e+00 | 0.1241 |
| 168850 | ZNF800 | P130T-E | Human | Esophagus | ESCC | 6.24e-54 | 1.05e+00 | 0.1676 |
| 168850 | ZNF800 | S43 | Human | Liver | Cirrhotic | 2.35e-04 | -1.07e-01 | -0.0187 |
| 168850 | ZNF800 | HCC1_Meng | Human | Liver | HCC | 2.72e-46 | -8.93e-02 | 0.0246 |
| 168850 | ZNF800 | HCC2_Meng | Human | Liver | HCC | 1.30e-17 | 4.22e-02 | 0.0107 |
| 168850 | ZNF800 | HCC1 | Human | Liver | HCC | 1.34e-02 | 3.55e+00 | 0.5336 |
| 168850 | ZNF800 | HCC2 | Human | Liver | HCC | 2.42e-02 | 2.75e+00 | 0.5341 |
| 168850 | ZNF800 | S014 | Human | Liver | HCC | 5.74e-05 | 4.35e-01 | 0.2254 |
| 168850 | ZNF800 | S015 | Human | Liver | HCC | 8.26e-05 | 4.56e-01 | 0.2375 |
| 168850 | ZNF800 | S016 | Human | Liver | HCC | 9.32e-09 | 5.49e-01 | 0.2243 |
| 168850 | ZNF800 | S027 | Human | Liver | HCC | 4.61e-12 | 1.13e+00 | 0.2446 |
| 168850 | ZNF800 | S028 | Human | Liver | HCC | 1.29e-19 | 1.04e+00 | 0.2503 |
| 168850 | ZNF800 | S029 | Human | Liver | HCC | 6.03e-15 | 9.56e-01 | 0.2581 |
| 168850 | ZNF800 | C04 | Human | Oral cavity | OSCC | 3.36e-11 | 5.21e-01 | 0.2633 |
| 168850 | ZNF800 | C21 | Human | Oral cavity | OSCC | 4.20e-05 | 2.71e-01 | 0.2678 |
| 168850 | ZNF800 | C38 | Human | Oral cavity | OSCC | 1.22e-02 | 4.50e-01 | 0.172 |
| 168850 | ZNF800 | C43 | Human | Oral cavity | OSCC | 2.72e-12 | 2.16e-01 | 0.1704 |
| 168850 | ZNF800 | C46 | Human | Oral cavity | OSCC | 4.53e-08 | 2.81e-01 | 0.1673 |
| 168850 | ZNF800 | C57 | Human | Oral cavity | OSCC | 2.59e-05 | 1.95e-01 | 0.1679 |
| Page: 1 2 3 4 5 6 |
| Tissue | Expression Dynamics | Abbreviation |
| Esophagus | 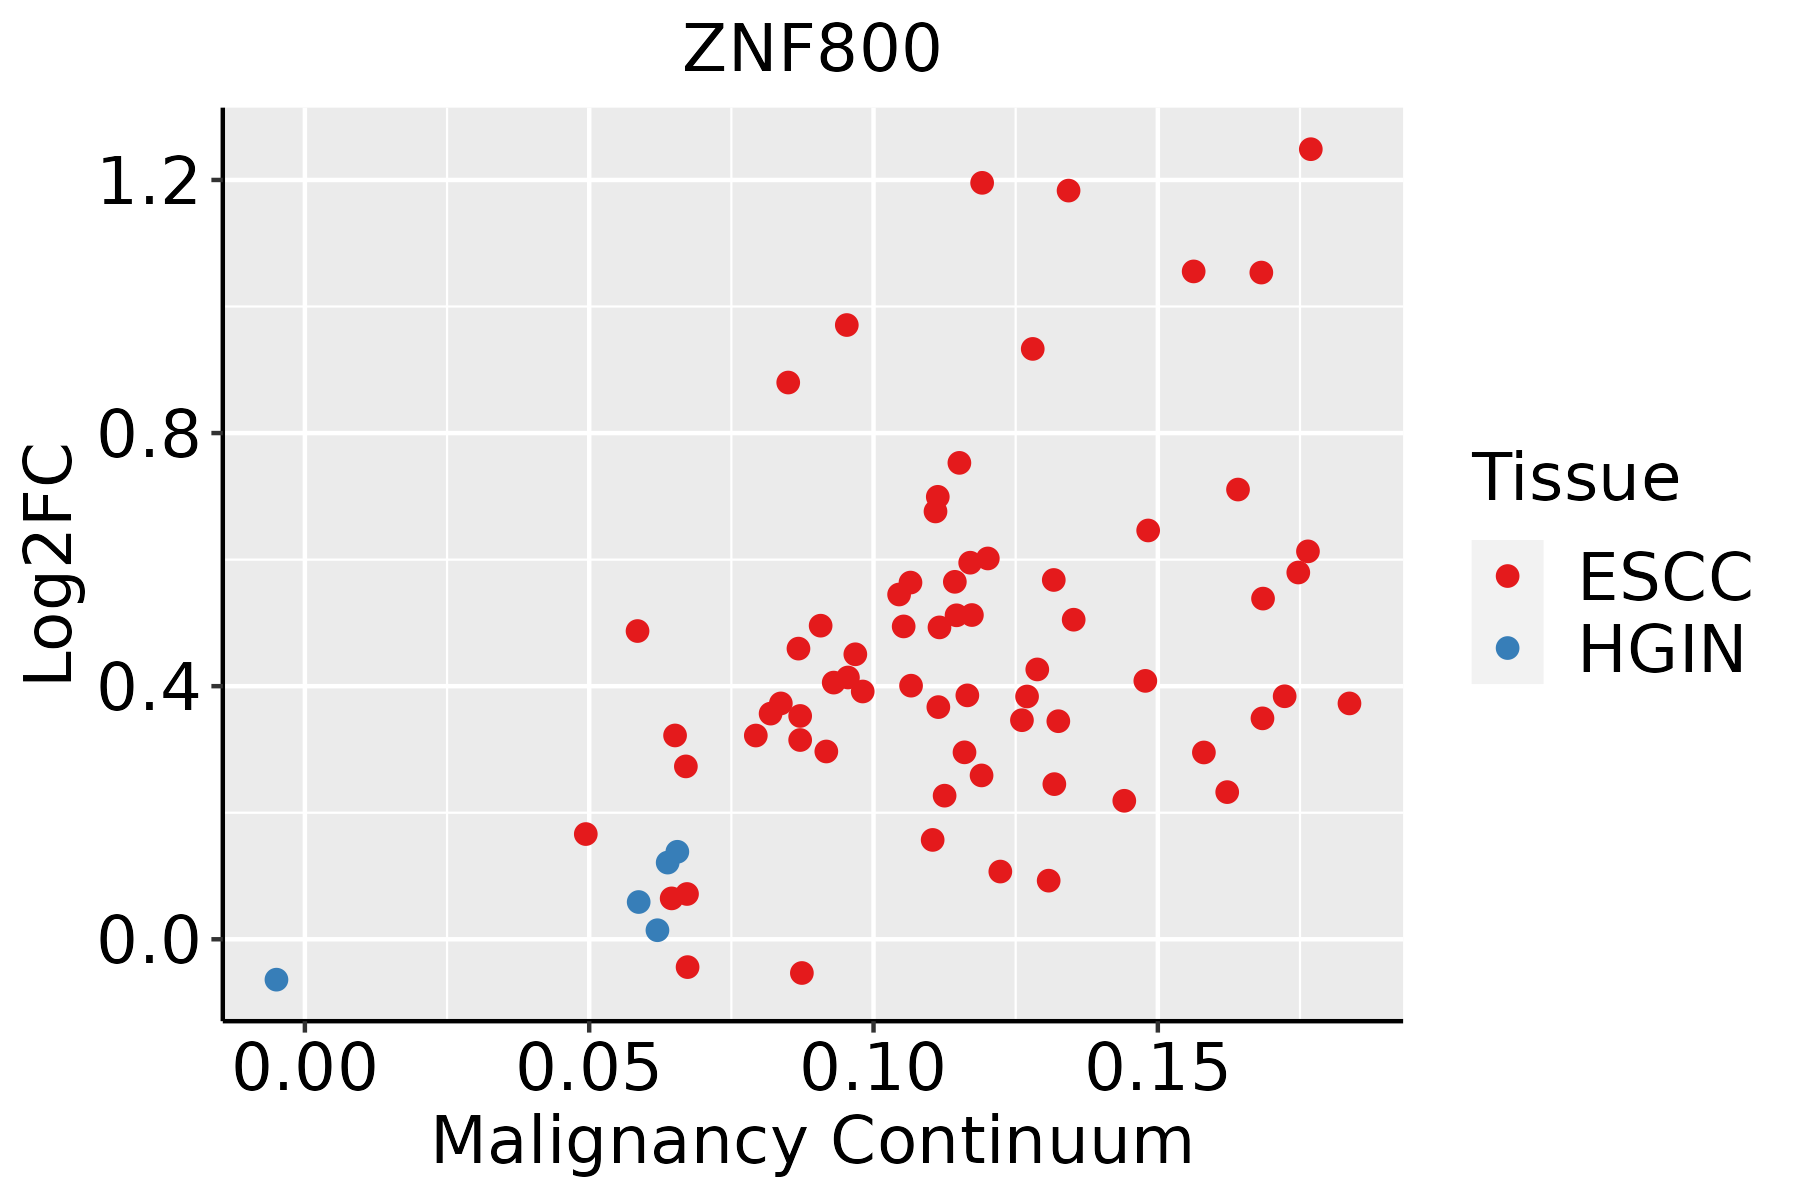 | ESCC: Esophageal squamous cell carcinoma |
| HGIN: High-grade intraepithelial neoplasias | ||
| LGIN: Low-grade intraepithelial neoplasias | ||
| Liver | 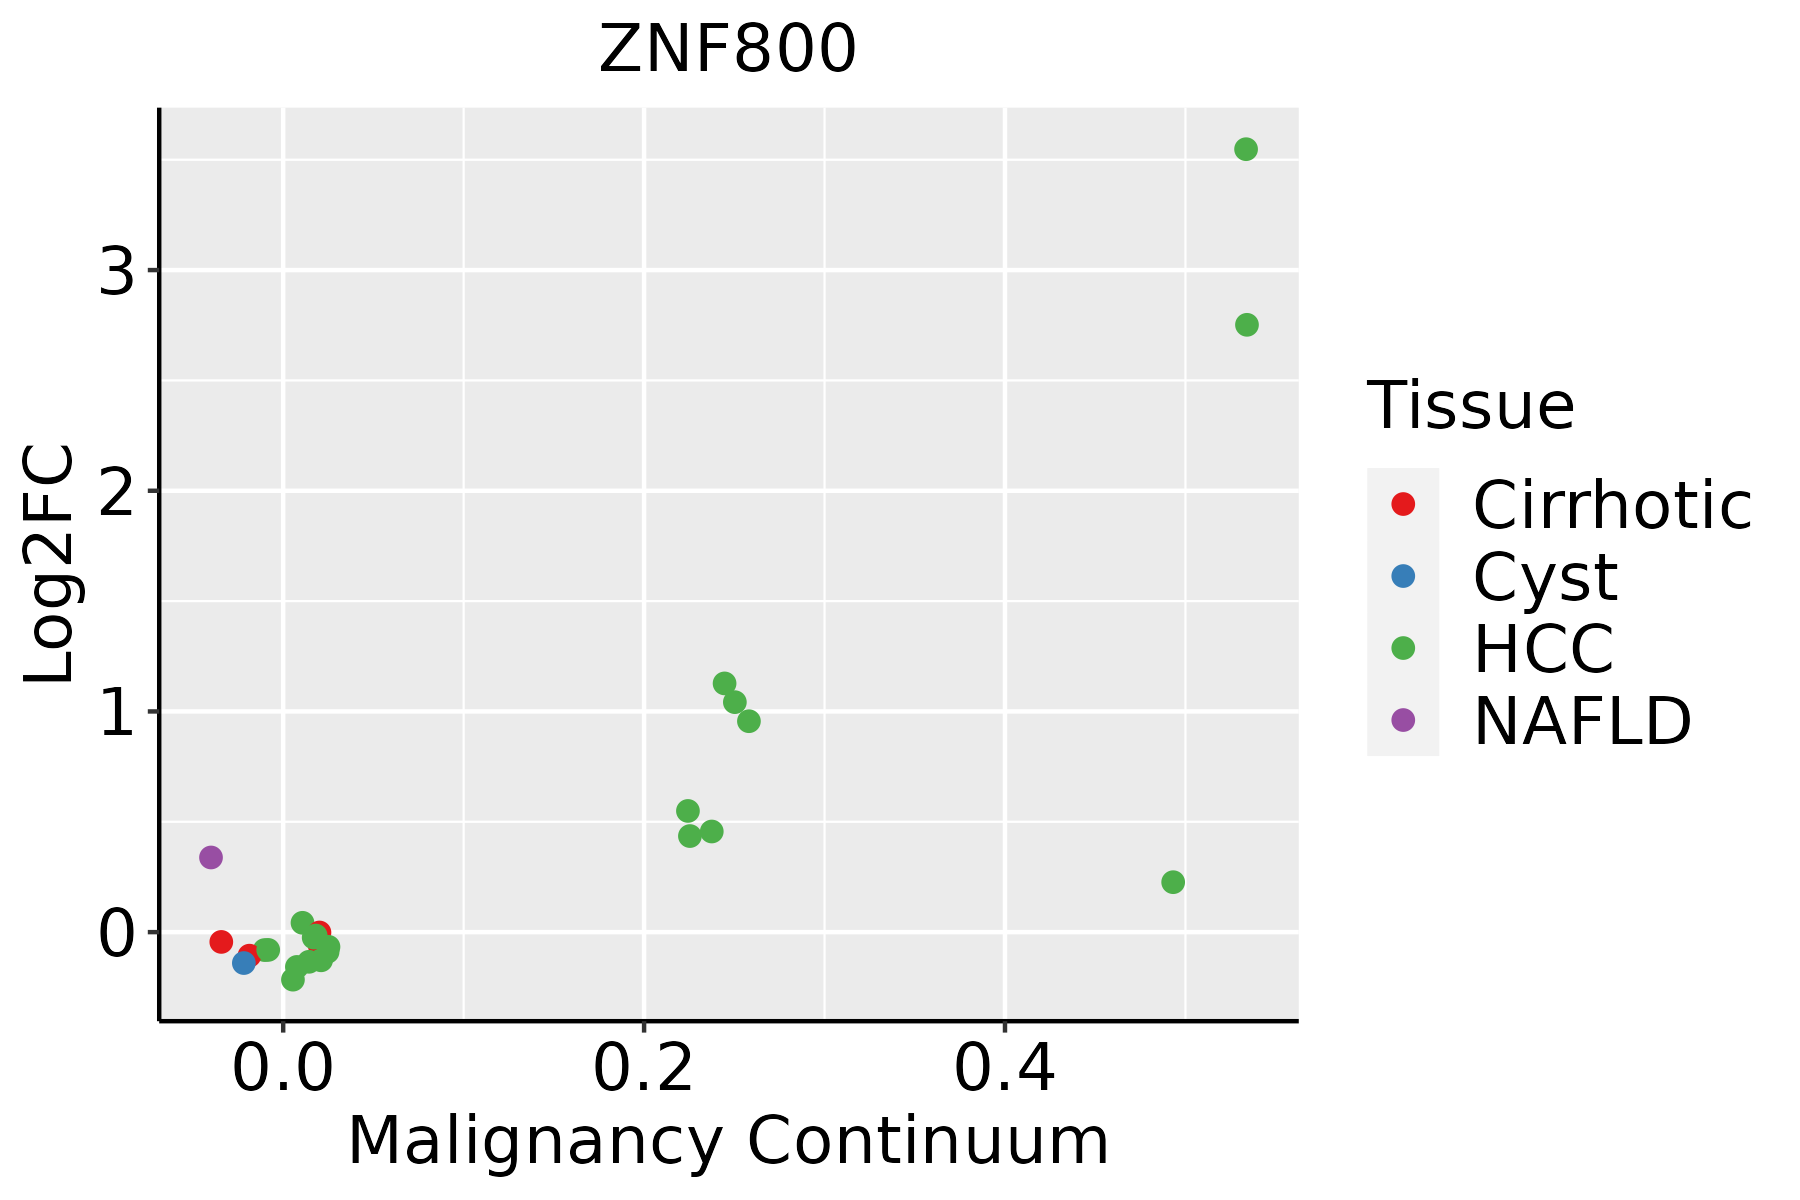 | HCC: Hepatocellular carcinoma |
| NAFLD: Non-alcoholic fatty liver disease | ||
| Oral Cavity | 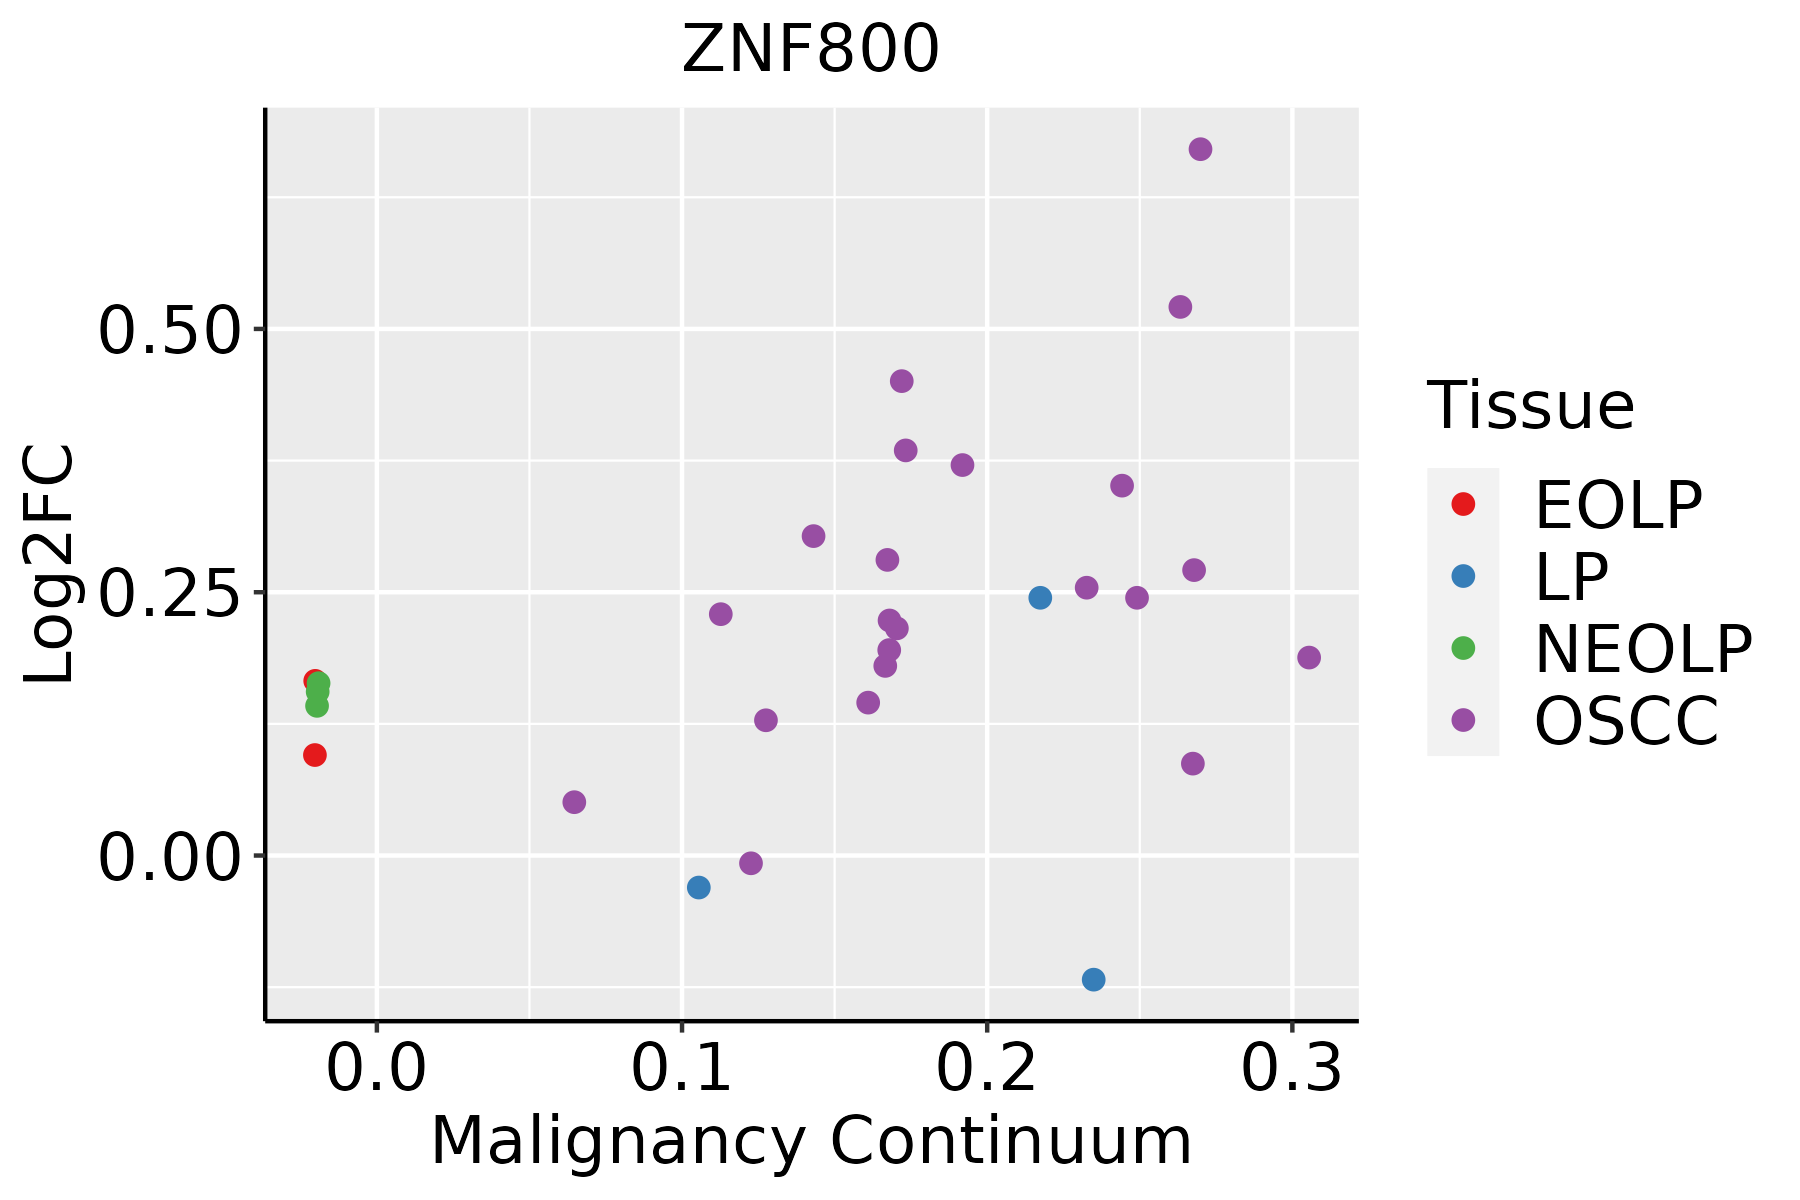 | EOLP: Erosive Oral lichen planus |
| LP: leukoplakia | ||
| NEOLP: Non-erosive oral lichen planus | ||
| OSCC: Oral squamous cell carcinoma | ||
| Thyroid | 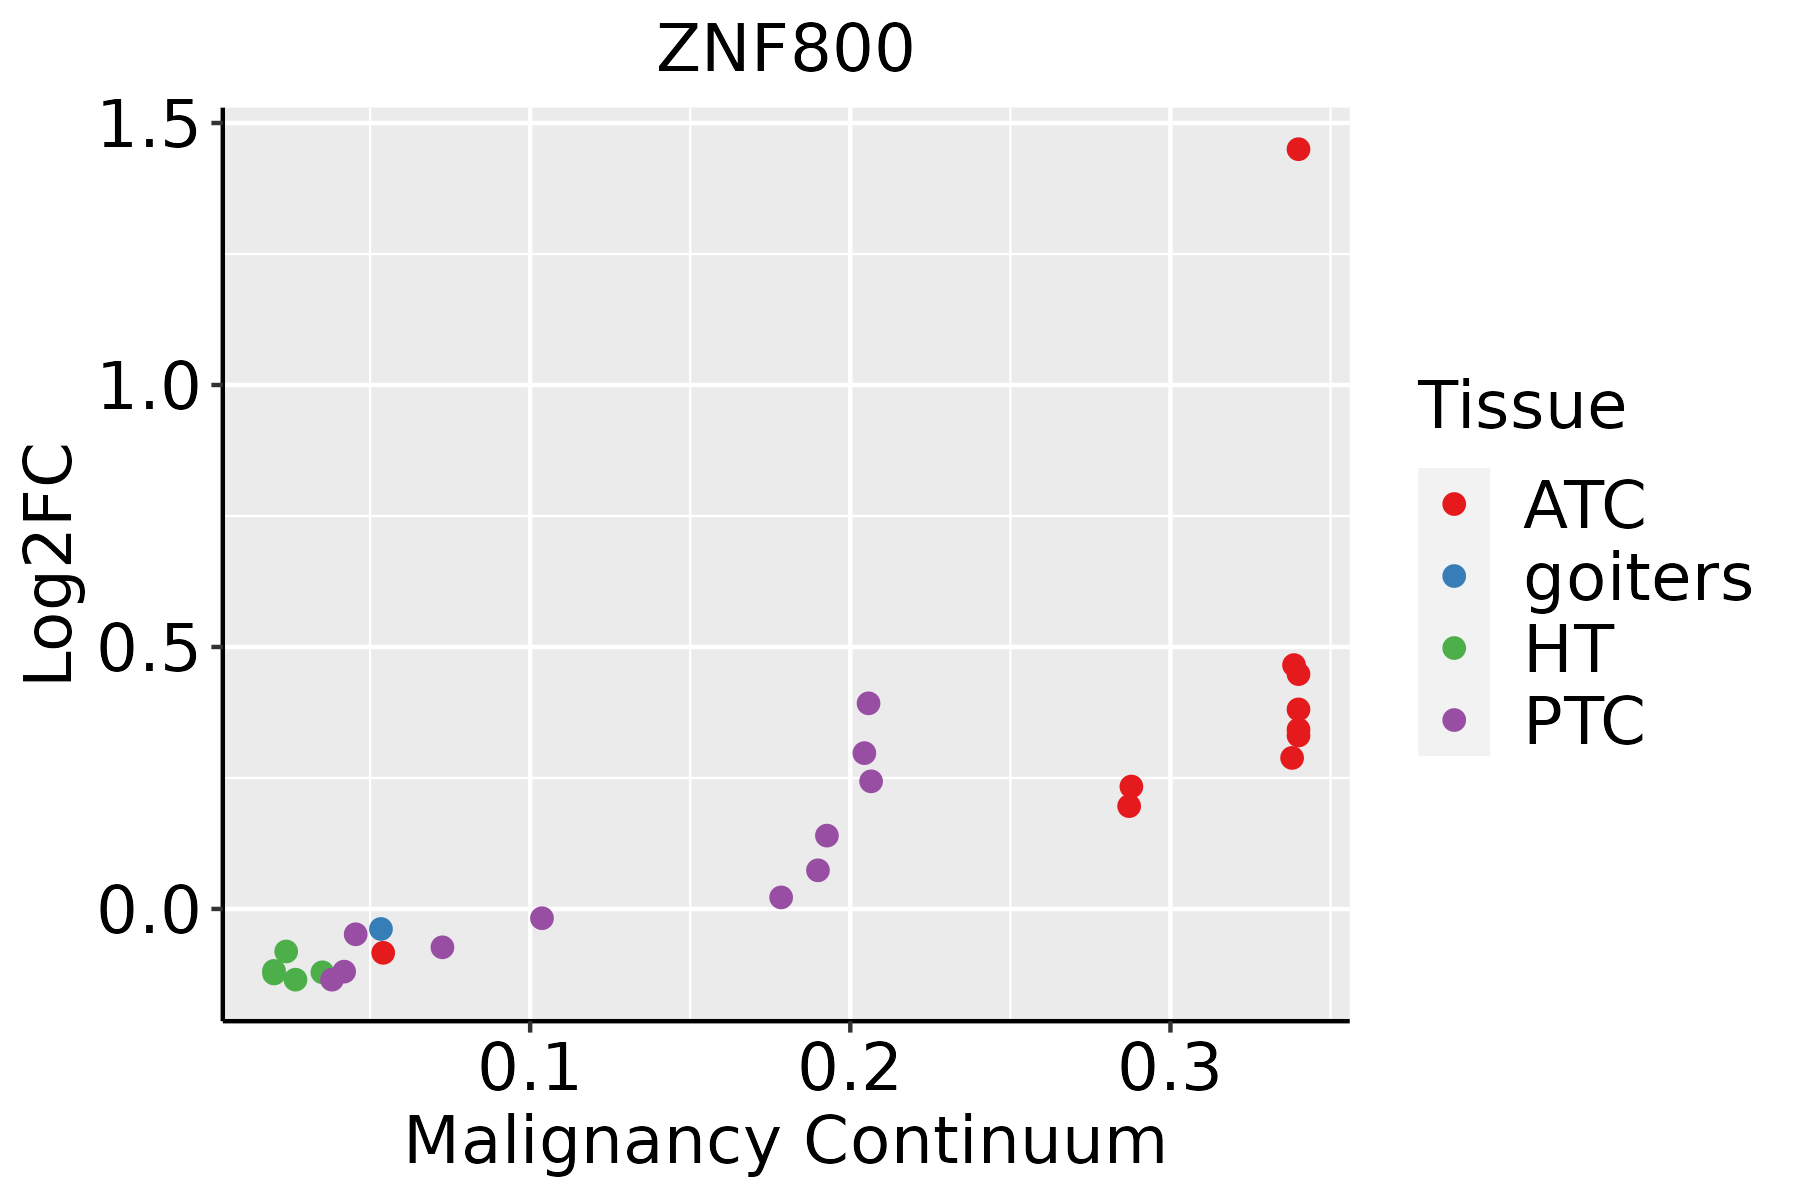 | ATC: Anaplastic thyroid cancer |
| HT: Hashimoto's thyroiditis | ||
| PTC: Papillary thyroid cancer |
| ∗log2FC in expression of this searched gene in stem-like cells from each diseased tissue sample relative to stem-like cells in normal samples in each tissue plotted against the malignancy continuum. Samples are colored based on if they are from different disease stage. |
Top |
Malignant transformation related pathway analysis |
| Find out the enriched GO biological processes and KEGG pathways involved in transition from healthy to precancer to cancer |
| Tissue | Disease Stage | Enriched GO biological Processes |
| Colorectum | AD |  |
| Colorectum | SER |  |
| Colorectum | MSS |  |
| Colorectum | MSI-H |  |
| Colorectum | FAP |  |
| ∗Top 15 enriched GO BP terms are showed in the bar plot of each disease state in each tissue. Each row represents a significant GO biological process which is colored according to the -log10(p.adjust). |
| Page: 1 2 3 4 5 6 7 8 9 |
| GO ID | Tissue | Disease Stage | Description | Gene Ratio | Bg Ratio | pvalue | p.adjust | Count |
| Page: 1 |
| Pathway ID | Tissue | Disease Stage | Description | Gene Ratio | Bg Ratio | pvalue | p.adjust | qvalue | Count |
| Page: 1 |
Top |
Cell-cell communication analysis |
| Identification of potential cell-cell interactions between two cell types and their ligand-receptor pairs for different disease states |
| Ligand | Receptor | LRpair | Pathway | Tissue | Disease Stage |
| Page: 1 |
Top |
Single-cell gene regulatory network inference analysis |
| Find out the significant the regulons (TFs) and the target genes of each regulon across cell types for different disease states |
| TF | Cell Type | Tissue | Disease Stage | Target Gene | RSS | Regulon Activity |
| ∗The dot plots of a searched regulon are shown for all cell subpopulations in each disease state of each tissue based on the regulon specific score inferred using pySCENIC and by calculating the average expression. |
| Page: 1 |
Top |
Somatic mutation of malignant transformation related genes |
| Annotation of somatic variants for genes involved in malignant transformation |
| Hugo Symbol | Variant Class | Variant Classification | dbSNP RS | HGVSc | HGVSp | HGVSp Short | SWISSPROT | BIOTYPE | SIFT | PolyPhen | Tumor Sample Barcode | Tissue | Histology | Sex | Age | Stage | Therapy Types | Drugs | Outcome |
| ZNF800 | SNV | Missense_Mutation | c.942G>C | p.Arg314Ser | p.R314S | Q2TB10 | protein_coding | deleterious(0) | benign(0.354) | TCGA-A8-A07W-01 | Breast | breast invasive carcinoma | Female | >=65 | III/IV | Hormone Therapy | exemestane | SD | |
| ZNF800 | SNV | Missense_Mutation | novel | c.800G>A | p.Arg267Gln | p.R267Q | Q2TB10 | protein_coding | tolerated(0.17) | benign(0.003) | TCGA-AN-A046-01 | Breast | breast invasive carcinoma | Female | >=65 | I/II | Unknown | Unknown | SD |
| ZNF800 | SNV | Missense_Mutation | rs774806951 | c.821N>T | p.Ser274Phe | p.S274F | Q2TB10 | protein_coding | tolerated(0.08) | benign(0.276) | TCGA-C8-A3M7-01 | Breast | breast invasive carcinoma | Female | <65 | III/IV | Unknown | Unknown | PD |
| ZNF800 | deletion | Frame_Shift_Del | c.1688delN | p.Lys563SerfsTer7 | p.K563Sfs*7 | Q2TB10 | protein_coding | TCGA-BH-A18G-01 | Breast | breast invasive carcinoma | Female | >=65 | I/II | Unknown | Unknown | SD | |||
| ZNF800 | SNV | Missense_Mutation | c.1135N>G | p.Gln379Glu | p.Q379E | Q2TB10 | protein_coding | tolerated(0.44) | benign(0.181) | TCGA-EK-A2PL-01 | Cervix | cervical & endocervical cancer | Female | <65 | III/IV | Unknown | Unknown | SD | |
| ZNF800 | SNV | Missense_Mutation | c.510N>G | p.Ile170Met | p.I170M | Q2TB10 | protein_coding | tolerated(0.23) | benign(0) | TCGA-Q1-A73Q-01 | Cervix | cervical & endocervical cancer | Female | <65 | I/II | Chemotherapy | cisplatin | SD | |
| ZNF800 | SNV | Missense_Mutation | novel | c.1730C>A | p.Pro577His | p.P577H | Q2TB10 | protein_coding | tolerated(0.08) | benign(0.423) | TCGA-VS-A94Z-01 | Cervix | cervical & endocervical cancer | Female | <65 | I/II | Chemotherapy | cisplatin | CR |
| ZNF800 | SNV | Missense_Mutation | c.1799A>G | p.Tyr600Cys | p.Y600C | Q2TB10 | protein_coding | tolerated(0.16) | possibly_damaging(0.737) | TCGA-AA-3977-01 | Colorectum | colon adenocarcinoma | Male | >=65 | I/II | Unknown | Unknown | SD | |
| ZNF800 | SNV | Missense_Mutation | rs754742474 | c.443C>T | p.Ser148Leu | p.S148L | Q2TB10 | protein_coding | deleterious(0.03) | benign(0.104) | TCGA-AA-3977-01 | Colorectum | colon adenocarcinoma | Male | >=65 | I/II | Unknown | Unknown | SD |
| ZNF800 | SNV | Missense_Mutation | rs757156460 | c.749N>A | p.Arg250Gln | p.R250Q | Q2TB10 | protein_coding | tolerated(0.07) | benign(0.416) | TCGA-AA-A00N-01 | Colorectum | colon adenocarcinoma | Male | >=65 | I/II | Unknown | Unknown | PD |
| Page: 1 2 3 4 5 6 7 8 9 10 11 |
Top |
Related drugs of malignant transformation related genes |
| Identification of chemicals and drugs interact with genes involved in malignant transfromation |
| (DGIdb 4.0) |
| Entrez ID | Symbol | Category | Interaction Types | Drug Claim Name | Drug Name | PMIDs |
| Page: 1 |

Copyright 2023-Present -The University of Texas Health Science Center at Houston |