
|
|||||
|
 | |
| |
| |
| |
| |
| |
|
Gene: ZNF330 |
Gene summary for ZNF330 |
| Gene information | Species | Human | Gene symbol | ZNF330 | Gene ID | 27309 |
| Gene name | zinc finger protein 330 | |
| Gene Alias | HSA6591 | |
| Cytomap | 4q31.21 | |
| Gene Type | protein-coding | GO ID | GO:0008150 | UniProtAcc | B4DFG9 |
Top |
Malignant transformation analysis |
| Identification of the aberrant gene expression in precancerous and cancerous lesions by comparing the gene expression of stem-like cells in diseased tissues with normal stem cells |
| Entrez ID | Symbol | Replicates | Species | Organ | Tissue | Adj P-value | Log2FC | Malignancy |
| 27309 | ZNF330 | HCC2_Meng | Human | Liver | HCC | 5.52e-14 | 3.31e-02 | 0.0107 |
| 27309 | ZNF330 | HCC2 | Human | Liver | HCC | 1.99e-04 | 3.29e+00 | 0.5341 |
| 27309 | ZNF330 | Pt13.b | Human | Liver | HCC | 6.92e-03 | 5.28e-02 | 0.0251 |
| 27309 | ZNF330 | S014 | Human | Liver | HCC | 4.48e-08 | 5.20e-01 | 0.2254 |
| 27309 | ZNF330 | S015 | Human | Liver | HCC | 8.56e-06 | 4.78e-01 | 0.2375 |
| 27309 | ZNF330 | S016 | Human | Liver | HCC | 8.39e-05 | 4.30e-01 | 0.2243 |
| 27309 | ZNF330 | S028 | Human | Liver | HCC | 3.71e-07 | 5.47e-01 | 0.2503 |
| 27309 | ZNF330 | S029 | Human | Liver | HCC | 1.41e-06 | 5.96e-01 | 0.2581 |
| 27309 | ZNF330 | C04 | Human | Oral cavity | OSCC | 1.36e-09 | 8.19e-01 | 0.2633 |
| 27309 | ZNF330 | C21 | Human | Oral cavity | OSCC | 8.96e-21 | 6.74e-01 | 0.2678 |
| 27309 | ZNF330 | C30 | Human | Oral cavity | OSCC | 8.01e-16 | 7.95e-01 | 0.3055 |
| 27309 | ZNF330 | C43 | Human | Oral cavity | OSCC | 3.16e-20 | 4.22e-01 | 0.1704 |
| 27309 | ZNF330 | C46 | Human | Oral cavity | OSCC | 4.77e-09 | 3.21e-01 | 0.1673 |
| 27309 | ZNF330 | C51 | Human | Oral cavity | OSCC | 4.52e-03 | 2.71e-01 | 0.2674 |
| 27309 | ZNF330 | C57 | Human | Oral cavity | OSCC | 4.78e-11 | 5.25e-01 | 0.1679 |
| 27309 | ZNF330 | C08 | Human | Oral cavity | OSCC | 5.54e-19 | 4.80e-01 | 0.1919 |
| 27309 | ZNF330 | C09 | Human | Oral cavity | OSCC | 3.99e-02 | 1.10e-01 | 0.1431 |
| 27309 | ZNF330 | LN46 | Human | Oral cavity | OSCC | 1.19e-08 | 5.39e-01 | 0.1666 |
| 27309 | ZNF330 | SYSMH1 | Human | Oral cavity | OSCC | 1.52e-03 | 6.37e-02 | 0.1127 |
| 27309 | ZNF330 | SYSMH2 | Human | Oral cavity | OSCC | 2.08e-06 | 2.30e-01 | 0.2326 |
| Page: 1 2 3 4 5 |
| Tissue | Expression Dynamics | Abbreviation |
| Esophagus | 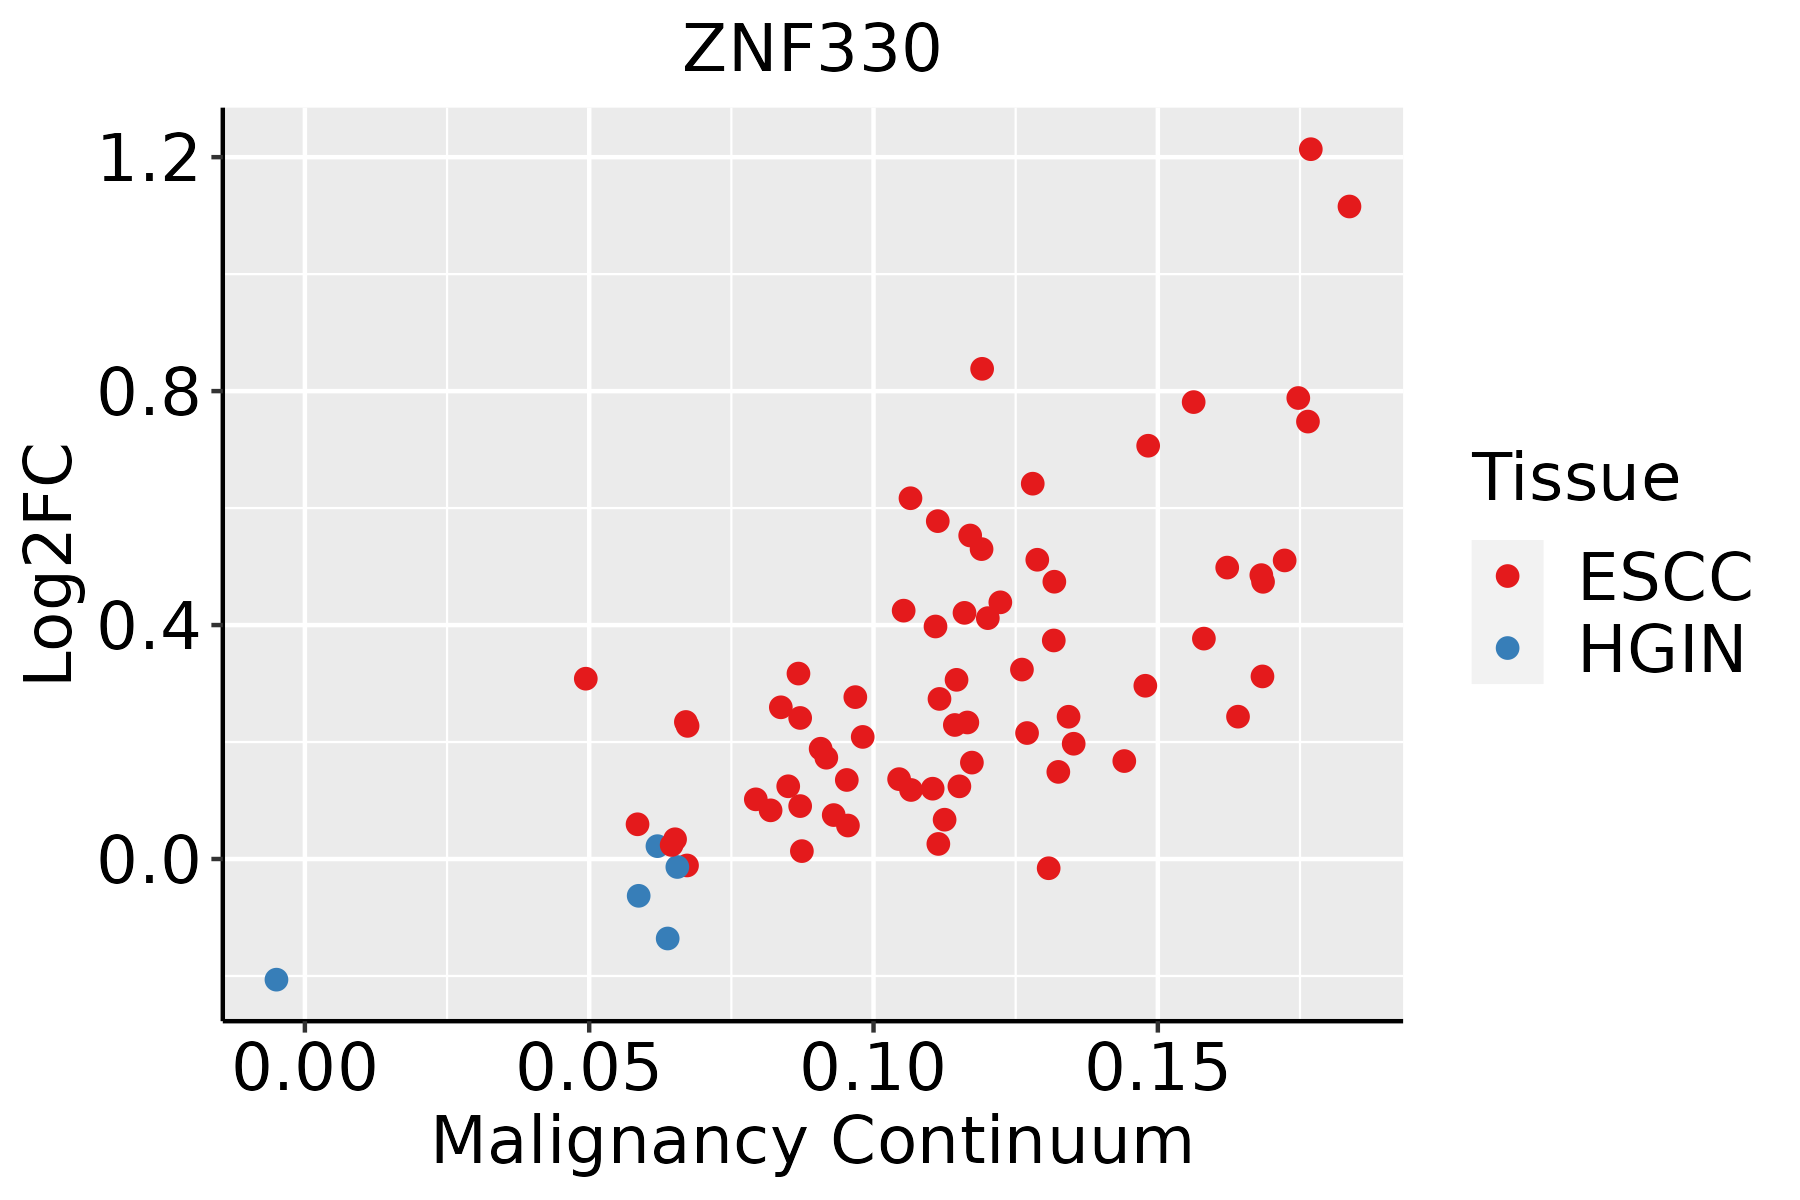 | ESCC: Esophageal squamous cell carcinoma |
| HGIN: High-grade intraepithelial neoplasias | ||
| LGIN: Low-grade intraepithelial neoplasias | ||
| Liver | 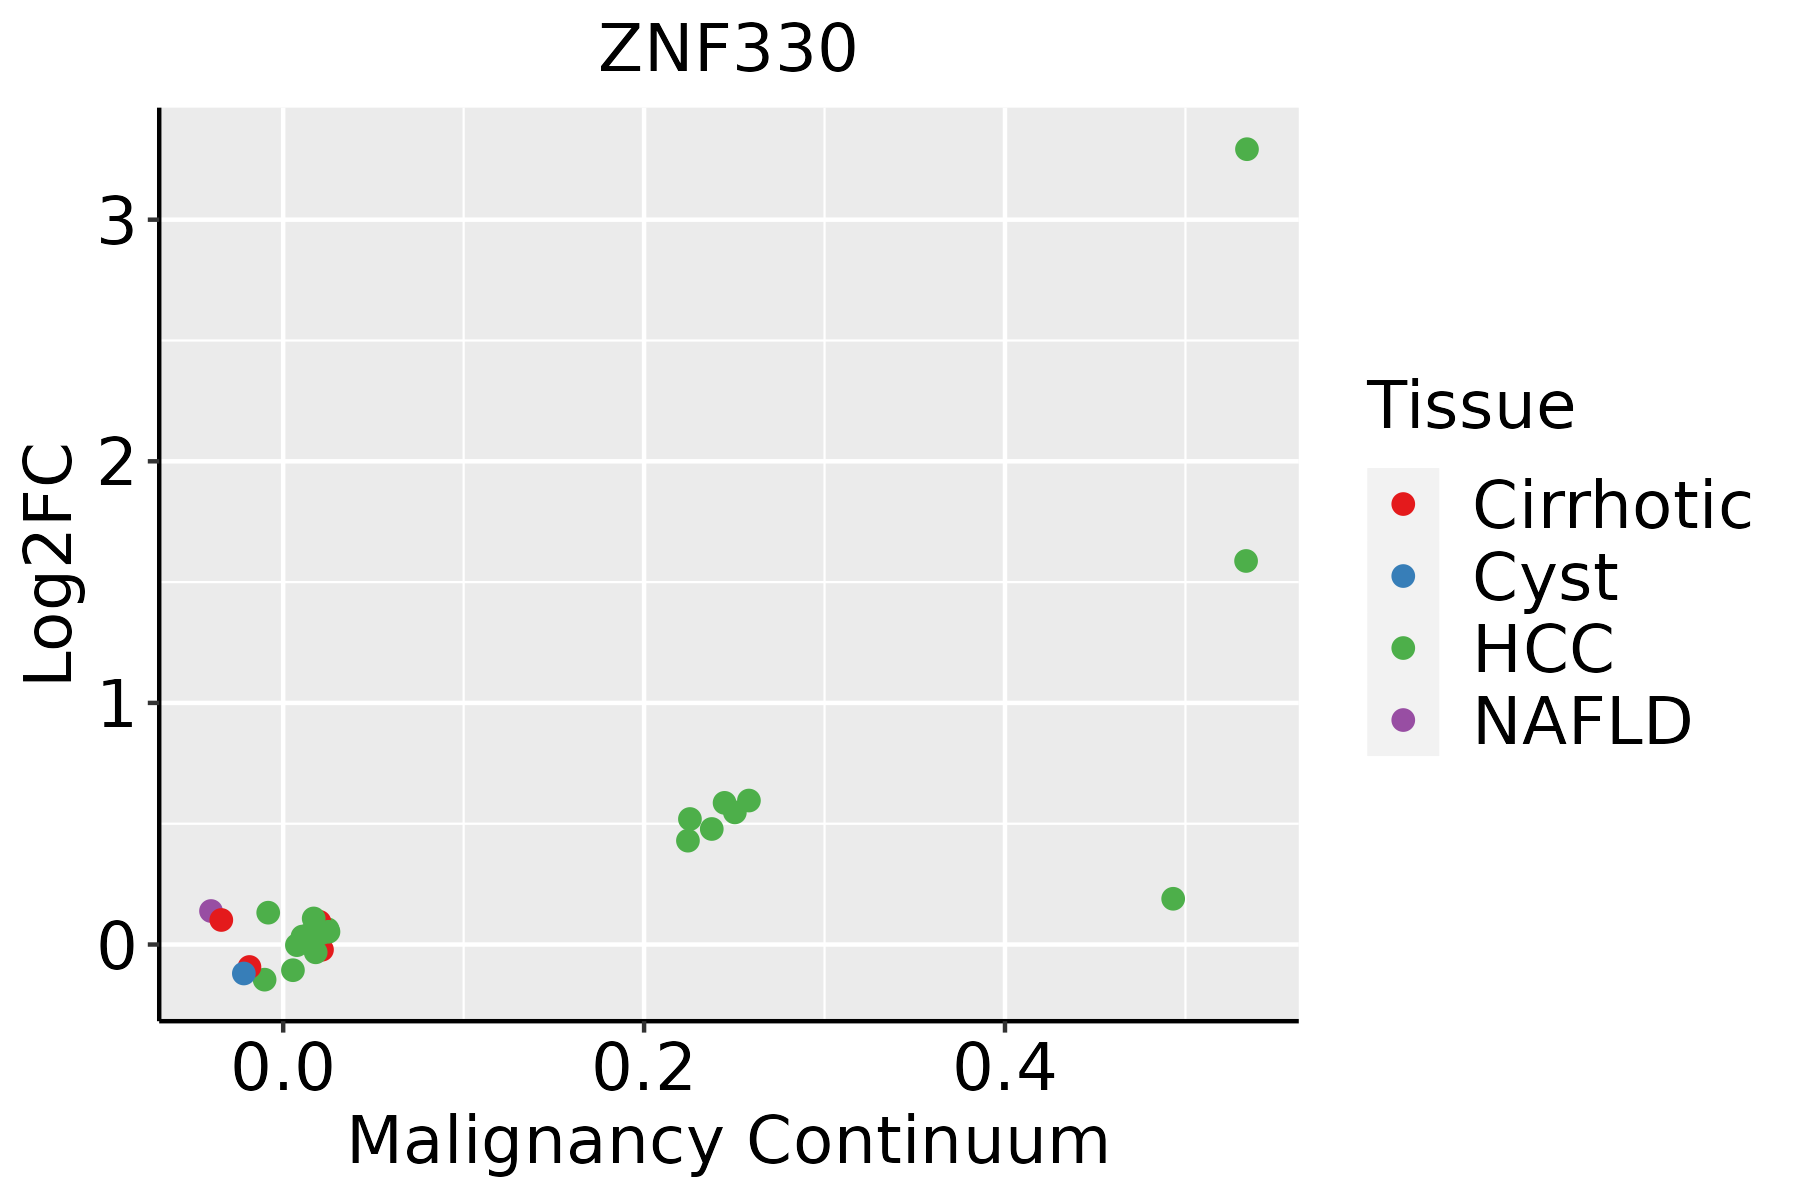 | HCC: Hepatocellular carcinoma |
| NAFLD: Non-alcoholic fatty liver disease | ||
| Oral Cavity |  | EOLP: Erosive Oral lichen planus |
| LP: leukoplakia | ||
| NEOLP: Non-erosive oral lichen planus | ||
| OSCC: Oral squamous cell carcinoma | ||
| Thyroid | 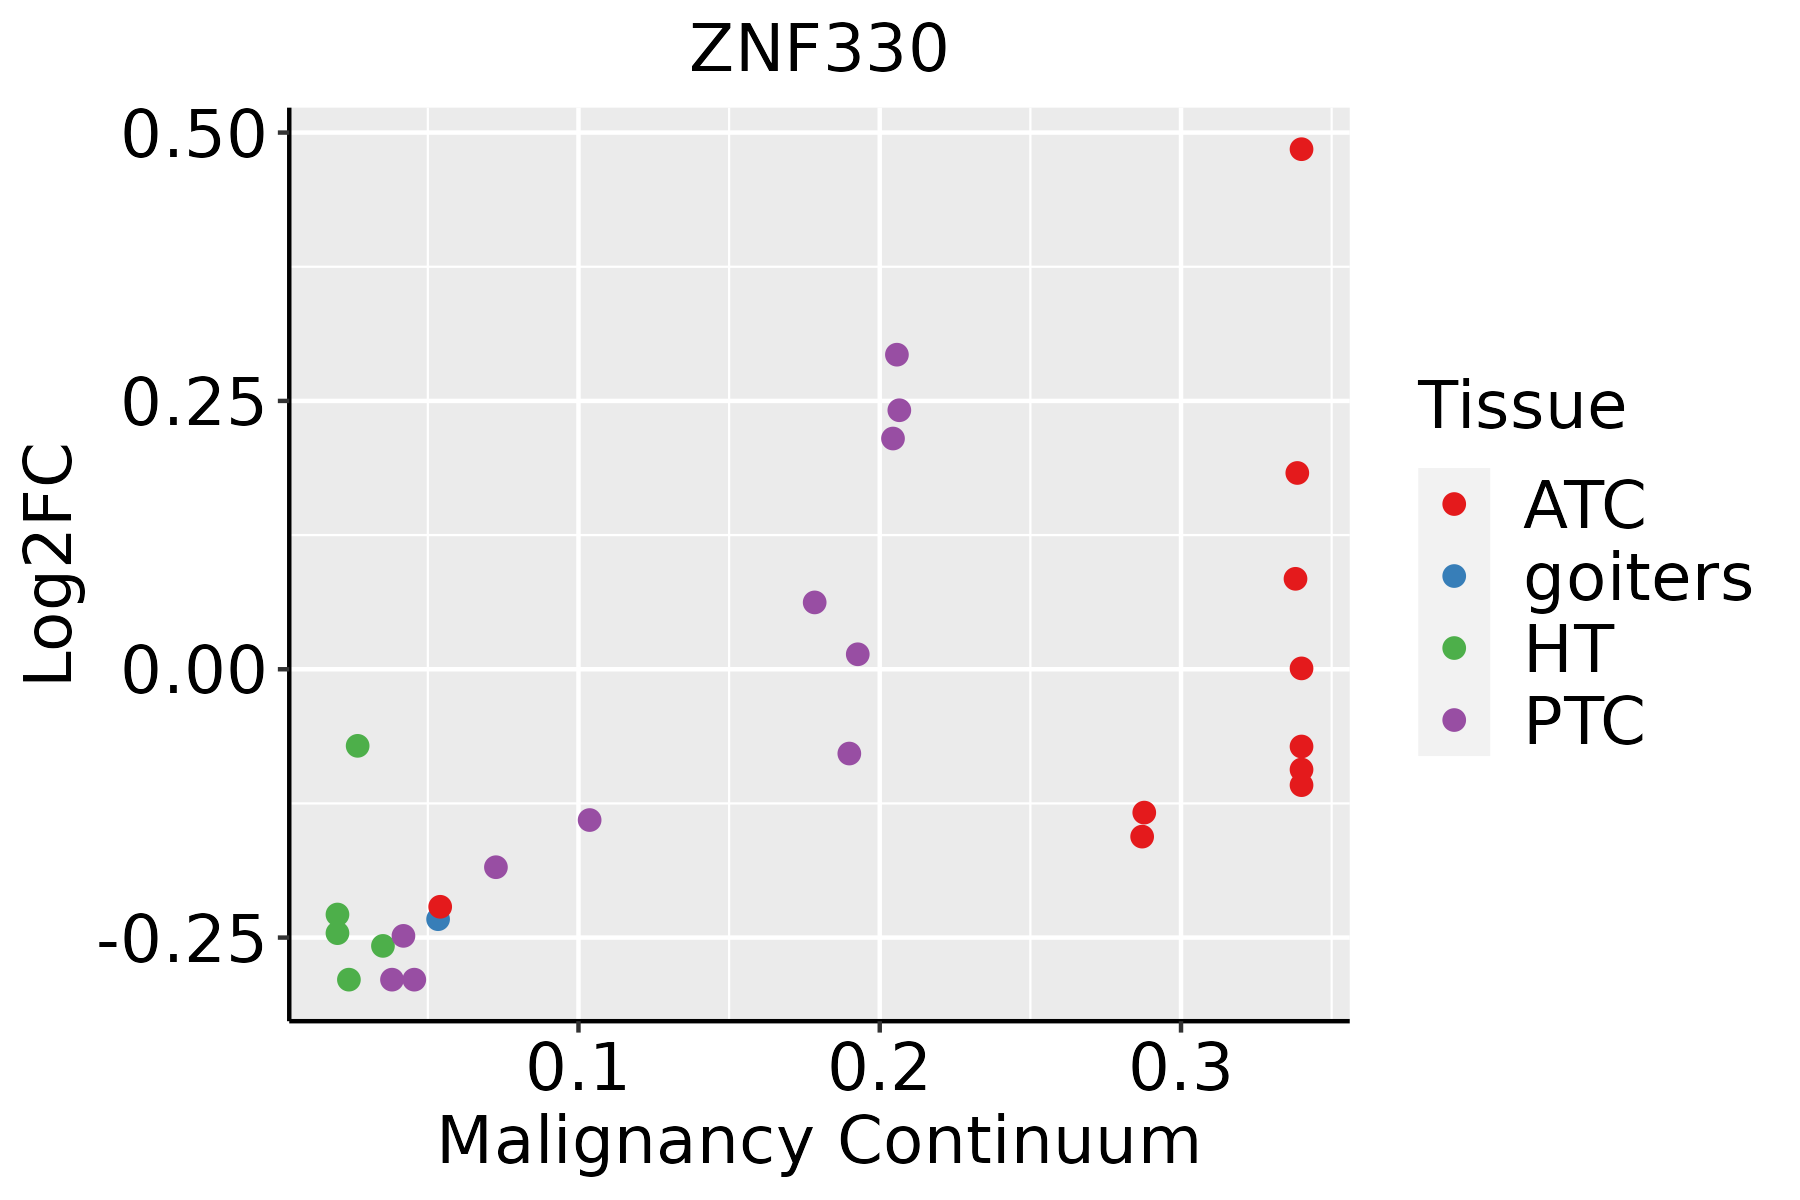 | ATC: Anaplastic thyroid cancer |
| HT: Hashimoto's thyroiditis | ||
| PTC: Papillary thyroid cancer |
| ∗log2FC in expression of this searched gene in stem-like cells from each diseased tissue sample relative to stem-like cells in normal samples in each tissue plotted against the malignancy continuum. Samples are colored based on if they are from different disease stage. |
Top |
Malignant transformation related pathway analysis |
| Find out the enriched GO biological processes and KEGG pathways involved in transition from healthy to precancer to cancer |
| Tissue | Disease Stage | Enriched GO biological Processes |
| Colorectum | AD |  |
| Colorectum | SER |  |
| Colorectum | MSS |  |
| Colorectum | MSI-H |  |
| Colorectum | FAP |  |
| ∗Top 15 enriched GO BP terms are showed in the bar plot of each disease state in each tissue. Each row represents a significant GO biological process which is colored according to the -log10(p.adjust). |
| Page: 1 2 3 4 5 6 7 8 9 |
| GO ID | Tissue | Disease Stage | Description | Gene Ratio | Bg Ratio | pvalue | p.adjust | Count |
| Page: 1 |
| Pathway ID | Tissue | Disease Stage | Description | Gene Ratio | Bg Ratio | pvalue | p.adjust | qvalue | Count |
| Page: 1 |
Top |
Cell-cell communication analysis |
| Identification of potential cell-cell interactions between two cell types and their ligand-receptor pairs for different disease states |
| Ligand | Receptor | LRpair | Pathway | Tissue | Disease Stage |
| Page: 1 |
Top |
Single-cell gene regulatory network inference analysis |
| Find out the significant the regulons (TFs) and the target genes of each regulon across cell types for different disease states |
| TF | Cell Type | Tissue | Disease Stage | Target Gene | RSS | Regulon Activity |
| ∗The dot plots of a searched regulon are shown for all cell subpopulations in each disease state of each tissue based on the regulon specific score inferred using pySCENIC and by calculating the average expression. |
| Page: 1 |
Top |
Somatic mutation of malignant transformation related genes |
| Annotation of somatic variants for genes involved in malignant transformation |
| Hugo Symbol | Variant Class | Variant Classification | dbSNP RS | HGVSc | HGVSp | HGVSp Short | SWISSPROT | BIOTYPE | SIFT | PolyPhen | Tumor Sample Barcode | Tissue | Histology | Sex | Age | Stage | Therapy Types | Drugs | Outcome |
| ZNF330 | SNV | Missense_Mutation | c.477N>A | p.Phe159Leu | p.F159L | Q9Y3S2 | protein_coding | deleterious(0.04) | benign(0.331) | TCGA-AR-A1AI-01 | Breast | breast invasive carcinoma | Female | <65 | I/II | Chemotherapy | cytoxan | PD | |
| ZNF330 | SNV | Missense_Mutation | rs375158856 | c.779A>G | p.Asp260Gly | p.D260G | Q9Y3S2 | protein_coding | tolerated_low_confidence(0.67) | benign(0) | TCGA-BH-A0BL-01 | Breast | breast invasive carcinoma | Female | <65 | I/II | Chemotherapy | adriamycin | CR |
| ZNF330 | SNV | Missense_Mutation | c.374N>A | p.Thr125Asn | p.T125N | Q9Y3S2 | protein_coding | tolerated(0.33) | benign(0.062) | TCGA-E9-A1R7-01 | Breast | breast invasive carcinoma | Female | <65 | I/II | Hormone Therapy | fareston | SD | |
| ZNF330 | insertion | Frame_Shift_Ins | rs770975379 | c.14dupA | p.Thr6AspfsTer8 | p.T6Dfs*8 | Q9Y3S2 | protein_coding | TCGA-A8-A09Z-01 | Breast | breast invasive carcinoma | Female | >=65 | I/II | Unknown | Unknown | SD | ||
| ZNF330 | deletion | Frame_Shift_Del | novel | c.252delN | p.Lys85SerfsTer84 | p.K85Sfs*84 | Q9Y3S2 | protein_coding | TCGA-EW-A2FV-01 | Breast | breast invasive carcinoma | Female | <65 | III/IV | Chemotherapy | docetaxel | SD | ||
| ZNF330 | SNV | Missense_Mutation | c.124N>G | p.Cys42Gly | p.C42G | Q9Y3S2 | protein_coding | deleterious(0) | probably_damaging(0.995) | TCGA-FU-A3HZ-01 | Cervix | cervical & endocervical cancer | Female | <65 | I/II | Chemotherapy | cisplatin | CR | |
| ZNF330 | SNV | Missense_Mutation | novel | c.472N>G | p.Gln158Glu | p.Q158E | Q9Y3S2 | protein_coding | deleterious(0) | probably_damaging(0.959) | TCGA-ZJ-AAXU-01 | Cervix | cervical & endocervical cancer | Female | <65 | I/II | Unknown | Unknown | SD |
| ZNF330 | SNV | Missense_Mutation | c.805N>A | p.Asp269Asn | p.D269N | Q9Y3S2 | protein_coding | tolerated_low_confidence(0.37) | benign(0.333) | TCGA-A6-3809-01 | Colorectum | colon adenocarcinoma | Female | >=65 | I/II | Unknown | Unknown | SD | |
| ZNF330 | SNV | Missense_Mutation | c.695N>T | p.Ser232Phe | p.S232F | Q9Y3S2 | protein_coding | deleterious(0) | possibly_damaging(0.697) | TCGA-AY-4071-01 | Colorectum | colon adenocarcinoma | Female | <65 | I/II | Unknown | Unknown | SD | |
| ZNF330 | SNV | Missense_Mutation | c.23C>T | p.Ala8Val | p.A8V | Q9Y3S2 | protein_coding | tolerated(0.12) | probably_damaging(0.992) | TCGA-G4-6628-01 | Colorectum | colon adenocarcinoma | Male | >=65 | I/II | Unknown | Unknown | SD |
| Page: 1 2 3 4 5 |
Top |
Related drugs of malignant transformation related genes |
| Identification of chemicals and drugs interact with genes involved in malignant transfromation |
| (DGIdb 4.0) |
| Entrez ID | Symbol | Category | Interaction Types | Drug Claim Name | Drug Name | PMIDs |
| Page: 1 |

Copyright 2023-Present -The University of Texas Health Science Center at Houston |