
|
|||||
|
 | |
| |
| |
| |
| |
| |
|
Gene: ZMYM2 |
Gene summary for ZMYM2 |
| Gene information | Species | Human | Gene symbol | ZMYM2 | Gene ID | 7750 |
| Gene name | zinc finger MYM-type containing 2 | |
| Gene Alias | FIM | |
| Cytomap | 13q12.11 | |
| Gene Type | protein-coding | GO ID | GO:0008150 | UniProtAcc | A0A024RDS3 |
Top |
Malignant transformation analysis |
| Identification of the aberrant gene expression in precancerous and cancerous lesions by comparing the gene expression of stem-like cells in diseased tissues with normal stem cells |
| Entrez ID | Symbol | Replicates | Species | Organ | Tissue | Adj P-value | Log2FC | Malignancy |
| 7750 | ZMYM2 | P20T-E | Human | Esophagus | ESCC | 1.84e-12 | 4.01e-01 | 0.1124 |
| 7750 | ZMYM2 | P21T-E | Human | Esophagus | ESCC | 2.75e-21 | 2.88e-01 | 0.1617 |
| 7750 | ZMYM2 | P22T-E | Human | Esophagus | ESCC | 1.51e-16 | 2.82e-01 | 0.1236 |
| 7750 | ZMYM2 | P23T-E | Human | Esophagus | ESCC | 2.57e-15 | 3.24e-01 | 0.108 |
| 7750 | ZMYM2 | P24T-E | Human | Esophagus | ESCC | 3.31e-11 | 2.44e-01 | 0.1287 |
| 7750 | ZMYM2 | P26T-E | Human | Esophagus | ESCC | 1.42e-11 | 1.23e-01 | 0.1276 |
| 7750 | ZMYM2 | P27T-E | Human | Esophagus | ESCC | 1.37e-19 | 4.36e-01 | 0.1055 |
| 7750 | ZMYM2 | P28T-E | Human | Esophagus | ESCC | 4.50e-12 | 2.25e-01 | 0.1149 |
| 7750 | ZMYM2 | P30T-E | Human | Esophagus | ESCC | 1.17e-17 | 6.80e-01 | 0.137 |
| 7750 | ZMYM2 | P31T-E | Human | Esophagus | ESCC | 1.22e-16 | 2.57e-01 | 0.1251 |
| 7750 | ZMYM2 | P32T-E | Human | Esophagus | ESCC | 2.02e-16 | 2.32e-01 | 0.1666 |
| 7750 | ZMYM2 | P36T-E | Human | Esophagus | ESCC | 1.62e-28 | 7.16e-01 | 0.1187 |
| 7750 | ZMYM2 | P37T-E | Human | Esophagus | ESCC | 2.36e-16 | 3.54e-01 | 0.1371 |
| 7750 | ZMYM2 | P39T-E | Human | Esophagus | ESCC | 9.89e-20 | 1.95e-01 | 0.0894 |
| 7750 | ZMYM2 | P40T-E | Human | Esophagus | ESCC | 1.13e-03 | 4.68e-02 | 0.109 |
| 7750 | ZMYM2 | P42T-E | Human | Esophagus | ESCC | 9.68e-12 | 2.66e-01 | 0.1175 |
| 7750 | ZMYM2 | P44T-E | Human | Esophagus | ESCC | 2.09e-15 | 2.40e-01 | 0.1096 |
| 7750 | ZMYM2 | P47T-E | Human | Esophagus | ESCC | 1.93e-26 | 3.64e-01 | 0.1067 |
| 7750 | ZMYM2 | P48T-E | Human | Esophagus | ESCC | 7.86e-19 | 3.28e-01 | 0.0959 |
| 7750 | ZMYM2 | P49T-E | Human | Esophagus | ESCC | 1.59e-14 | 1.52e+00 | 0.1768 |
| Page: 1 2 3 4 5 6 7 8 9 10 |
| Tissue | Expression Dynamics | Abbreviation |
| Cervix | 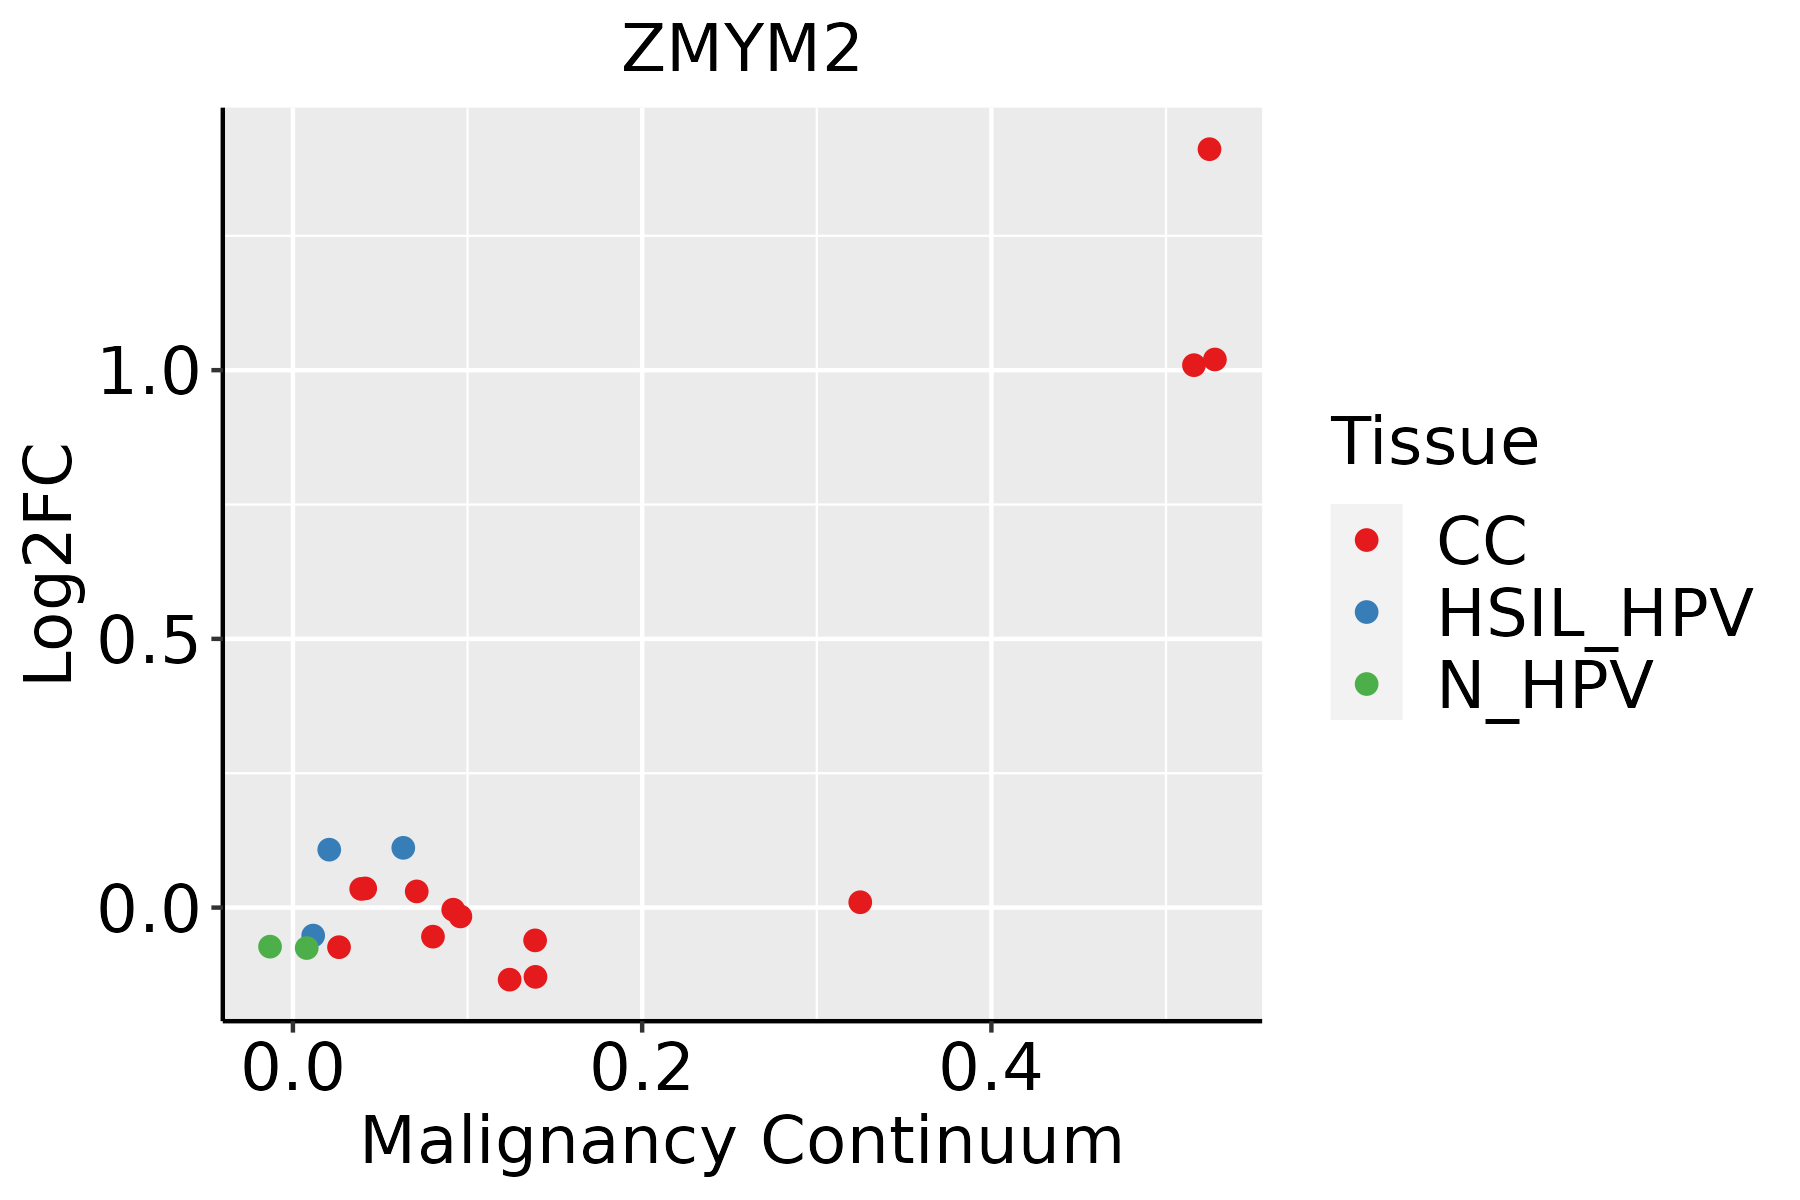 | CC: Cervix cancer |
| HSIL_HPV: HPV-infected high-grade squamous intraepithelial lesions | ||
| N_HPV: HPV-infected normal cervix | ||
| Colorectum (GSE201348) |  | FAP: Familial adenomatous polyposis |
| CRC: Colorectal cancer | ||
| Colorectum (HTA11) |  | AD: Adenomas |
| SER: Sessile serrated lesions | ||
| MSI-H: Microsatellite-high colorectal cancer | ||
| MSS: Microsatellite stable colorectal cancer | ||
| Esophagus | 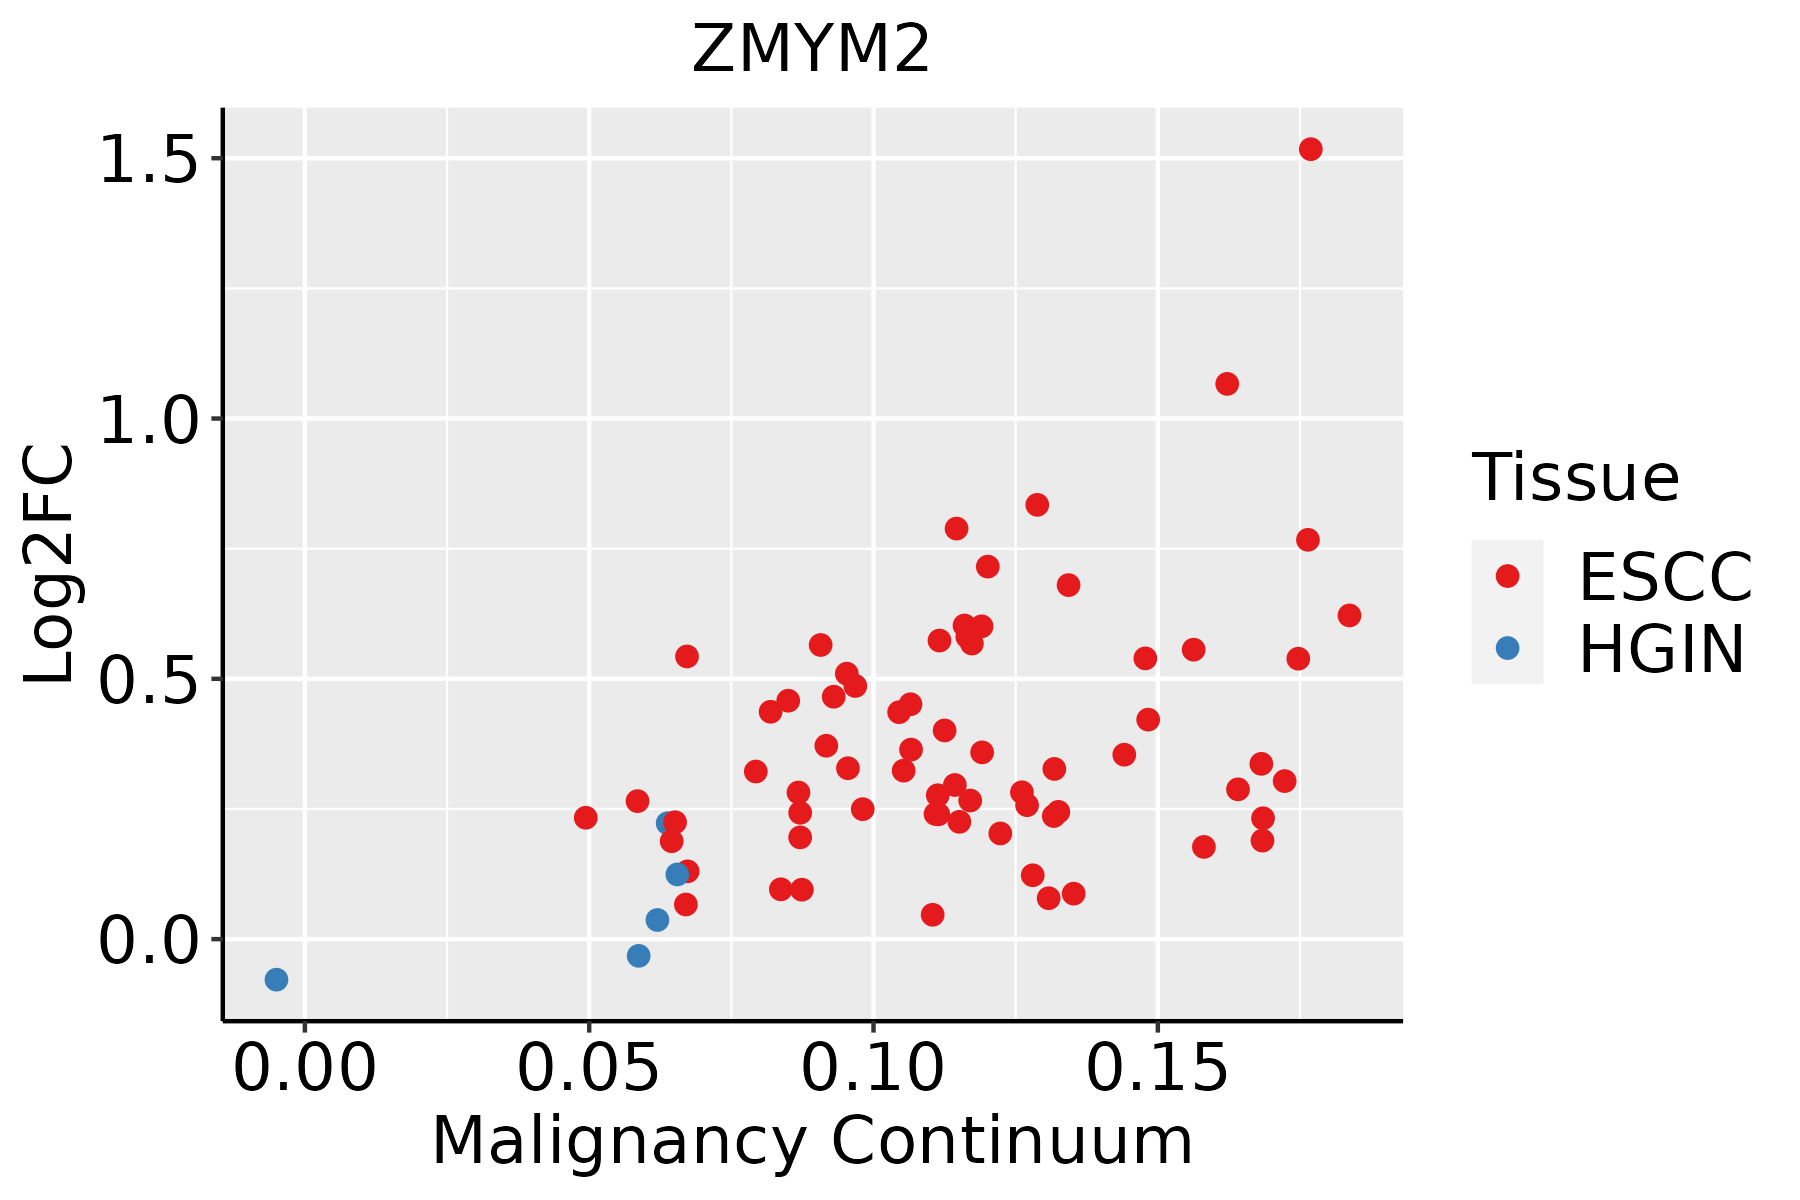 | ESCC: Esophageal squamous cell carcinoma |
| HGIN: High-grade intraepithelial neoplasias | ||
| LGIN: Low-grade intraepithelial neoplasias | ||
| Liver | 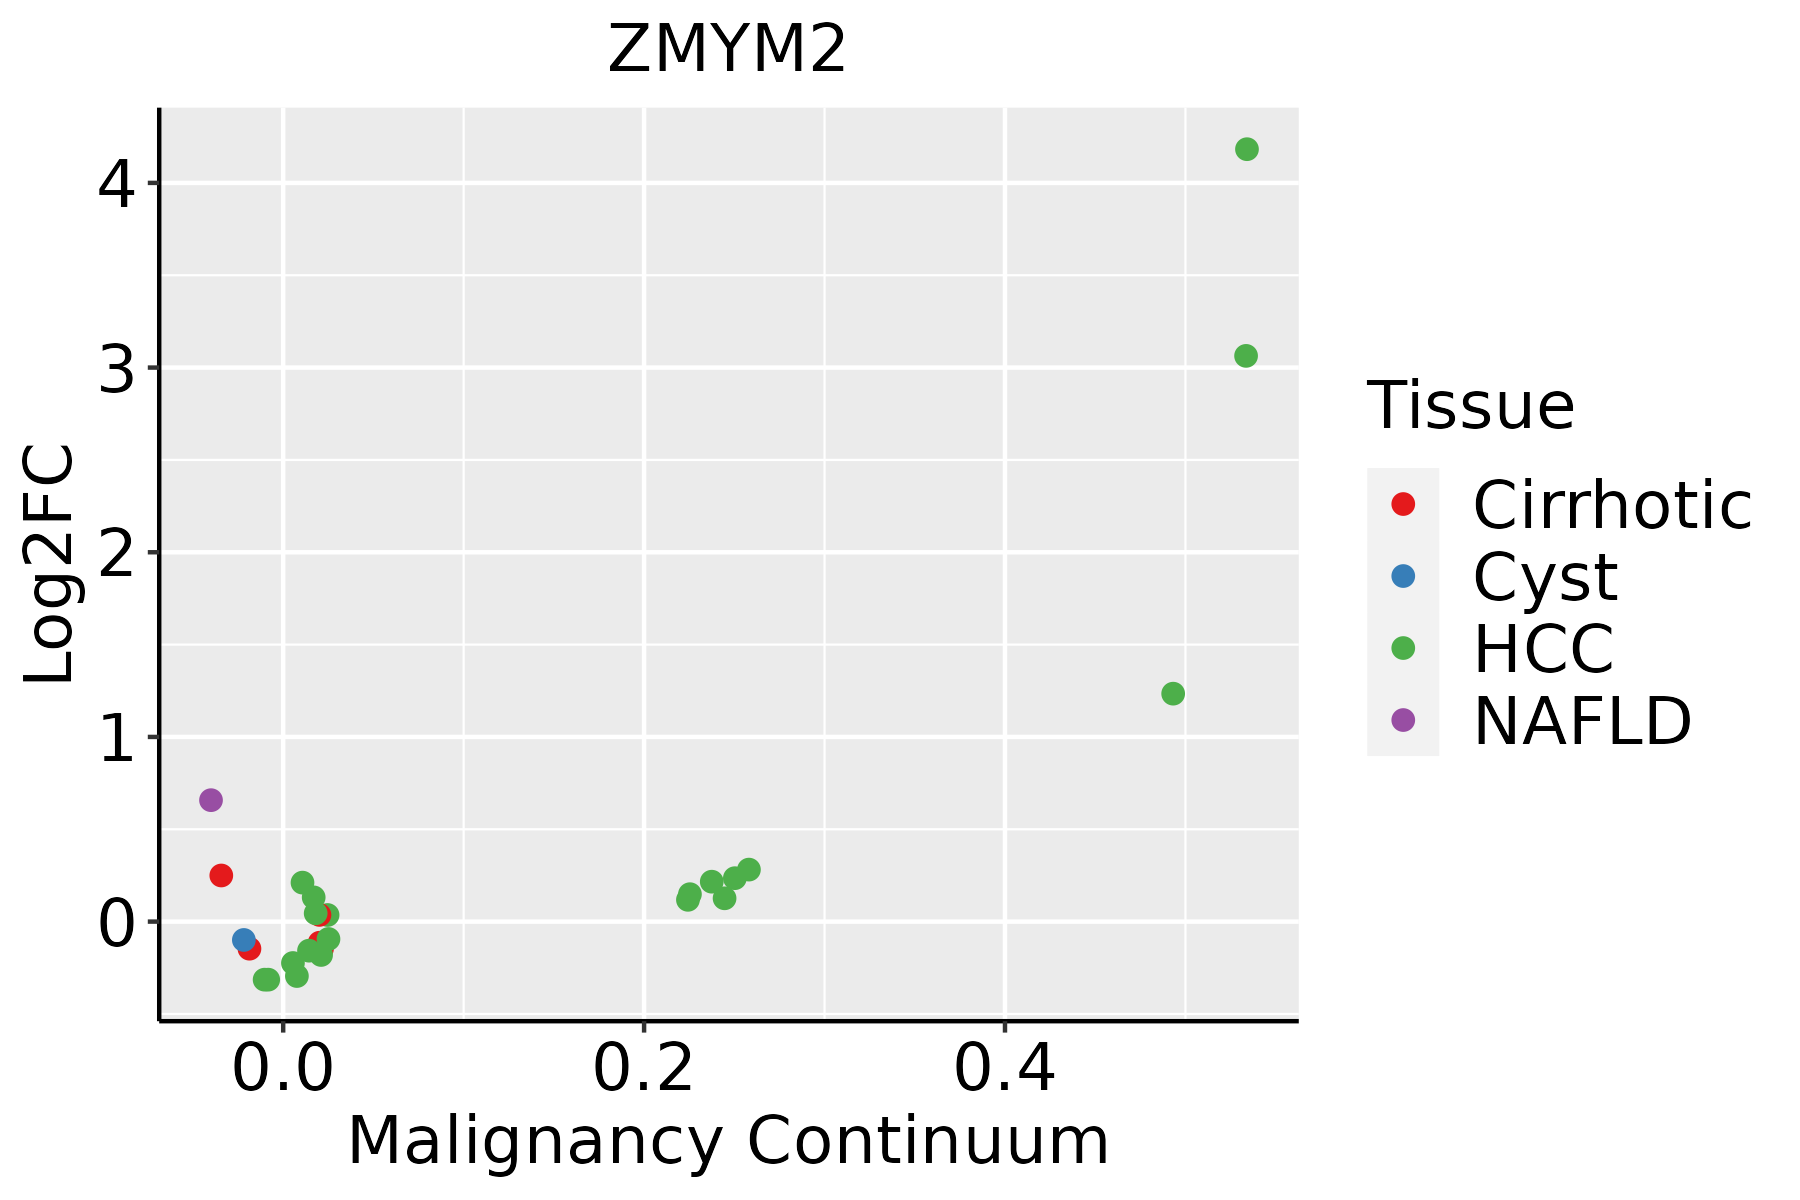 | HCC: Hepatocellular carcinoma |
| NAFLD: Non-alcoholic fatty liver disease | ||
| Lung | 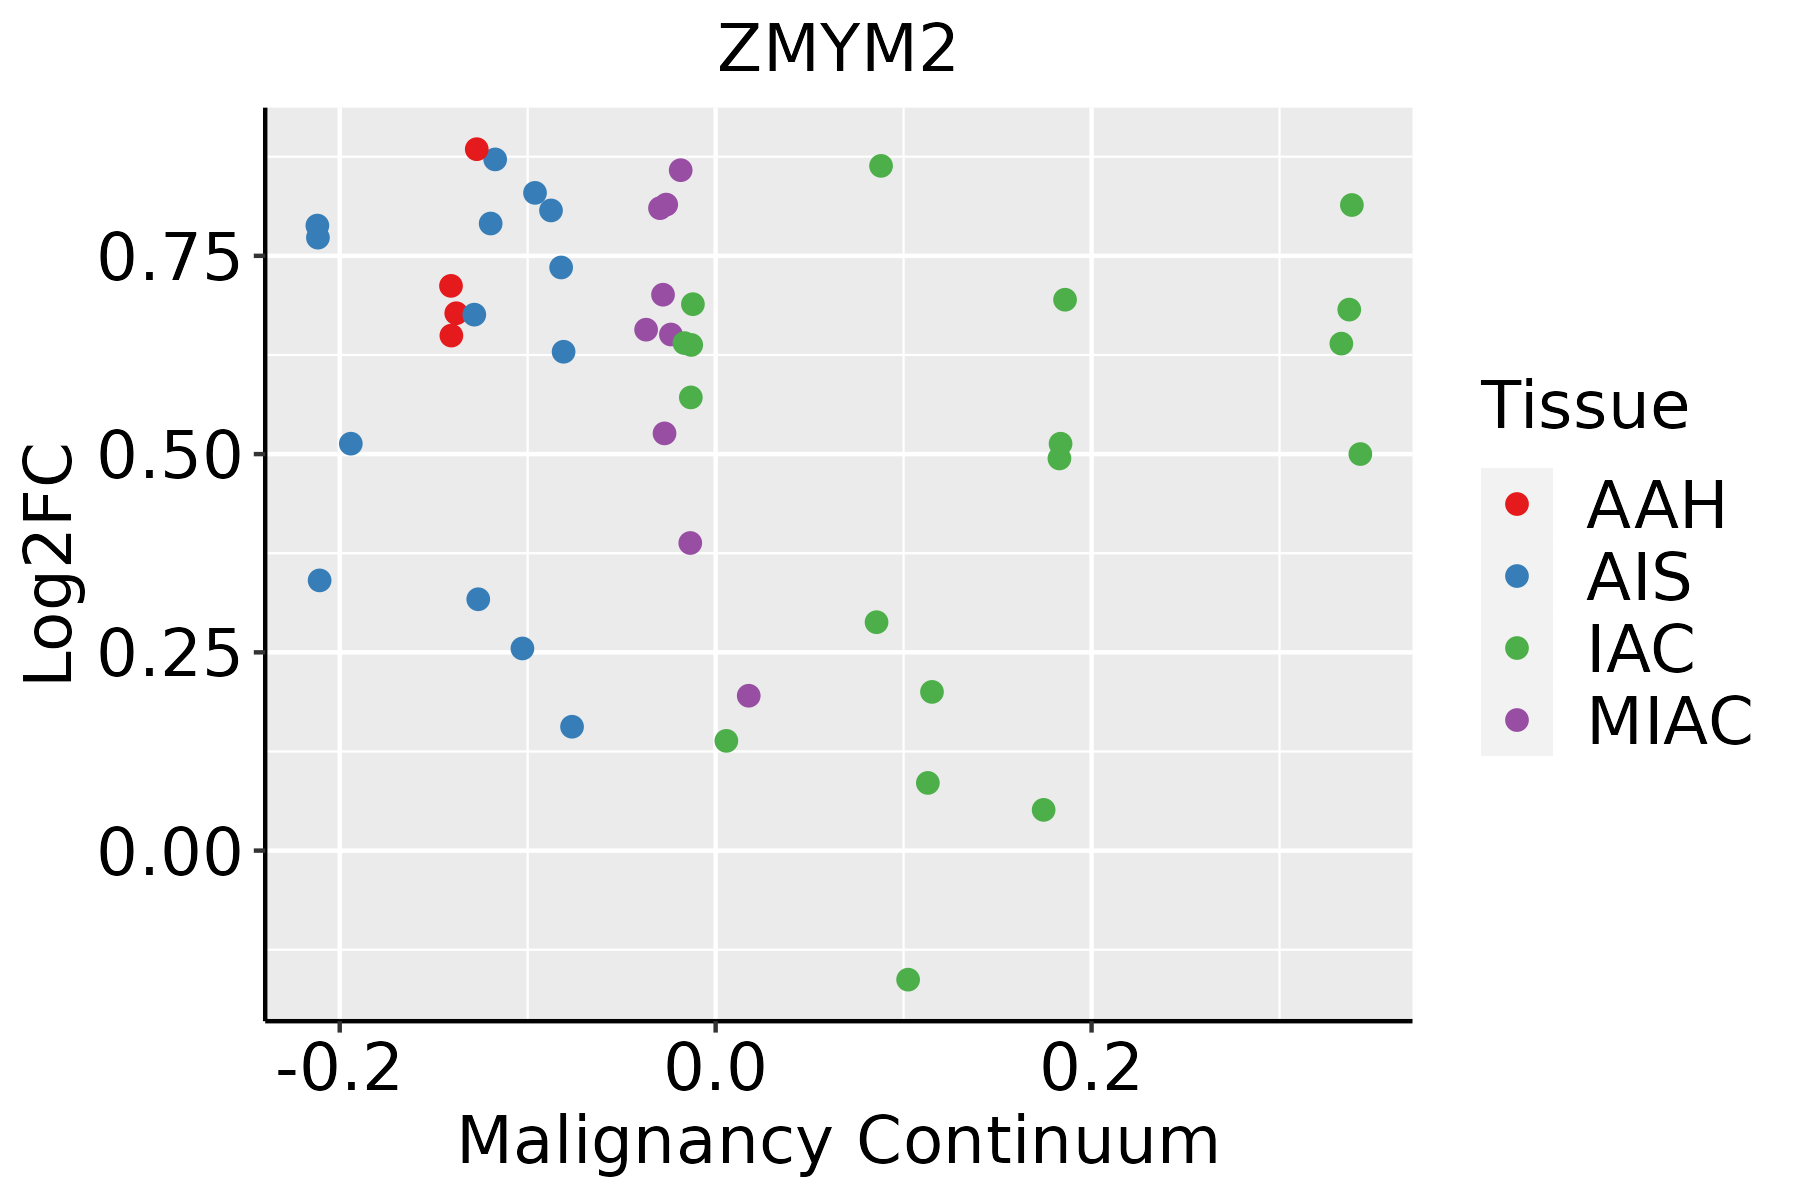 | AAH: Atypical adenomatous hyperplasia |
| AIS: Adenocarcinoma in situ | ||
| IAC: Invasive lung adenocarcinoma | ||
| MIA: Minimally invasive adenocarcinoma | ||
| Oral Cavity |  | EOLP: Erosive Oral lichen planus |
| LP: leukoplakia | ||
| NEOLP: Non-erosive oral lichen planus | ||
| OSCC: Oral squamous cell carcinoma | ||
| Prostate |  | BPH: Benign Prostatic Hyperplasia |
| Thyroid |  | ATC: Anaplastic thyroid cancer |
| HT: Hashimoto's thyroiditis | ||
| PTC: Papillary thyroid cancer |
| ∗log2FC in expression of this searched gene in stem-like cells from each diseased tissue sample relative to stem-like cells in normal samples in each tissue plotted against the malignancy continuum. Samples are colored based on if they are from different disease stage. |
Top |
Malignant transformation related pathway analysis |
| Find out the enriched GO biological processes and KEGG pathways involved in transition from healthy to precancer to cancer |
| Tissue | Disease Stage | Enriched GO biological Processes |
| Colorectum | AD |  |
| Colorectum | SER |  |
| Colorectum | MSS |  |
| Colorectum | MSI-H |  |
| Colorectum | FAP |  |
| ∗Top 15 enriched GO BP terms are showed in the bar plot of each disease state in each tissue. Each row represents a significant GO biological process which is colored according to the -log10(p.adjust). |
| Page: 1 2 3 4 5 6 7 8 9 |
| GO ID | Tissue | Disease Stage | Description | Gene Ratio | Bg Ratio | pvalue | p.adjust | Count |
| Page: 1 |
| Pathway ID | Tissue | Disease Stage | Description | Gene Ratio | Bg Ratio | pvalue | p.adjust | qvalue | Count |
| Page: 1 |
Top |
Cell-cell communication analysis |
| Identification of potential cell-cell interactions between two cell types and their ligand-receptor pairs for different disease states |
| Ligand | Receptor | LRpair | Pathway | Tissue | Disease Stage |
| Page: 1 |
Top |
Single-cell gene regulatory network inference analysis |
| Find out the significant the regulons (TFs) and the target genes of each regulon across cell types for different disease states |
| TF | Cell Type | Tissue | Disease Stage | Target Gene | RSS | Regulon Activity |
| ∗The dot plots of a searched regulon are shown for all cell subpopulations in each disease state of each tissue based on the regulon specific score inferred using pySCENIC and by calculating the average expression. |
| Page: 1 |
Top |
Somatic mutation of malignant transformation related genes |
| Annotation of somatic variants for genes involved in malignant transformation |
| Hugo Symbol | Variant Class | Variant Classification | dbSNP RS | HGVSc | HGVSp | HGVSp Short | SWISSPROT | BIOTYPE | SIFT | PolyPhen | Tumor Sample Barcode | Tissue | Histology | Sex | Age | Stage | Therapy Types | Drugs | Outcome |
| ZMYM2 | SNV | Missense_Mutation | c.190N>A | p.Glu64Lys | p.E64K | Q9UBW7 | protein_coding | deleterious_low_confidence(0.02) | probably_damaging(0.991) | TCGA-AN-A046-01 | Breast | breast invasive carcinoma | Female | >=65 | I/II | Unknown | Unknown | SD | |
| ZMYM2 | SNV | Missense_Mutation | novel | c.1619N>A | p.Arg540Gln | p.R540Q | Q9UBW7 | protein_coding | deleterious(0.01) | benign(0.269) | TCGA-AN-A046-01 | Breast | breast invasive carcinoma | Female | >=65 | I/II | Unknown | Unknown | SD |
| ZMYM2 | SNV | Missense_Mutation | c.2440C>T | p.Pro814Ser | p.P814S | Q9UBW7 | protein_coding | deleterious(0) | probably_damaging(0.994) | TCGA-AN-A0AK-01 | Breast | breast invasive carcinoma | Female | >=65 | I/II | Unknown | Unknown | SD | |
| ZMYM2 | SNV | Missense_Mutation | c.3371N>G | p.His1124Arg | p.H1124R | Q9UBW7 | protein_coding | tolerated(0.53) | benign(0) | TCGA-AN-A0XO-01 | Breast | breast invasive carcinoma | Female | <65 | III/IV | Unknown | Unknown | SD | |
| ZMYM2 | SNV | Missense_Mutation | rs766102273 | c.1379A>G | p.Asn460Ser | p.N460S | Q9UBW7 | protein_coding | deleterious(0) | possibly_damaging(0.702) | TCGA-AO-A128-01 | Breast | breast invasive carcinoma | Female | <65 | I/II | Chemotherapy | doxorubicin | SD |
| ZMYM2 | SNV | Missense_Mutation | c.1814N>T | p.Tyr605Phe | p.Y605F | Q9UBW7 | protein_coding | tolerated(0.26) | possibly_damaging(0.682) | TCGA-D8-A27G-01 | Breast | breast invasive carcinoma | Female | >=65 | I/II | Unknown | Unknown | SD | |
| ZMYM2 | SNV | Missense_Mutation | c.1303N>T | p.Arg435Cys | p.R435C | Q9UBW7 | protein_coding | deleterious(0) | probably_damaging(0.999) | TCGA-D8-A27T-01 | Breast | breast invasive carcinoma | Female | <65 | III/IV | Chemotherapy | doxorubicine+cyclophosphamide | SD | |
| ZMYM2 | SNV | Missense_Mutation | c.1183N>C | p.Glu395Gln | p.E395Q | Q9UBW7 | protein_coding | tolerated(0.23) | probably_damaging(0.978) | TCGA-E2-A1LG-01 | Breast | breast invasive carcinoma | Female | <65 | I/II | Chemotherapy | doxorubicin | SD | |
| ZMYM2 | SNV | Missense_Mutation | c.2353G>A | p.Gly785Arg | p.G785R | Q9UBW7 | protein_coding | deleterious(0) | probably_damaging(0.977) | TCGA-E9-A1RI-01 | Breast | breast invasive carcinoma | Female | <65 | III/IV | Hormone Therapy | tamoxiphen | SD | |
| ZMYM2 | insertion | Nonsense_Mutation | novel | c.4125_4126insTTGTTGAATTAGAAACAAATGTGGTCAATAACTAGTGTTT | p.Thr1376LeufsTer4 | p.T1376Lfs*4 | Q9UBW7 | protein_coding | TCGA-A8-A09M-01 | Breast | breast invasive carcinoma | Female | >=65 | III/IV | Chemotherapy | paclitaxel | CR |
| Page: 1 2 3 4 5 6 7 8 9 10 11 12 13 14 15 16 |
Top |
Related drugs of malignant transformation related genes |
| Identification of chemicals and drugs interact with genes involved in malignant transfromation |
| (DGIdb 4.0) |
| Entrez ID | Symbol | Category | Interaction Types | Drug Claim Name | Drug Name | PMIDs |
| Page: 1 |

Copyright 2023-Present -The University of Texas Health Science Center at Houston |