Schematic overview of the cellular and molecular mechanisms involved in the cancer progression, including the proposed cellular and molecular mechanisms in cancer cells trajectory. AT1: alveolar type 1 cells; AT2: alveolar type 2 cells; AAH: atypical adenomatous hyperplasia; AIS: adenocarcinoma in situ; MIA: minimally invasive adenocarcinoma; IA: invasive adenocarcinoma; EMT: epithelial-mesenchymal transition

Home

Download

Statistics

Help

Contact

Center for Computational Systems Medicine
leaf

Gene summary

leaf

Malignant transformation analysis

leaf

Malignant transformation related pathway analysis

leaf

Cell-cell communication analysis

leaf

Single-cell gene regulatory network inference analysis

leaf

Somatic mutation of malignant transformation related genes

leaf

Related drugs of malignant transformation related genes

Gene: YTHDF1

Gene summary for YTHDF1

check button Gene summary.

Gene informationSpeciesHuman
Gene symbol

YTHDF1

Gene ID

54915

Gene nameYTH N6-methyladenosine RNA binding protein 1
Gene AliasC20orf21
Cytomap20q13.33
Gene Typeprotein-coding
GO ID

GO:0000902

UniProtAcc

Q9BYJ9


Top

Malignant transformation analysis

check button Identification of the aberrant gene expression in precancerous and cancerous lesions by comparing the gene expression of stem-like cells in diseased tissues with normal stem cells
check button Malignant transformation involving gene list.
Entrez IDSymbolReplicatesSpeciesOrganTissueAdj P-valueLog2FCMalignancy
54915YTHDF1S027HumanLiverHCC6.02e-066.38e-010.2446
54915YTHDF1S028HumanLiverHCC1.34e-198.38e-010.2503
54915YTHDF1S029HumanLiverHCC1.68e-126.23e-010.2581
54915YTHDF1C04HumanOral cavityOSCC1.20e-043.38e-010.2633
54915YTHDF1C21HumanOral cavityOSCC6.12e-268.05e-010.2678
54915YTHDF1C30HumanOral cavityOSCC2.35e-341.42e+000.3055
54915YTHDF1C43HumanOral cavityOSCC1.23e-031.73e-010.1704
54915YTHDF1C51HumanOral cavityOSCC1.71e-085.26e-010.2674
54915YTHDF1C57HumanOral cavityOSCC2.19e-052.54e-010.1679
54915YTHDF1C06HumanOral cavityOSCC1.12e-035.69e-010.2699
54915YTHDF1C08HumanOral cavityOSCC2.16e-184.61e-010.1919
54915YTHDF1C09HumanOral cavityOSCC4.97e-063.62e-010.1431
54915YTHDF1LN46HumanOral cavityOSCC1.22e-063.33e-010.1666
54915YTHDF1SYSMH1HumanOral cavityOSCC2.47e-093.56e-010.1127
54915YTHDF1SYSMH2HumanOral cavityOSCC1.39e-113.39e-010.2326
54915YTHDF1SYSMH3HumanOral cavityOSCC3.36e-164.44e-010.2442
54915YTHDF1SYSMH5HumanOral cavityOSCC5.64e-052.00e-010.0647
54915YTHDF1SYSMH6HumanOral cavityOSCC9.38e-041.81e-010.1275
54915YTHDF1P4_S8_cSCCHumanSkincSCC6.44e-031.43e-01-0.3095
54915YTHDF1P5_S10_cSCCHumanSkincSCC3.84e-039.65e-02-0.299
Page: 1 2 3 4 5 

check button Transcriptomic changes along malignancy continuum.
TissueExpression DynamicsAbbreviation
EsophagusThe image shows the transcriptomic changes along malignancy continuum.log2FC in expression of this searched gene in stem-like cells from each diseased tissue sample relative to stem-like cells in normal samples in each tissue plotted against the malignancy continuum. Samples are colored based on if they are from different disease stage.ESCC: Esophageal squamous cell carcinoma
HGIN: High-grade intraepithelial neoplasias
LGIN: Low-grade intraepithelial neoplasias
LiverThe image shows the transcriptomic changes along malignancy continuum.log2FC in expression of this searched gene in stem-like cells from each diseased tissue sample relative to stem-like cells in normal samples in each tissue plotted against the malignancy continuum. Samples are colored based on if they are from different disease stage.HCC: Hepatocellular carcinoma
NAFLD: Non-alcoholic fatty liver disease
Oral CavityThe image shows the transcriptomic changes along malignancy continuum.log2FC in expression of this searched gene in stem-like cells from each diseased tissue sample relative to stem-like cells in normal samples in each tissue plotted against the malignancy continuum. Samples are colored based on if they are from different disease stage.
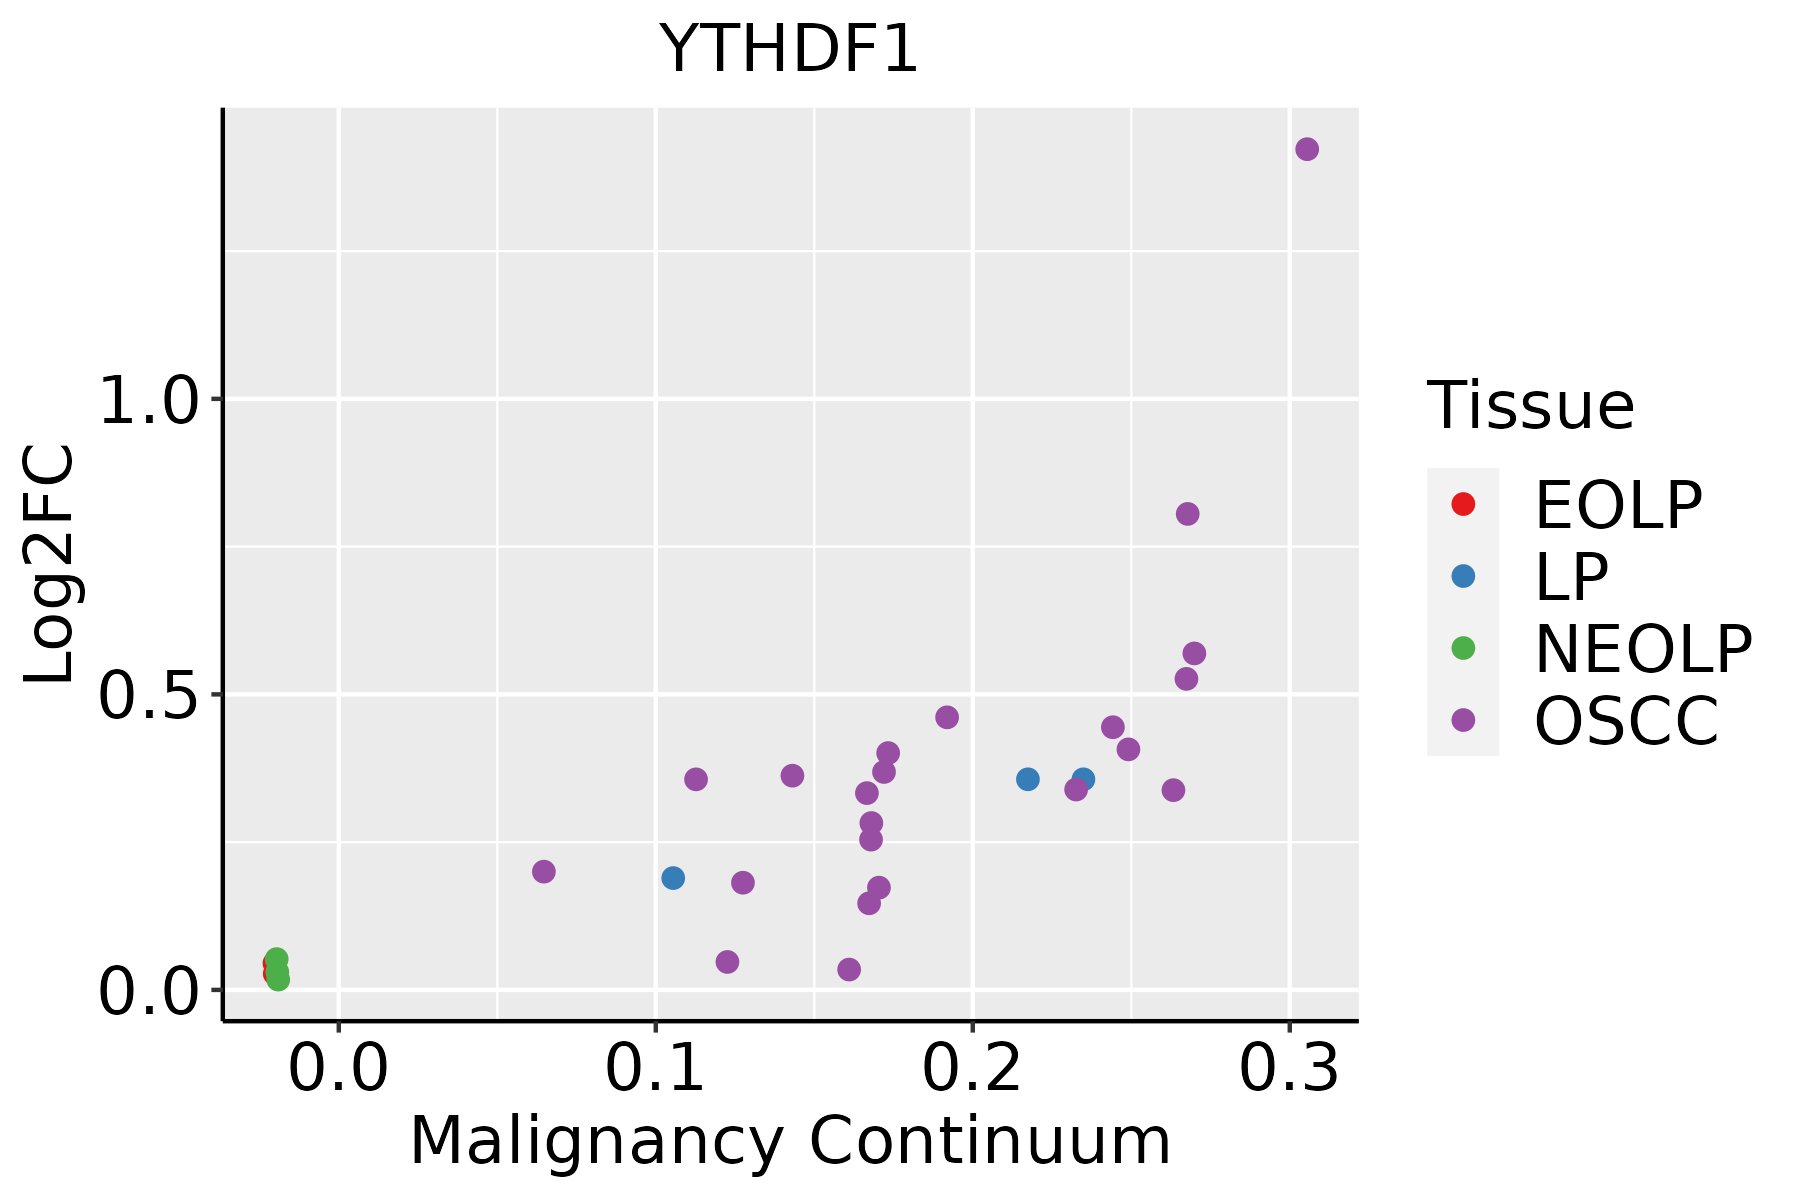
EOLP: Erosive Oral lichen planus
LP: leukoplakia
NEOLP: Non-erosive oral lichen planus
OSCC: Oral squamous cell carcinoma
SkinThe image shows the transcriptomic changes along malignancy continuum.log2FC in expression of this searched gene in stem-like cells from each diseased tissue sample relative to stem-like cells in normal samples in each tissue plotted against the malignancy continuum. Samples are colored based on if they are from different disease stage.AK: Actinic keratosis
cSCC: Cutaneous squamous cell carcinoma
SCCIS:squamous cell carcinoma in situ
∗log2FC in expression of this searched gene in stem-like cells from each diseased tissue sample relative to stem-like cells in normal samples in each tissue plotted against the malignancy continuum. Samples are colored based on if they are from different disease stage.

Top

Malignant transformation related pathway analysis

check buttonFind out the enriched GO biological processes and KEGG pathways involved in transition from healthy to precancer to cancer
check button Figure of enriched GO biological processes.
TissueDisease StageEnriched GO biological Processes
ColorectumADGO analysis - Figure of enriched GO biological processes: Top 15 enriched GO BP terms are showed in the bar plot of each disease state in each tissue. Each row represents a significant GO biological process which is colored according to the -log10(p.adjust).
ColorectumSERGO analysis - Figure of enriched GO biological processes: Top 15 enriched GO BP terms are showed in the bar plot of each disease state in each tissue. Each row represents a significant GO biological process which is colored according to the -log10(p.adjust).
ColorectumMSSGO analysis - Figure of enriched GO biological processes: Top 15 enriched GO BP terms are showed in the bar plot of each disease state in each tissue. Each row represents a significant GO biological process which is colored according to the -log10(p.adjust).
ColorectumMSI-HGO analysis - Figure of enriched GO biological processes: Top 15 enriched GO BP terms are showed in the bar plot of each disease state in each tissue. Each row represents a significant GO biological process which is colored according to the -log10(p.adjust).
ColorectumFAPGO analysis - Figure of enriched GO biological processes: Top 15 enriched GO BP terms are showed in the bar plot of each disease state in each tissue. Each row represents a significant GO biological process which is colored according to the -log10(p.adjust).
∗Top 15 enriched GO BP terms are showed in the bar plot of each disease state in each tissue. Each row represents a significant GO biological process which is colored according to the -log10(p.adjust).
Page: 1 2 3 4 5 6 7 8 9 

check button Enriched GO biological processes.
GO IDTissueDisease StageDescriptionGene RatioBg Ratiopvaluep.adjustCount
GO:0009896111EsophagusESCCpositive regulation of catabolic process332/8552492/187234.36e-239.22e-21332
GO:0031331111EsophagusESCCpositive regulation of cellular catabolic process292/8552427/187238.67e-221.53e-19292
GO:1903311110EsophagusESCCregulation of mRNA metabolic process210/8552288/187233.25e-215.56e-19210
GO:0006401110EsophagusESCCRNA catabolic process204/8552278/187233.39e-215.66e-19204
GO:0006413110EsophagusESCCtranslational initiation100/8552118/187231.16e-181.25e-16100
GO:0034655110EsophagusESCCnucleobase-containing compound catabolic process272/8552407/187232.92e-182.90e-16272
GO:0006402110EsophagusESCCmRNA catabolic process170/8552232/187238.70e-188.00e-16170
GO:0006417111EsophagusESCCregulation of translation304/8552468/187231.53e-171.33e-15304
GO:004670018EsophagusESCCheterocycle catabolic process286/8552445/187231.12e-157.47e-14286
GO:0045727111EsophagusESCCpositive regulation of translation107/8552136/187232.79e-151.68e-13107
GO:004427019EsophagusESCCcellular nitrogen compound catabolic process288/8552451/187233.03e-151.79e-13288
GO:0034250111EsophagusESCCpositive regulation of cellular amide metabolic process123/8552162/187233.32e-151.93e-13123
GO:001943918EsophagusESCCaromatic compound catabolic process295/8552467/187231.09e-145.98e-13295
GO:190136118EsophagusESCCorganic cyclic compound catabolic process307/8552495/187239.99e-144.80e-12307
GO:000644617EsophagusESCCregulation of translational initiation65/855279/187232.04e-117.07e-1065
GO:190331316EsophagusESCCpositive regulation of mRNA metabolic process87/8552118/187235.10e-101.32e-0887
GO:006101319EsophagusESCCregulation of mRNA catabolic process115/8552166/187235.90e-101.49e-08115
GO:004348719EsophagusESCCregulation of RNA stability117/8552170/187237.91e-101.94e-08117
GO:004348819EsophagusESCCregulation of mRNA stability109/8552158/187232.40e-095.35e-08109
GO:006101416EsophagusESCCpositive regulation of mRNA catabolic process63/855287/187233.70e-075.15e-0663
Page: 1 2 3 4 5 6 

check button Enriched KEGG pathways.
Pathway IDTissueDisease StageDescriptionGene RatioBg Ratiopvaluep.adjustqvalueCount
Page: 1 

Top

Cell-cell communication analysis

check buttonIdentification of potential cell-cell interactions between two cell types and their ligand-receptor pairs for different disease states
LigandReceptorLRpairPathwayTissueDisease Stage
Page: 1 

Top

Single-cell gene regulatory network inference analysis

check buttonFind out the significant the regulons (TFs) and the target genes of each regulon across cell types for different disease states
TFCell TypeTissueDisease StageTarget GeneRSSRegulon Activity
∗The dot plots of a searched regulon are shown for all cell subpopulations in each disease state of each tissue based on the regulon specific score inferred using pySCENIC and by calculating the average expression.
Page: 1 

Top

Somatic mutation of malignant transformation related genes

check buttonAnnotation of somatic variants for genes involved in malignant transformation
Hugo SymbolVariant ClassVariant ClassificationdbSNP RSHGVScHGVSpHGVSp ShortSWISSPROTBIOTYPESIFTPolyPhenTumor Sample BarcodeTissueHistologySexAgeStageTherapy TypesDrugsOutcome
YTHDF1SNVMissense_Mutationc.75G>Cp.Gln25Hisp.Q25HQ9BYJ9protein_codingdeleterious(0.03)probably_damaging(0.94)TCGA-AC-A23H-01Breastbreast invasive carcinomaFemale>=65I/IIUnknownUnknownPD
YTHDF1SNVMissense_Mutationnovelc.1399N>Ap.Gln467Lysp.Q467KQ9BYJ9protein_codingdeleterious(0)probably_damaging(0.994)TCGA-AN-A0FN-01Breastbreast invasive carcinomaFemale<65I/IIUnknownUnknownSD
YTHDF1SNVMissense_Mutationc.385N>Cp.Phe129Leup.F129LQ9BYJ9protein_codingdeleterious(0)possibly_damaging(0.828)TCGA-BH-A18G-01Breastbreast invasive carcinomaFemale>=65I/IIUnknownUnknownSD
YTHDF1SNVMissense_Mutationc.737C>Ap.Pro246Hisp.P246HQ9BYJ9protein_codingdeleterious(0.04)possibly_damaging(0.873)TCGA-D8-A1XT-01Breastbreast invasive carcinomaFemale<65I/IIChemotherapyadriamycin+cyclophosphamideSD
YTHDF1SNVMissense_Mutationc.1351N>Ap.Glu451Lysp.E451KQ9BYJ9protein_codingdeleterious(0)probably_damaging(0.984)TCGA-D8-A27G-01Breastbreast invasive carcinomaFemale>=65I/IIUnknownUnknownSD
YTHDF1SNVMissense_Mutationnovelc.431N>Ap.Ser144Asnp.S144NQ9BYJ9protein_codingtolerated(0.13)benign(0.011)TCGA-D8-A3Z6-01Breastbreast invasive carcinomaFemale<65III/IVChemotherapycyclophosphaneSD
YTHDF1insertionFrame_Shift_Insnovelc.486_487insCCGAAGGp.Val163ProfsTer4p.V163Pfs*4Q9BYJ9protein_codingTCGA-A7-A0CJ-01Breastbreast invasive carcinomaFemale<65I/IIChemotherapycytoxanSD
YTHDF1insertionIn_Frame_Insnovelc.484_485insACATTGGCACCTGGGATAACAAGGGGCCTGp.Thr161_Val162insAspIleGlyThrTrpAspAsnLysGlyProp.T161_V162insDIGTWDNKGPQ9BYJ9protein_codingTCGA-A7-A0CJ-01Breastbreast invasive carcinomaFemale<65I/IIChemotherapycytoxanSD
YTHDF1insertionIn_Frame_Insnovelc.1408_1409insCCTGGGTTGATACATTTTTTGGTTTTAp.Trp470delinsSerTrpValAspThrPhePheGlyPheArgp.W470delinsSWVDTFFGFRQ9BYJ9protein_codingTCGA-A8-A09D-01Breastbreast invasive carcinomaFemale<65I/IIChemotherapydoxorubicinCR
YTHDF1insertionFrame_Shift_Insnovelc.1400_1401insCTTTCTCCTCTCCTTTTTGAATTGTGATACTTTCTGGAACp.Gln467HisfsTer22p.Q467Hfs*22Q9BYJ9protein_codingTCGA-AN-A0FN-01Breastbreast invasive carcinomaFemale<65I/IIUnknownUnknownSD
Page: 1 2 3 4 5 6 7 8 9 

Top

Related drugs of malignant transformation related genes

check buttonIdentification of chemicals and drugs interact with genes involved in malignant transfromation
(DGIdb 4.0)
Entrez IDSymbolCategoryInteraction TypesDrug Claim NameDrug NamePMIDs
Page: 1