
|
|||||
|
 | |
| |
| |
| |
| |
| |
|
Gene: YPEL3 |
Gene summary for YPEL3 |
| Gene information | Species | Human | Gene symbol | YPEL3 | Gene ID | 83719 |
| Gene name | yippee like 3 | |
| Gene Alias | YPEL3 | |
| Cytomap | 16p11.2 | |
| Gene Type | protein-coding | GO ID | GO:0006950 | UniProtAcc | A0A024R624 |
Top |
Malignant transformation analysis |
| Identification of the aberrant gene expression in precancerous and cancerous lesions by comparing the gene expression of stem-like cells in diseased tissues with normal stem cells |
| Entrez ID | Symbol | Replicates | Species | Organ | Tissue | Adj P-value | Log2FC | Malignancy |
| 83719 | YPEL3 | P20T-E | Human | Esophagus | ESCC | 4.95e-12 | 3.32e-01 | 0.1124 |
| 83719 | YPEL3 | P21T-E | Human | Esophagus | ESCC | 1.81e-19 | 2.45e-01 | 0.1617 |
| 83719 | YPEL3 | P22T-E | Human | Esophagus | ESCC | 6.88e-26 | 3.53e-01 | 0.1236 |
| 83719 | YPEL3 | P23T-E | Human | Esophagus | ESCC | 1.29e-25 | 7.24e-01 | 0.108 |
| 83719 | YPEL3 | P24T-E | Human | Esophagus | ESCC | 2.59e-14 | 2.29e-01 | 0.1287 |
| 83719 | YPEL3 | P26T-E | Human | Esophagus | ESCC | 9.63e-14 | 3.68e-01 | 0.1276 |
| 83719 | YPEL3 | P27T-E | Human | Esophagus | ESCC | 1.52e-16 | 2.22e-01 | 0.1055 |
| 83719 | YPEL3 | P28T-E | Human | Esophagus | ESCC | 1.08e-29 | 6.89e-01 | 0.1149 |
| 83719 | YPEL3 | P30T-E | Human | Esophagus | ESCC | 5.35e-14 | 5.57e-01 | 0.137 |
| 83719 | YPEL3 | P31T-E | Human | Esophagus | ESCC | 1.49e-14 | 3.06e-01 | 0.1251 |
| 83719 | YPEL3 | P32T-E | Human | Esophagus | ESCC | 9.76e-06 | 1.21e-01 | 0.1666 |
| 83719 | YPEL3 | P36T-E | Human | Esophagus | ESCC | 3.78e-07 | 1.41e-01 | 0.1187 |
| 83719 | YPEL3 | P37T-E | Human | Esophagus | ESCC | 1.74e-10 | 2.39e-01 | 0.1371 |
| 83719 | YPEL3 | P38T-E | Human | Esophagus | ESCC | 1.30e-09 | 2.20e-01 | 0.127 |
| 83719 | YPEL3 | P39T-E | Human | Esophagus | ESCC | 2.41e-30 | 7.94e-01 | 0.0894 |
| 83719 | YPEL3 | P40T-E | Human | Esophagus | ESCC | 3.69e-17 | 5.51e-01 | 0.109 |
| 83719 | YPEL3 | P42T-E | Human | Esophagus | ESCC | 6.77e-09 | 1.76e-01 | 0.1175 |
| 83719 | YPEL3 | P44T-E | Human | Esophagus | ESCC | 4.11e-15 | 1.76e-01 | 0.1096 |
| 83719 | YPEL3 | P47T-E | Human | Esophagus | ESCC | 1.15e-05 | 2.15e-01 | 0.1067 |
| 83719 | YPEL3 | P48T-E | Human | Esophagus | ESCC | 4.70e-13 | 2.48e-01 | 0.0959 |
| Page: 1 2 3 4 5 6 7 8 |
| Tissue | Expression Dynamics | Abbreviation |
| Breast |  | IDC: Invasive ductal carcinoma |
| DCIS: Ductal carcinoma in situ | ||
| Precancer(BRCA1-mut): Precancerous lesion from BRCA1 mutation carriers | ||
| Colorectum (GSE201348) |  | FAP: Familial adenomatous polyposis |
| CRC: Colorectal cancer | ||
| Colorectum (HTA11) |  | AD: Adenomas |
| SER: Sessile serrated lesions | ||
| MSI-H: Microsatellite-high colorectal cancer | ||
| MSS: Microsatellite stable colorectal cancer | ||
| Esophagus | 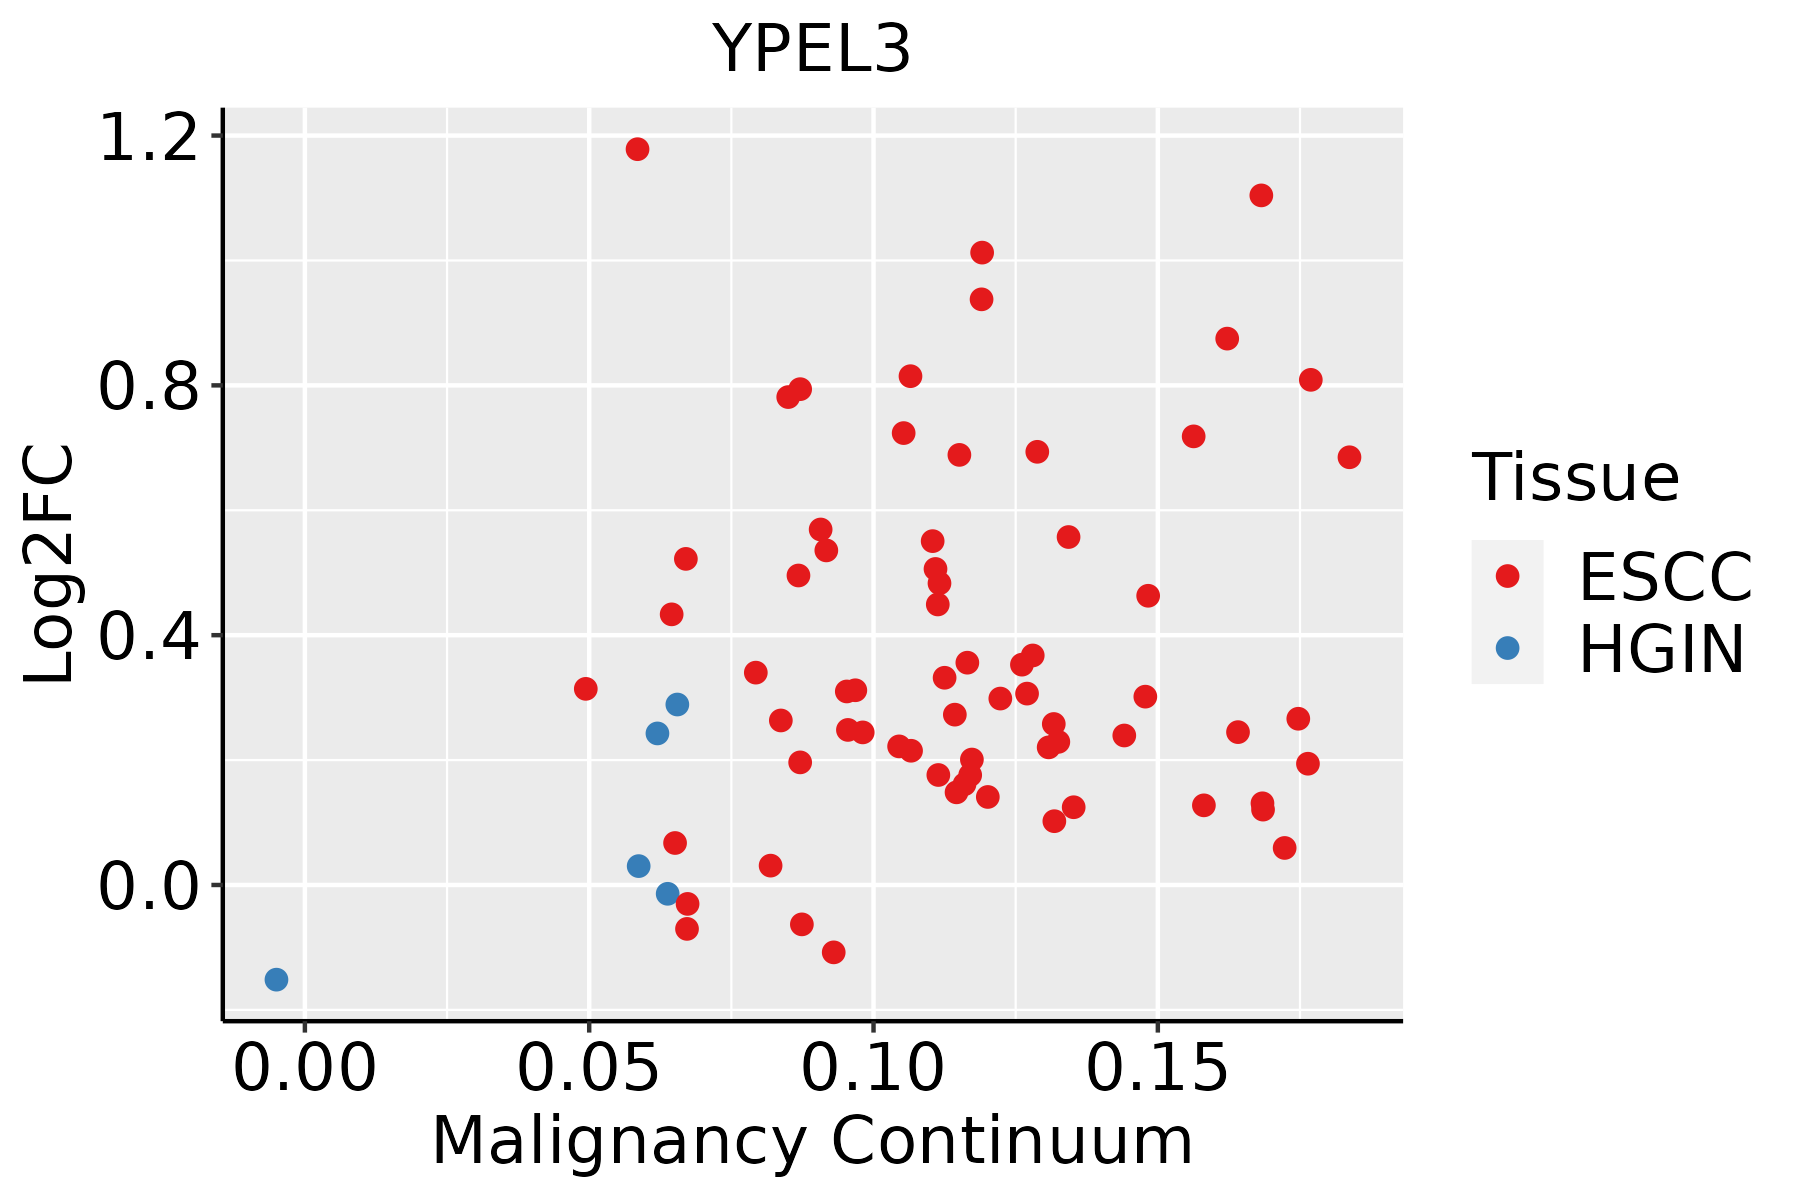 | ESCC: Esophageal squamous cell carcinoma |
| HGIN: High-grade intraepithelial neoplasias | ||
| LGIN: Low-grade intraepithelial neoplasias | ||
| Liver |  | HCC: Hepatocellular carcinoma |
| NAFLD: Non-alcoholic fatty liver disease | ||
| Oral Cavity | 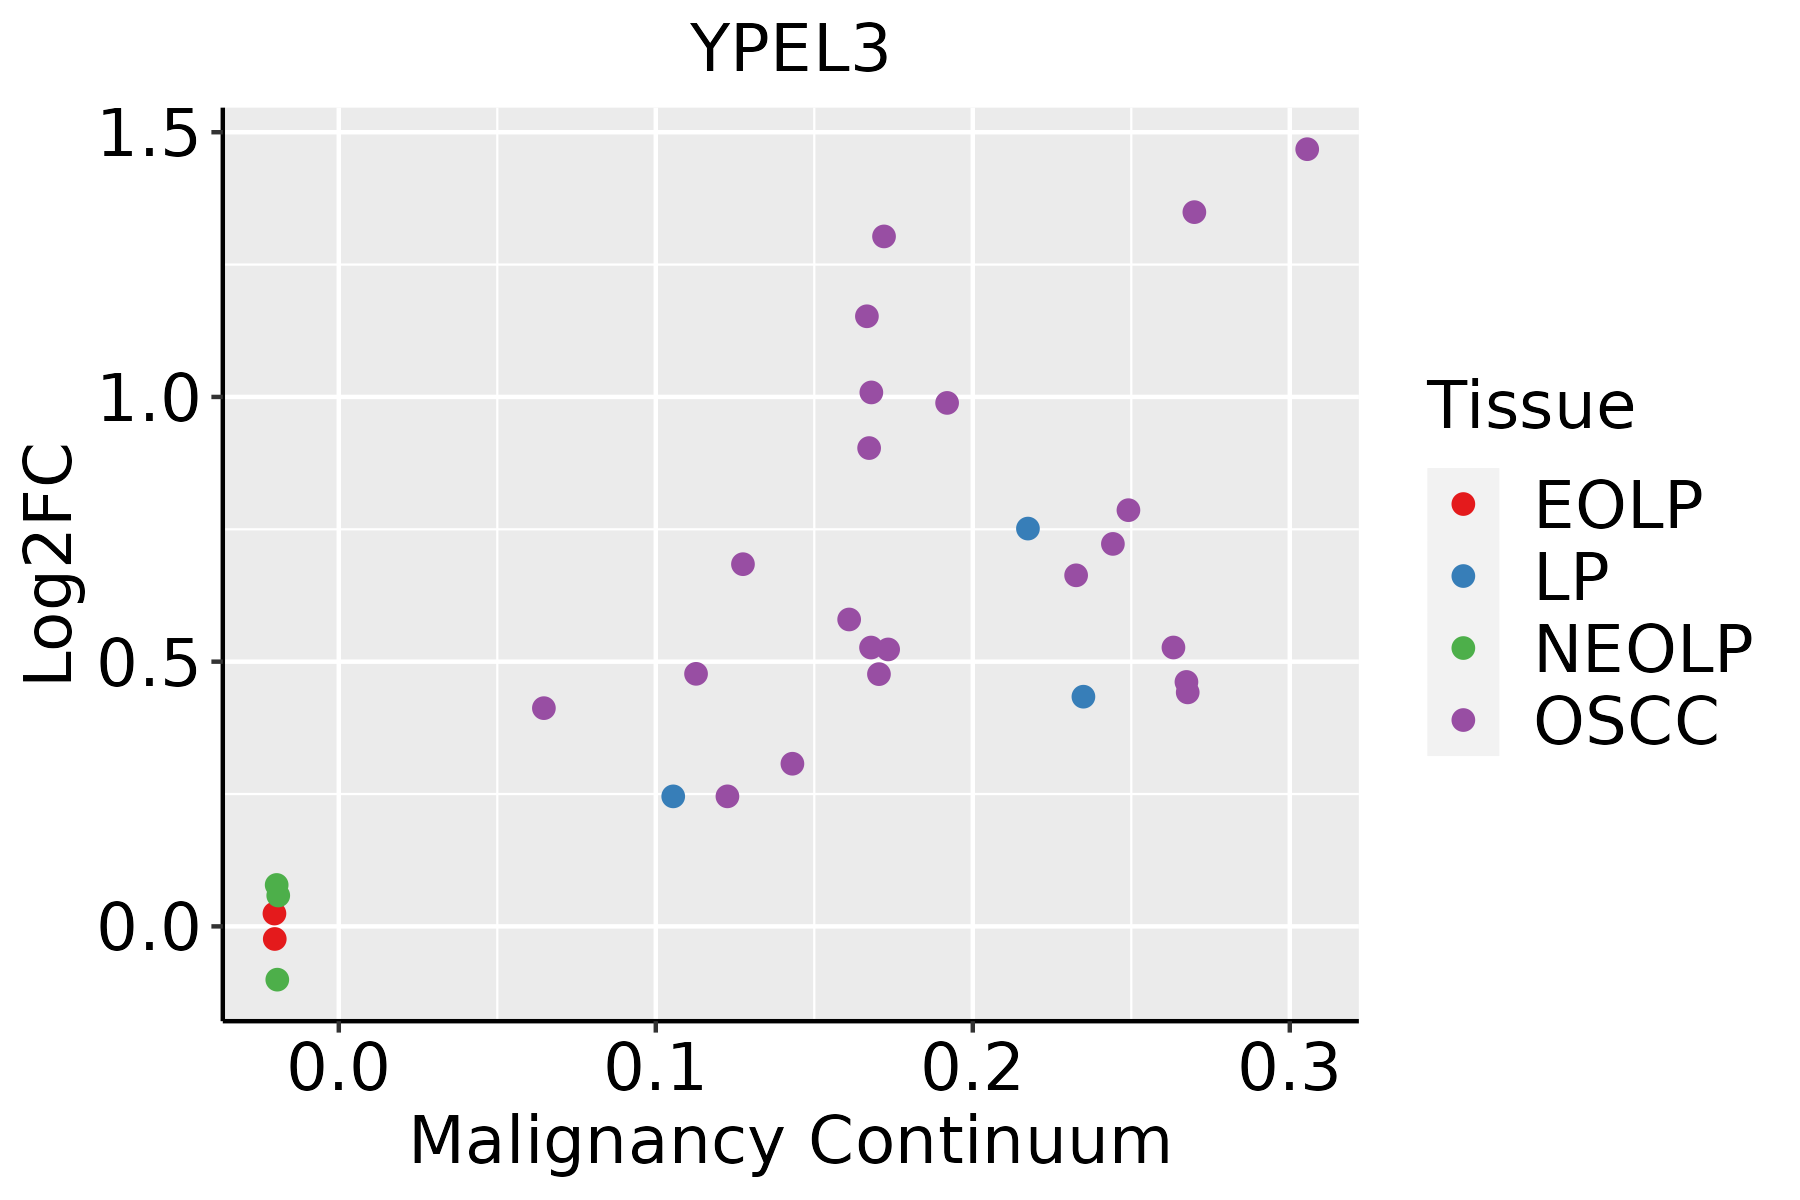 | EOLP: Erosive Oral lichen planus |
| LP: leukoplakia | ||
| NEOLP: Non-erosive oral lichen planus | ||
| OSCC: Oral squamous cell carcinoma | ||
| Skin |  | AK: Actinic keratosis |
| cSCC: Cutaneous squamous cell carcinoma | ||
| SCCIS:squamous cell carcinoma in situ | ||
| Thyroid | 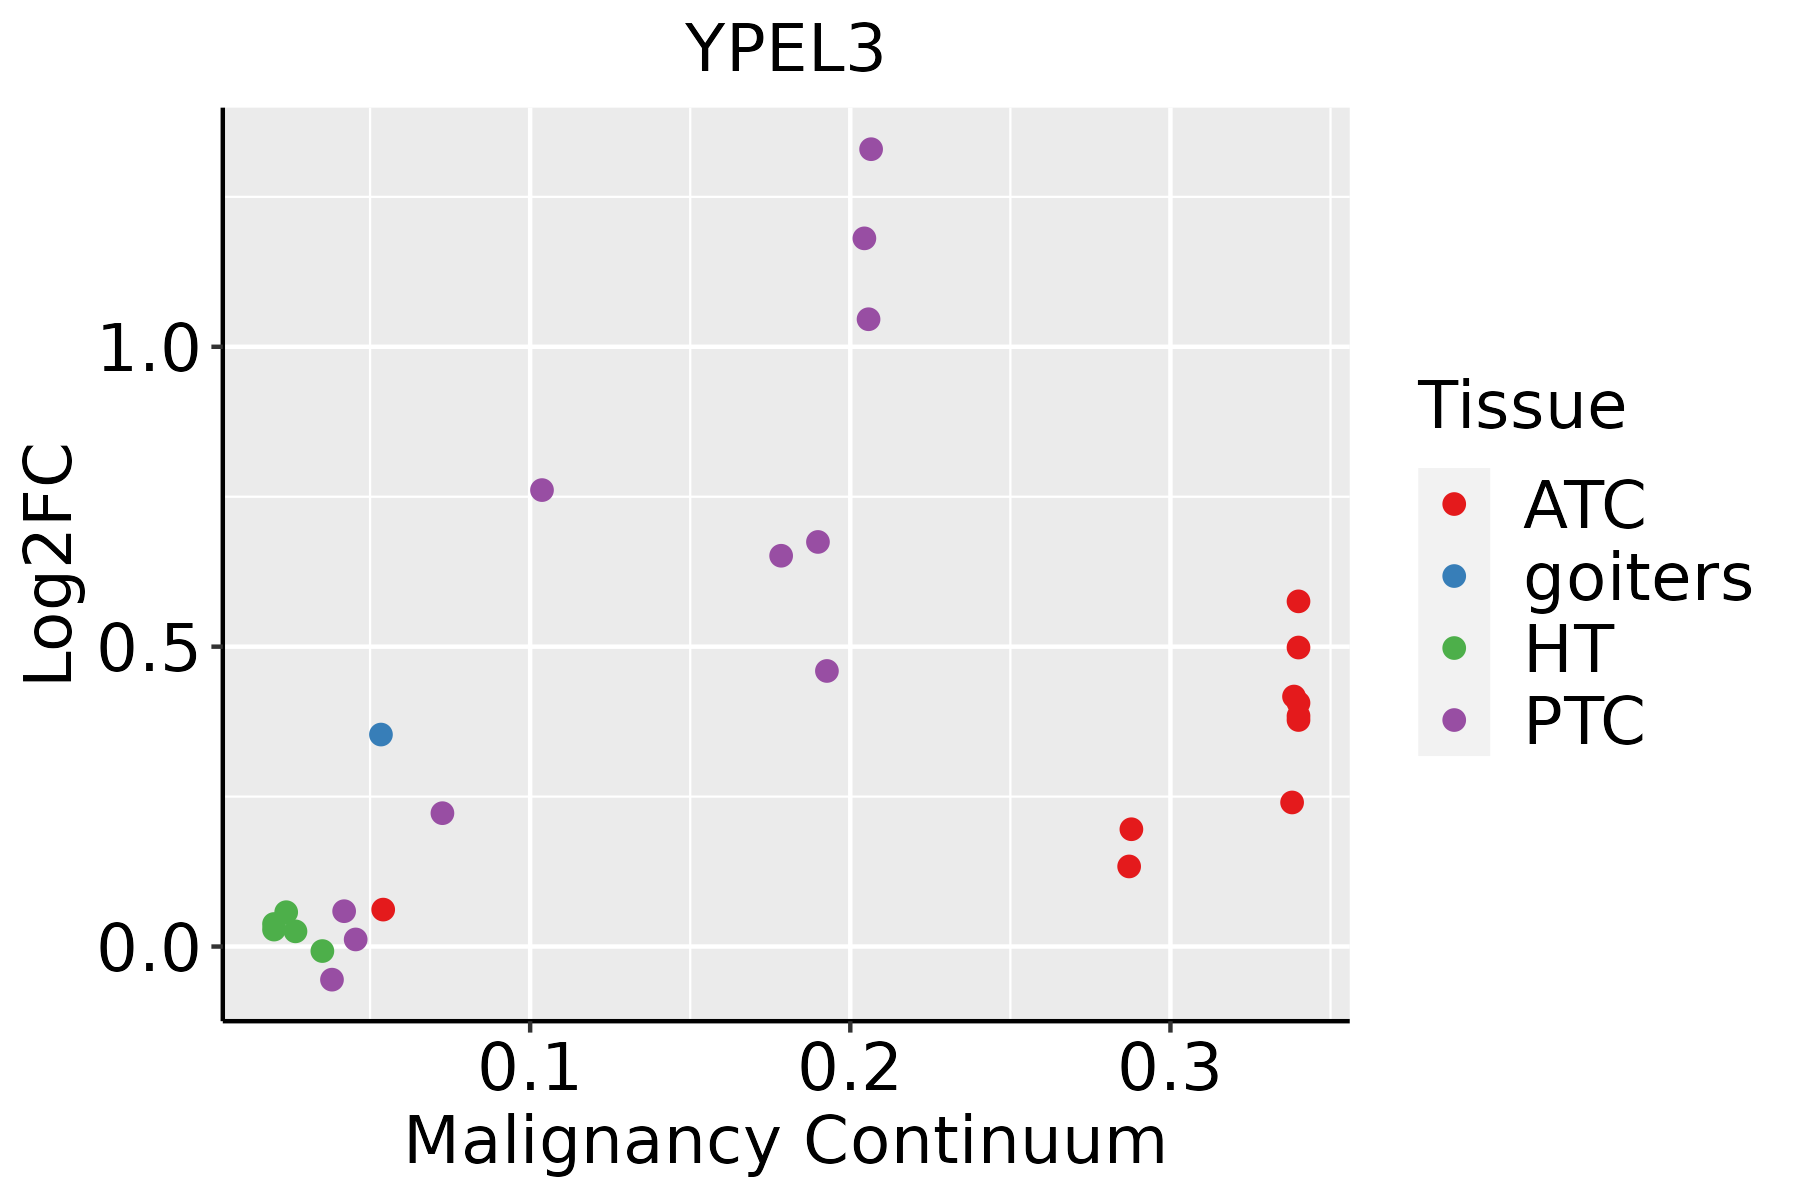 | ATC: Anaplastic thyroid cancer |
| HT: Hashimoto's thyroiditis | ||
| PTC: Papillary thyroid cancer |
| ∗log2FC in expression of this searched gene in stem-like cells from each diseased tissue sample relative to stem-like cells in normal samples in each tissue plotted against the malignancy continuum. Samples are colored based on if they are from different disease stage. |
Top |
Malignant transformation related pathway analysis |
| Find out the enriched GO biological processes and KEGG pathways involved in transition from healthy to precancer to cancer |
| Tissue | Disease Stage | Enriched GO biological Processes |
| Colorectum | AD |  |
| Colorectum | SER |  |
| Colorectum | MSS |  |
| Colorectum | MSI-H |  |
| Colorectum | FAP |  |
| ∗Top 15 enriched GO BP terms are showed in the bar plot of each disease state in each tissue. Each row represents a significant GO biological process which is colored according to the -log10(p.adjust). |
| Page: 1 2 3 4 5 6 7 8 9 |
| GO ID | Tissue | Disease Stage | Description | Gene Ratio | Bg Ratio | pvalue | p.adjust | Count |
| GO:00075688 | Breast | Precancer | aging | 41/1080 | 339/18723 | 5.95e-06 | 1.71e-04 | 41 |
| GO:00075694 | Breast | Precancer | cell aging | 17/1080 | 132/18723 | 1.55e-03 | 1.59e-02 | 17 |
| GO:00903423 | Breast | Precancer | regulation of cell aging | 10/1080 | 61/18723 | 2.40e-03 | 2.21e-02 | 10 |
| GO:000756813 | Breast | IDC | aging | 52/1434 | 339/18723 | 1.14e-06 | 5.10e-05 | 52 |
| GO:000756912 | Breast | IDC | cell aging | 19/1434 | 132/18723 | 5.63e-03 | 4.08e-02 | 19 |
| GO:00903421 | Breast | IDC | regulation of cell aging | 11/1434 | 61/18723 | 6.10e-03 | 4.36e-02 | 11 |
| GO:000756823 | Breast | DCIS | aging | 50/1390 | 339/18723 | 2.38e-06 | 8.46e-05 | 50 |
| GO:000756921 | Breast | DCIS | cell aging | 19/1390 | 132/18723 | 4.03e-03 | 3.20e-02 | 19 |
| GO:00903422 | Breast | DCIS | regulation of cell aging | 11/1390 | 61/18723 | 4.84e-03 | 3.67e-02 | 11 |
| GO:0007568 | Colorectum | AD | aging | 98/3918 | 339/18723 | 2.77e-04 | 3.39e-03 | 98 |
| GO:00075681 | Colorectum | MSS | aging | 90/3467 | 339/18723 | 1.51e-04 | 2.19e-03 | 90 |
| GO:000756820 | Esophagus | ESCC | aging | 201/8552 | 339/18723 | 2.64e-07 | 3.94e-06 | 201 |
| GO:00075699 | Esophagus | ESCC | cell aging | 81/8552 | 132/18723 | 2.00e-04 | 1.27e-03 | 81 |
| GO:00903984 | Esophagus | ESCC | cellular senescence | 54/8552 | 93/18723 | 1.08e-02 | 3.67e-02 | 54 |
| GO:000756812 | Liver | Cirrhotic | aging | 117/4634 | 339/18723 | 3.13e-05 | 3.91e-04 | 117 |
| GO:000756822 | Liver | HCC | aging | 185/7958 | 339/18723 | 4.28e-06 | 5.50e-05 | 185 |
| GO:00075691 | Liver | HCC | cell aging | 73/7958 | 132/18723 | 2.00e-03 | 1.01e-02 | 73 |
| GO:000756818 | Oral cavity | OSCC | aging | 194/7305 | 339/18723 | 6.18e-12 | 2.33e-10 | 194 |
| GO:00075698 | Oral cavity | OSCC | cell aging | 73/7305 | 132/18723 | 1.05e-04 | 7.75e-04 | 73 |
| GO:00903983 | Oral cavity | OSCC | cellular senescence | 48/7305 | 93/18723 | 9.03e-03 | 3.26e-02 | 48 |
| Page: 1 2 |
| Pathway ID | Tissue | Disease Stage | Description | Gene Ratio | Bg Ratio | pvalue | p.adjust | qvalue | Count |
| Page: 1 |
Top |
Cell-cell communication analysis |
| Identification of potential cell-cell interactions between two cell types and their ligand-receptor pairs for different disease states |
| Ligand | Receptor | LRpair | Pathway | Tissue | Disease Stage |
| Page: 1 |
Top |
Single-cell gene regulatory network inference analysis |
| Find out the significant the regulons (TFs) and the target genes of each regulon across cell types for different disease states |
| TF | Cell Type | Tissue | Disease Stage | Target Gene | RSS | Regulon Activity |
| ∗The dot plots of a searched regulon are shown for all cell subpopulations in each disease state of each tissue based on the regulon specific score inferred using pySCENIC and by calculating the average expression. |
| Page: 1 |
Top |
Somatic mutation of malignant transformation related genes |
| Annotation of somatic variants for genes involved in malignant transformation |
| Hugo Symbol | Variant Class | Variant Classification | dbSNP RS | HGVSc | HGVSp | HGVSp Short | SWISSPROT | BIOTYPE | SIFT | PolyPhen | Tumor Sample Barcode | Tissue | Histology | Sex | Age | Stage | Therapy Types | Drugs | Outcome |
| YPEL3 | SNV | Missense_Mutation | novel | c.345C>G | p.Ile115Met | p.I115M | P61236 | protein_coding | deleterious(0) | probably_damaging(0.921) | TCGA-ZJ-AAXB-01 | Cervix | cervical & endocervical cancer | Female | <65 | I/II | Unknown | Unknown | SD |
| YPEL3 | deletion | Frame_Shift_Del | c.104delN | p.Pro35ArgfsTer59 | p.P35Rfs*59 | P61236 | protein_coding | TCGA-AD-6889-01 | Colorectum | colon adenocarcinoma | Male | >=65 | I/II | Chemotherapy | xeloda | PD | |||
| YPEL3 | SNV | Missense_Mutation | novel | c.413N>G | p.Tyr138Cys | p.Y138C | P61236 | protein_coding | deleterious(0) | probably_damaging(1) | TCGA-A5-A0G2-01 | Endometrium | uterine corpus endometrioid carcinoma | Female | <65 | III/IV | Unknown | Unknown | SD |
| YPEL3 | SNV | Missense_Mutation | rs755667144 | c.194N>A | p.Arg65His | p.R65H | P61236 | protein_coding | tolerated(0.1) | benign(0.168) | TCGA-A5-A0G2-01 | Endometrium | uterine corpus endometrioid carcinoma | Female | <65 | III/IV | Unknown | Unknown | SD |
| YPEL3 | SNV | Missense_Mutation | novel | c.94C>A | p.Pro32Thr | p.P32T | P61236 | protein_coding | tolerated_low_confidence(0.12) | benign(0.027) | TCGA-A5-A2K5-01 | Endometrium | uterine corpus endometrioid carcinoma | Female | >=65 | I/II | Unknown | Unknown | SD |
| YPEL3 | SNV | Missense_Mutation | novel | c.52N>A | p.Leu18Met | p.L18M | P61236 | protein_coding | deleterious_low_confidence(0.02) | probably_damaging(0.934) | TCGA-AP-A059-01 | Endometrium | uterine corpus endometrioid carcinoma | Female | >=65 | I/II | Unknown | Unknown | SD |
| YPEL3 | SNV | Missense_Mutation | novel | c.239A>G | p.Gln80Arg | p.Q80R | P61236 | protein_coding | tolerated(0.21) | probably_damaging(0.948) | TCGA-50-5066-01 | Lung | lung adenocarcinoma | Male | >=65 | I/II | Chemotherapy | carboplatin | SD |
| YPEL3 | SNV | Missense_Mutation | novel | c.158N>T | p.Asp53Val | p.D53V | P61236 | protein_coding | deleterious(0.05) | benign(0.138) | TCGA-85-8355-01 | Lung | lung squamous cell carcinoma | Male | <65 | I/II | Unknown | Unknown | SD |
| YPEL3 | SNV | Missense_Mutation | novel | c.275N>C | p.Val92Ala | p.V92A | P61236 | protein_coding | tolerated(0.23) | benign(0.254) | TCGA-CV-A45Z-01 | Oral cavity | head & neck squamous cell carcinoma | Male | >=65 | I/II | Unknown | Unknown | PD |
| YPEL3 | SNV | Missense_Mutation | novel | c.34N>T | p.Leu12Phe | p.L12F | P61236 | protein_coding | tolerated_low_confidence(0.06) | benign(0.144) | TCGA-F7-A50I-01 | Oral cavity | head & neck squamous cell carcinoma | Male | >=65 | I/II | Unknown | Unknown | SD |
| Page: 1 2 |
Top |
Related drugs of malignant transformation related genes |
| Identification of chemicals and drugs interact with genes involved in malignant transfromation |
| (DGIdb 4.0) |
| Entrez ID | Symbol | Category | Interaction Types | Drug Claim Name | Drug Name | PMIDs |
| Page: 1 |

Copyright 2023-Present -The University of Texas Health Science Center at Houston |