
|
|||||
|
 | |
| |
| |
| |
| |
| |
|
Gene: VTA1 |
Gene summary for VTA1 |
| Gene information | Species | Human | Gene symbol | VTA1 | Gene ID | 51534 |
| Gene name | vesicle trafficking 1 | |
| Gene Alias | 6orf55 | |
| Cytomap | 6q24.1-q24.2 | |
| Gene Type | protein-coding | GO ID | GO:0006810 | UniProtAcc | A0A087WY55 |
Top |
Malignant transformation analysis |
| Identification of the aberrant gene expression in precancerous and cancerous lesions by comparing the gene expression of stem-like cells in diseased tissues with normal stem cells |
| Entrez ID | Symbol | Replicates | Species | Organ | Tissue | Adj P-value | Log2FC | Malignancy |
| 51534 | VTA1 | P127T-E | Human | Esophagus | ESCC | 7.12e-22 | 2.27e-01 | 0.0826 |
| 51534 | VTA1 | P128T-E | Human | Esophagus | ESCC | 1.35e-37 | 1.18e+00 | 0.1241 |
| 51534 | VTA1 | P130T-E | Human | Esophagus | ESCC | 7.78e-69 | 1.52e+00 | 0.1676 |
| 51534 | VTA1 | HCC1_Meng | Human | Liver | HCC | 6.25e-45 | 2.39e-02 | 0.0246 |
| 51534 | VTA1 | HCC2_Meng | Human | Liver | HCC | 3.05e-22 | 7.21e-02 | 0.0107 |
| 51534 | VTA1 | HCC1 | Human | Liver | HCC | 1.51e-04 | 3.17e+00 | 0.5336 |
| 51534 | VTA1 | HCC2 | Human | Liver | HCC | 3.09e-09 | 3.28e+00 | 0.5341 |
| 51534 | VTA1 | S014 | Human | Liver | HCC | 1.21e-20 | 7.90e-01 | 0.2254 |
| 51534 | VTA1 | S015 | Human | Liver | HCC | 4.80e-22 | 1.06e+00 | 0.2375 |
| 51534 | VTA1 | S016 | Human | Liver | HCC | 7.17e-32 | 9.10e-01 | 0.2243 |
| 51534 | VTA1 | S027 | Human | Liver | HCC | 5.56e-08 | 4.72e-01 | 0.2446 |
| 51534 | VTA1 | S028 | Human | Liver | HCC | 7.22e-11 | 5.27e-01 | 0.2503 |
| 51534 | VTA1 | S029 | Human | Liver | HCC | 2.59e-16 | 7.68e-01 | 0.2581 |
| 51534 | VTA1 | C04 | Human | Oral cavity | OSCC | 2.17e-08 | 7.19e-01 | 0.2633 |
| 51534 | VTA1 | C21 | Human | Oral cavity | OSCC | 5.32e-31 | 9.74e-01 | 0.2678 |
| 51534 | VTA1 | C30 | Human | Oral cavity | OSCC | 1.27e-50 | 2.42e+00 | 0.3055 |
| 51534 | VTA1 | C43 | Human | Oral cavity | OSCC | 1.19e-16 | 4.54e-01 | 0.1704 |
| 51534 | VTA1 | C46 | Human | Oral cavity | OSCC | 2.45e-08 | 3.15e-01 | 0.1673 |
| 51534 | VTA1 | C51 | Human | Oral cavity | OSCC | 9.56e-07 | 5.69e-01 | 0.2674 |
| 51534 | VTA1 | C57 | Human | Oral cavity | OSCC | 1.51e-06 | 4.39e-01 | 0.1679 |
| Page: 1 2 3 4 5 6 |
| Tissue | Expression Dynamics | Abbreviation |
| Esophagus | 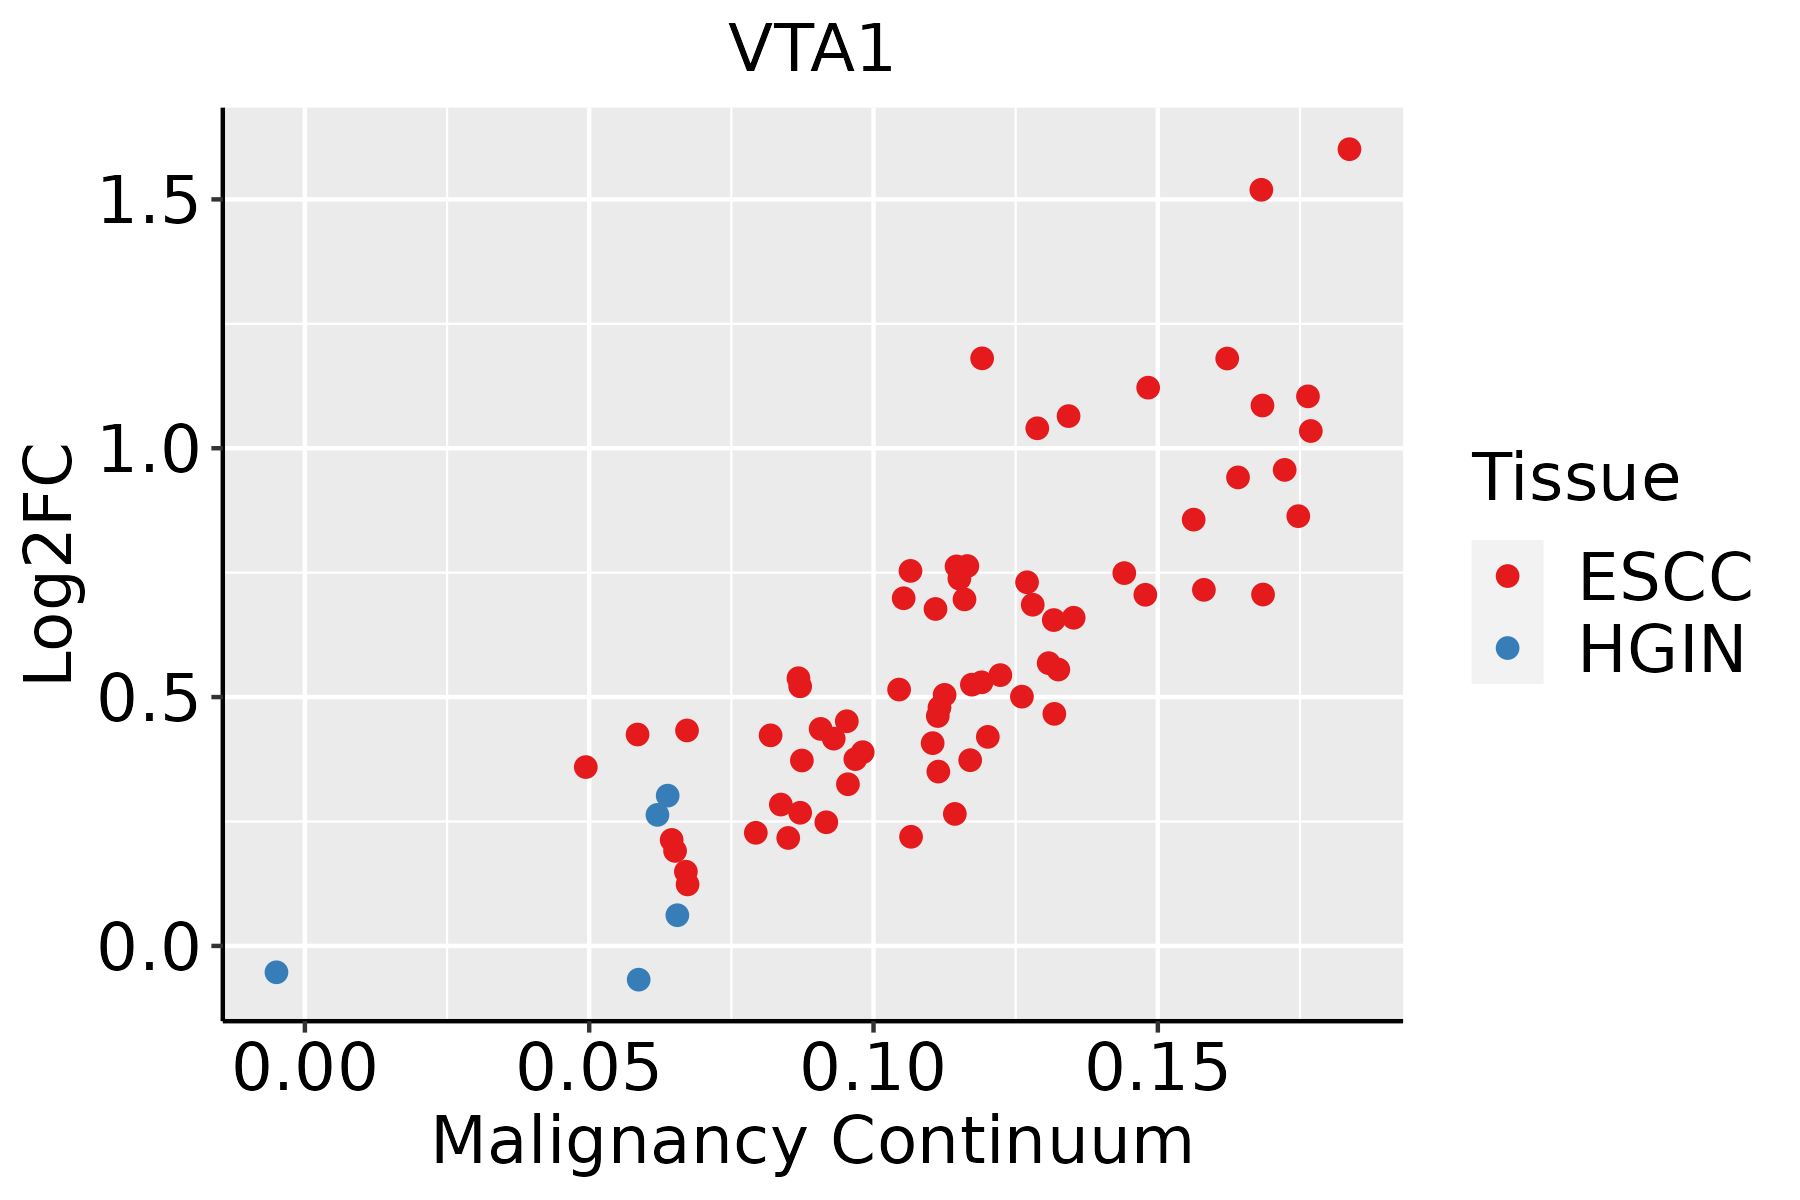 | ESCC: Esophageal squamous cell carcinoma |
| HGIN: High-grade intraepithelial neoplasias | ||
| LGIN: Low-grade intraepithelial neoplasias | ||
| Liver | 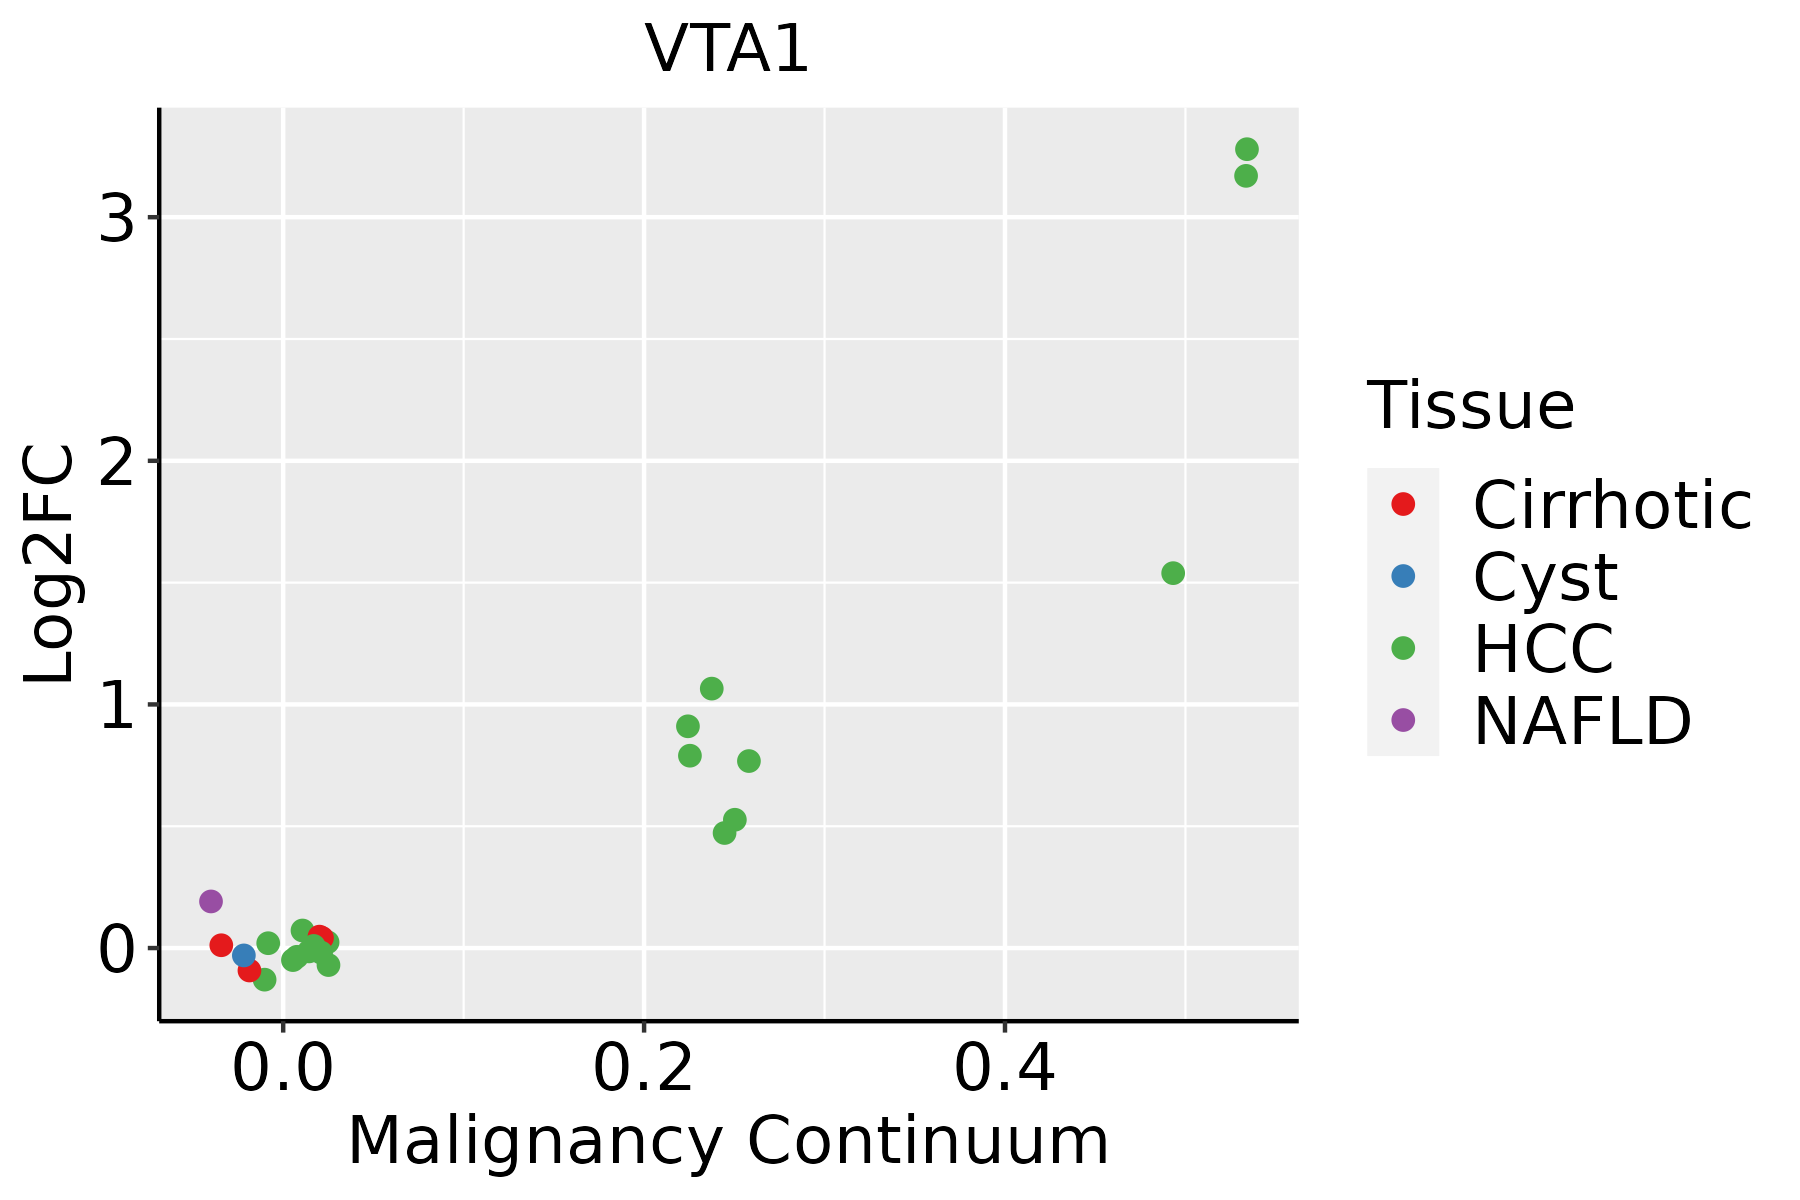 | HCC: Hepatocellular carcinoma |
| NAFLD: Non-alcoholic fatty liver disease | ||
| Oral Cavity | 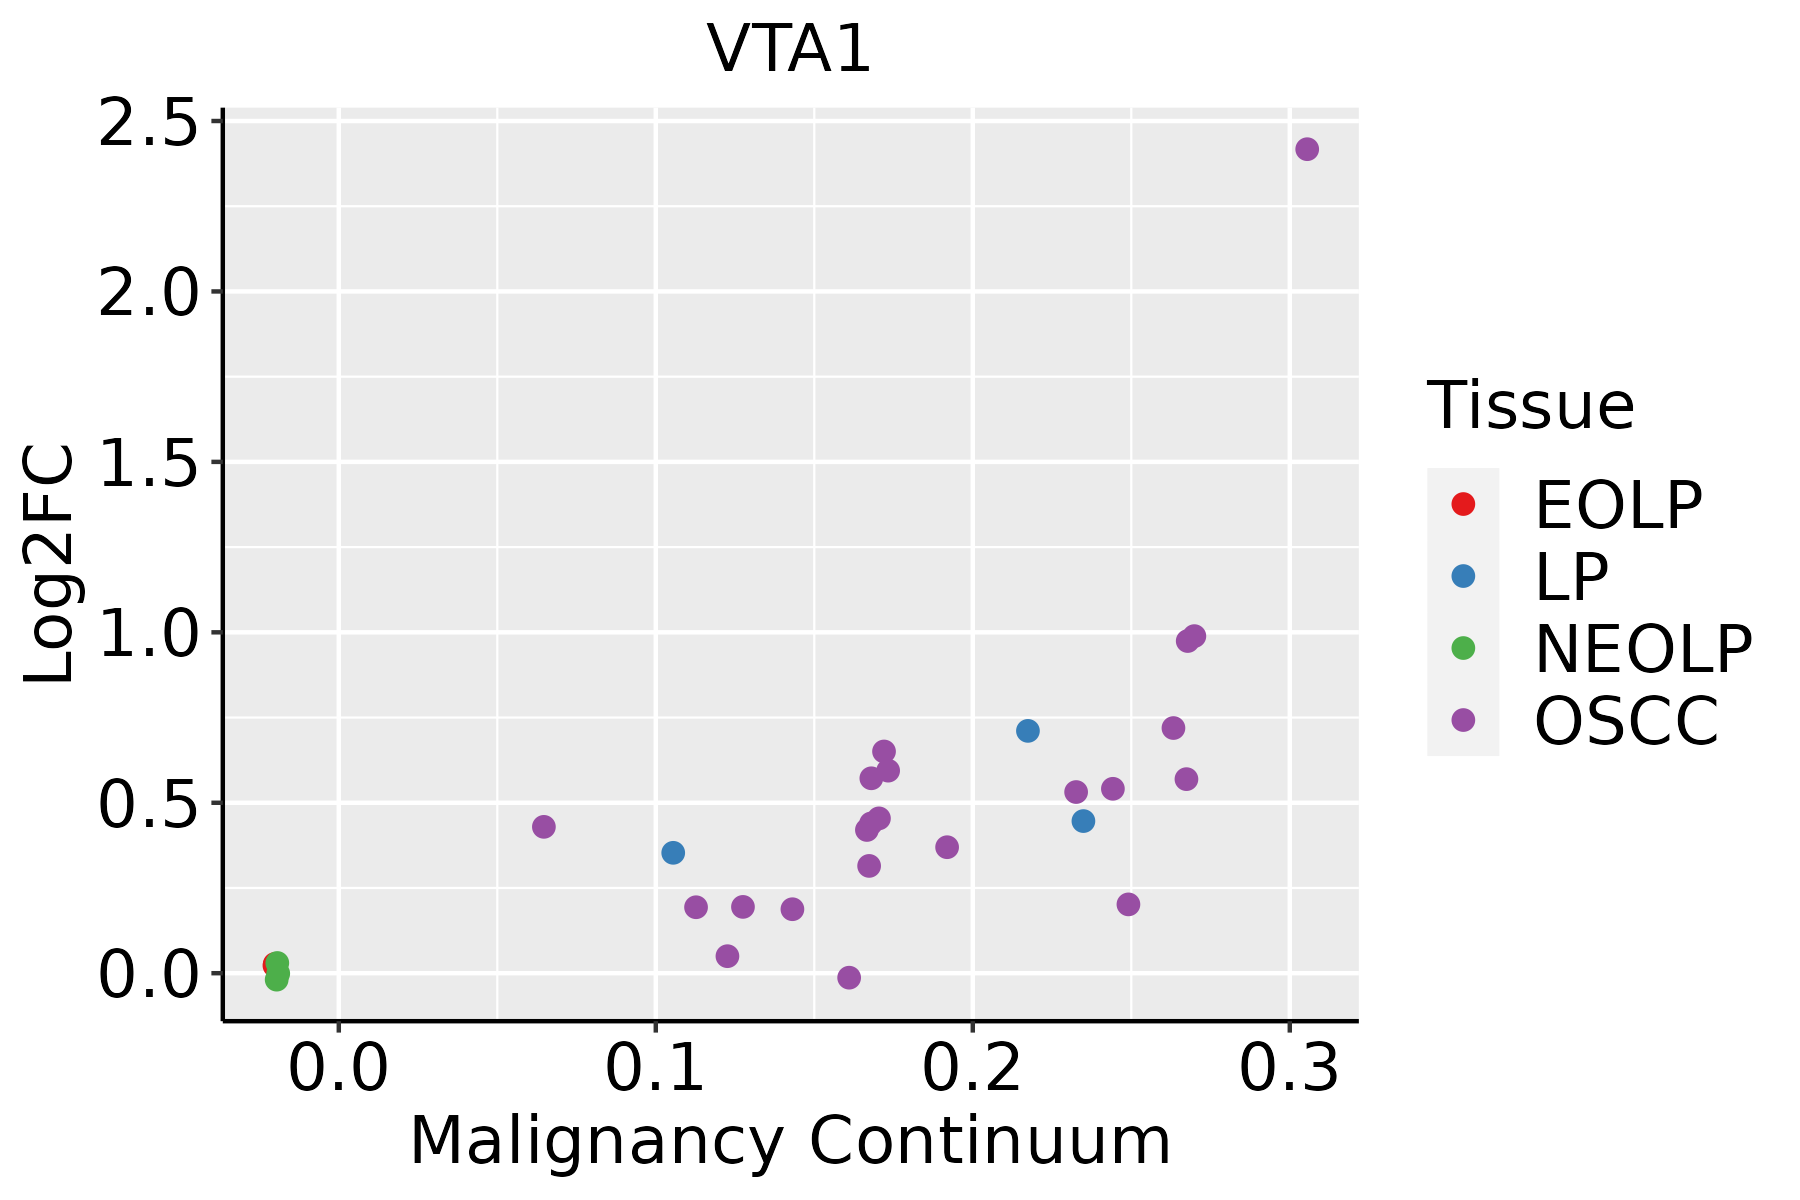 | EOLP: Erosive Oral lichen planus |
| LP: leukoplakia | ||
| NEOLP: Non-erosive oral lichen planus | ||
| OSCC: Oral squamous cell carcinoma | ||
| Skin |  | AK: Actinic keratosis |
| cSCC: Cutaneous squamous cell carcinoma | ||
| SCCIS:squamous cell carcinoma in situ | ||
| Thyroid |  | ATC: Anaplastic thyroid cancer |
| HT: Hashimoto's thyroiditis | ||
| PTC: Papillary thyroid cancer |
| ∗log2FC in expression of this searched gene in stem-like cells from each diseased tissue sample relative to stem-like cells in normal samples in each tissue plotted against the malignancy continuum. Samples are colored based on if they are from different disease stage. |
Top |
Malignant transformation related pathway analysis |
| Find out the enriched GO biological processes and KEGG pathways involved in transition from healthy to precancer to cancer |
| Tissue | Disease Stage | Enriched GO biological Processes |
| Colorectum | AD |  |
| Colorectum | SER |  |
| Colorectum | MSS |  |
| Colorectum | MSI-H |  |
| Colorectum | FAP |  |
| ∗Top 15 enriched GO BP terms are showed in the bar plot of each disease state in each tissue. Each row represents a significant GO biological process which is colored according to the -log10(p.adjust). |
| Page: 1 2 3 4 5 6 7 8 9 |
| GO ID | Tissue | Disease Stage | Description | Gene Ratio | Bg Ratio | pvalue | p.adjust | Count |
| GO:0016032111 | Esophagus | ESCC | viral process | 301/8552 | 415/18723 | 3.34e-29 | 1.32e-26 | 301 |
| GO:001623617 | Esophagus | ESCC | macroautophagy | 216/8552 | 291/18723 | 1.94e-23 | 4.57e-21 | 216 |
| GO:0022411111 | Esophagus | ESCC | cellular component disassembly | 305/8552 | 443/18723 | 1.94e-23 | 4.57e-21 | 305 |
| GO:0019058111 | Esophagus | ESCC | viral life cycle | 226/8552 | 317/18723 | 1.17e-20 | 1.76e-18 | 226 |
| GO:001605014 | Esophagus | ESCC | vesicle organization | 211/8552 | 300/18723 | 2.85e-18 | 2.87e-16 | 211 |
| GO:001619715 | Esophagus | ESCC | endosomal transport | 168/8552 | 230/18723 | 2.28e-17 | 1.93e-15 | 168 |
| GO:000703417 | Esophagus | ESCC | vacuolar transport | 119/8552 | 157/18723 | 1.16e-14 | 6.30e-13 | 119 |
| GO:003298416 | Esophagus | ESCC | protein-containing complex disassembly | 151/8552 | 224/18723 | 3.45e-11 | 1.15e-09 | 151 |
| GO:003625714 | Esophagus | ESCC | multivesicular body organization | 30/8552 | 31/18723 | 1.04e-09 | 2.50e-08 | 30 |
| GO:003625814 | Esophagus | ESCC | multivesicular body assembly | 29/8552 | 30/18723 | 2.21e-09 | 4.99e-08 | 29 |
| GO:007198514 | Esophagus | ESCC | multivesicular body sorting pathway | 34/8552 | 37/18723 | 3.49e-09 | 7.39e-08 | 34 |
| GO:003250915 | Esophagus | ESCC | endosome transport via multivesicular body sorting pathway | 29/8552 | 31/18723 | 1.92e-08 | 3.72e-07 | 29 |
| GO:000703214 | Esophagus | ESCC | endosome organization | 61/8552 | 82/18723 | 1.13e-07 | 1.85e-06 | 61 |
| GO:001906815 | Esophagus | ESCC | virion assembly | 31/8552 | 35/18723 | 1.40e-07 | 2.25e-06 | 31 |
| GO:00453245 | Esophagus | ESCC | late endosome to vacuole transport | 23/8552 | 25/18723 | 1.39e-06 | 1.69e-05 | 23 |
| GO:004675514 | Esophagus | ESCC | viral budding | 23/8552 | 26/18723 | 6.82e-06 | 6.90e-05 | 23 |
| GO:00325113 | Esophagus | ESCC | late endosome to vacuole transport via multivesicular body sorting pathway | 16/8552 | 17/18723 | 3.46e-05 | 2.82e-04 | 16 |
| GO:19048965 | Esophagus | ESCC | ESCRT complex disassembly | 10/8552 | 10/18723 | 3.94e-04 | 2.26e-03 | 10 |
| GO:19049035 | Esophagus | ESCC | ESCRT III complex disassembly | 10/8552 | 10/18723 | 3.94e-04 | 2.26e-03 | 10 |
| GO:001603222 | Liver | HCC | viral process | 286/7958 | 415/18723 | 4.41e-28 | 1.86e-25 | 286 |
| Page: 1 2 3 4 5 6 7 |
| Pathway ID | Tissue | Disease Stage | Description | Gene Ratio | Bg Ratio | pvalue | p.adjust | qvalue | Count |
| hsa04144210 | Esophagus | ESCC | Endocytosis | 186/4205 | 251/8465 | 9.74e-16 | 4.66e-14 | 2.39e-14 | 186 |
| hsa0414437 | Esophagus | ESCC | Endocytosis | 186/4205 | 251/8465 | 9.74e-16 | 4.66e-14 | 2.39e-14 | 186 |
| hsa0414422 | Liver | HCC | Endocytosis | 178/4020 | 251/8465 | 2.03e-14 | 5.22e-13 | 2.91e-13 | 178 |
| hsa0414432 | Liver | HCC | Endocytosis | 178/4020 | 251/8465 | 2.03e-14 | 5.22e-13 | 2.91e-13 | 178 |
| hsa0414427 | Oral cavity | OSCC | Endocytosis | 174/3704 | 251/8465 | 9.42e-17 | 4.51e-15 | 2.29e-15 | 174 |
| hsa04144112 | Oral cavity | OSCC | Endocytosis | 174/3704 | 251/8465 | 9.42e-17 | 4.51e-15 | 2.29e-15 | 174 |
| hsa0414428 | Oral cavity | LP | Endocytosis | 121/2418 | 251/8465 | 1.89e-11 | 3.70e-10 | 2.38e-10 | 121 |
| hsa0414436 | Oral cavity | LP | Endocytosis | 121/2418 | 251/8465 | 1.89e-11 | 3.70e-10 | 2.38e-10 | 121 |
| Page: 1 |
Top |
Cell-cell communication analysis |
| Identification of potential cell-cell interactions between two cell types and their ligand-receptor pairs for different disease states |
| Ligand | Receptor | LRpair | Pathway | Tissue | Disease Stage |
| Page: 1 |
Top |
Single-cell gene regulatory network inference analysis |
| Find out the significant the regulons (TFs) and the target genes of each regulon across cell types for different disease states |
| TF | Cell Type | Tissue | Disease Stage | Target Gene | RSS | Regulon Activity |
| ∗The dot plots of a searched regulon are shown for all cell subpopulations in each disease state of each tissue based on the regulon specific score inferred using pySCENIC and by calculating the average expression. |
| Page: 1 |
Top |
Somatic mutation of malignant transformation related genes |
| Annotation of somatic variants for genes involved in malignant transformation |
| Hugo Symbol | Variant Class | Variant Classification | dbSNP RS | HGVSc | HGVSp | HGVSp Short | SWISSPROT | BIOTYPE | SIFT | PolyPhen | Tumor Sample Barcode | Tissue | Histology | Sex | Age | Stage | Therapy Types | Drugs | Outcome |
| VTA1 | SNV | Missense_Mutation | novel | c.241N>G | p.Thr81Ala | p.T81A | Q9NP79 | protein_coding | deleterious(0.03) | benign(0.378) | TCGA-EW-A1IZ-01 | Breast | breast invasive carcinoma | Female | <65 | III/IV | Chemotherapy | taxotere | SD |
| VTA1 | SNV | Missense_Mutation | novel | c.642T>G | p.Ile214Met | p.I214M | Q9NP79 | protein_coding | deleterious(0.03) | possibly_damaging(0.776) | TCGA-2W-A8YY-01 | Cervix | cervical & endocervical cancer | Female | <65 | I/II | Chemotherapy | cisplatin | CR |
| VTA1 | SNV | Missense_Mutation | novel | c.372N>C | p.Leu124Phe | p.L124F | Q9NP79 | protein_coding | deleterious(0) | probably_damaging(0.998) | TCGA-HM-A4S6-01 | Cervix | cervical & endocervical cancer | Female | <65 | III/IV | Chemotherapy | cisplatin | CR |
| VTA1 | SNV | Missense_Mutation | c.814N>T | p.Ala272Ser | p.A272S | Q9NP79 | protein_coding | deleterious(0) | probably_damaging(0.999) | TCGA-AA-3710-01 | Colorectum | colon adenocarcinoma | Female | >=65 | I/II | Unknown | Unknown | SD | |
| VTA1 | SNV | Missense_Mutation | c.235N>A | p.Ala79Thr | p.A79T | Q9NP79 | protein_coding | deleterious(0) | possibly_damaging(0.491) | TCGA-AA-3811-01 | Colorectum | colon adenocarcinoma | Female | >=65 | III/IV | Unknown | Unknown | PD | |
| VTA1 | SNV | Missense_Mutation | c.655N>T | p.His219Tyr | p.H219Y | Q9NP79 | protein_coding | tolerated(0.24) | probably_damaging(0.924) | TCGA-AZ-6598-01 | Colorectum | colon adenocarcinoma | Female | >=65 | I/II | Unknown | Unknown | SD | |
| VTA1 | SNV | Missense_Mutation | novel | c.518N>G | p.Asn173Ser | p.N173S | Q9NP79 | protein_coding | tolerated(0.47) | benign(0.005) | TCGA-AX-A1CE-01 | Endometrium | uterine corpus endometrioid carcinoma | Female | <65 | I/II | Unspecific | Paclitaxel | SD |
| VTA1 | SNV | Missense_Mutation | rs776504793 | c.647N>T | p.Pro216Leu | p.P216L | Q9NP79 | protein_coding | deleterious(0) | possibly_damaging(0.633) | TCGA-AX-A2HD-01 | Endometrium | uterine corpus endometrioid carcinoma | Female | >=65 | III/IV | Unknown | Unknown | SD |
| VTA1 | SNV | Missense_Mutation | c.692N>A | p.Ser231Asn | p.S231N | Q9NP79 | protein_coding | tolerated(0.52) | benign(0.009) | TCGA-BS-A0U8-01 | Endometrium | uterine corpus endometrioid carcinoma | Female | <65 | III/IV | Chemotherapy | doxorubicin | SD | |
| VTA1 | SNV | Missense_Mutation | c.636A>G | p.Ile212Met | p.I212M | Q9NP79 | protein_coding | tolerated(0.1) | possibly_damaging(0.844) | TCGA-D1-A15X-01 | Endometrium | uterine corpus endometrioid carcinoma | Female | <65 | I/II | Unknown | Unknown | SD |
| Page: 1 2 3 4 |
Top |
Related drugs of malignant transformation related genes |
| Identification of chemicals and drugs interact with genes involved in malignant transfromation |
| (DGIdb 4.0) |
| Entrez ID | Symbol | Category | Interaction Types | Drug Claim Name | Drug Name | PMIDs |
| Page: 1 |

Copyright 2023-Present -The University of Texas Health Science Center at Houston |